


1、旋转矩阵转旋转向量
def logS03(R):
    costheta = (R[0, 0]+R[1, 1]+R[2, 2]-1.0)*0.5
    w = np.array([(R[2, 1] - R[1, 2]) / 2, (R[0, 2] - R[2, 0]) /
                  2, (R[1, 0] - R[0, 1]) / 2])
    theata = np.arccos(costheta)  #弧度
    s = np.sin(theata)
    rotation = w/s                #方向向量,未归一画
    return rotation, theata
输入R值:
[[ 6.12323400e-17  0.00000000e+00  1.00000000e+00]
 [ 1.00000000e+00  6.12323400e-17 -6.12323400e-17]
 [-6.12323400e-17  1.00000000e+00  3.74939946e-33]]
输出值: (角度是弧度)
[0.57735027 0.57735027 0.57735027] 2.09439510239319532、固定坐标系旋转
左乘是固定坐标系进行操作
import math
from mpl_toolkits.mplot3d import Axes3D
import matplotlib.pyplot as plt
import numpy as np

# 初始化一个旋转角度
angle = 90/180*math.pi
# 创建一个三维坐标变换矩阵
transform_matrix_z = np.array([
    [math.cos(angle), -math.sin(angle), 0],
    [math.sin(angle), math.cos(angle), 0],
    [0, 0, 1]])  # 绕z轴

transform_matrix_x = np.array([
    [1, 0, 0],
    [0, math.cos(angle), -math.sin(angle)],
    [0, math.sin(angle), math.cos(angle)]])  # 绕x轴

transform_matrix_y = np.array([
    [math.cos(angle), 0, math.sin(angle)],
    [0, 1, 0],
    [-math.sin(angle), 0, math.cos(angle)]])  # 绕y轴


fig = plt.figure(figsize=(10, 8))
ax = Axes3D(fig)

ax.scatter3D(0, 0, 0, s=5)
ax.text3D(0, 0, 0, "(0,0,0)")
ax.text3D(5, 0, 0, "X")
ax.text3D(0, 5, 0, "Y")
ax.text3D(0, 0, 5, "Z")
ax.plot3D([0, 5], [0, 0], [0, 0], marker='>', linewidth=2)
ax.plot3D([0, 0], [0, 5], [0, 0], marker='>', linewidth=2)
ax.plot3D([0, 0], [0, 0], [0, 5], marker='>', linewidth=2)

z = np.linspace(0, 4, 200)
x = z * np.sin(20 * z)
y = z * np.cos(20 * z)
A = np.array([list(x), list(y), list(z)])
'''旋转方向'''
R = transform_matrix_x
# 左乘是指坐标系保持不动,
R2 = np.matmul(transform_matrix_y, transform_matrix_x)
A1 = np.matmul(R, A)
A2 = np.matmul(R2, A)
ax.plot3D(A[0], A[1], A[2], marker='o',color='r')
ax.plot3D(A1[0], A1[1], A1[2], marker='>',color='g')
ax.plot3D(A2[0], A2[1], A2[2], marker='+',color='b')

plt.rcParams.update({'font.family': 'Times New Roman'})
plt.rcParams.update({'font.weight': 'normal'})
plt.rcParams.update({'font.size': 20})
ax.set_xlabel('X axis')
ax.set_ylabel('Y axis')
ax.set_zlabel('Z axis')
plt.show()
如代码所示中:(原位置先绕X轴旋转90度,再绕Y轴旋转90度)
R2 = np.matmul(transform_matrix_y, transform_matrix_x)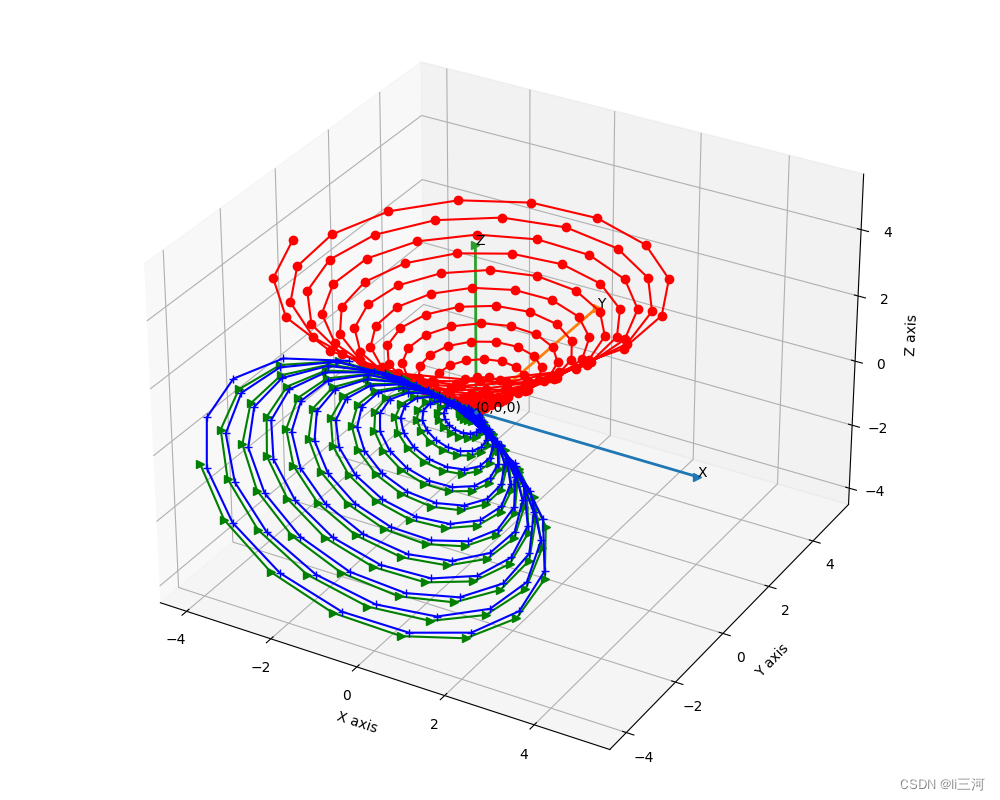
图中红色是原始点。
绿色是绕X轴的数据。
蓝色是先绕X轴旋转,再绕Y轴旋转
3、旋转方向
在2中给的角度值为90度,接下来测试的角度值为-90度。
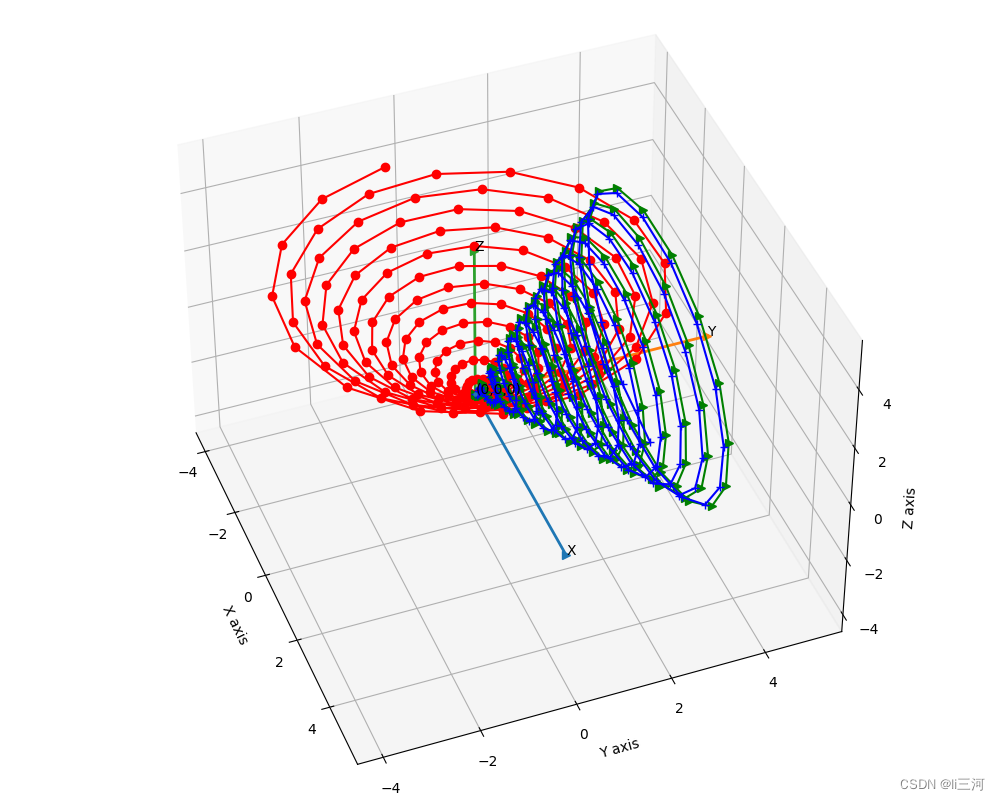
通过分析可知,度数为正值,沿着对应轴逆时针进行,度数为负值,沿着对应轴顺时针进行。


 7338
7338


 被折叠的 条评论
为什么被折叠?
被折叠的 条评论
为什么被折叠?
 到【灌水乐园】发言


