


This dataset provides a high quality Climate Data Record (CDR) of global infrared measurements from geostationary satellites.
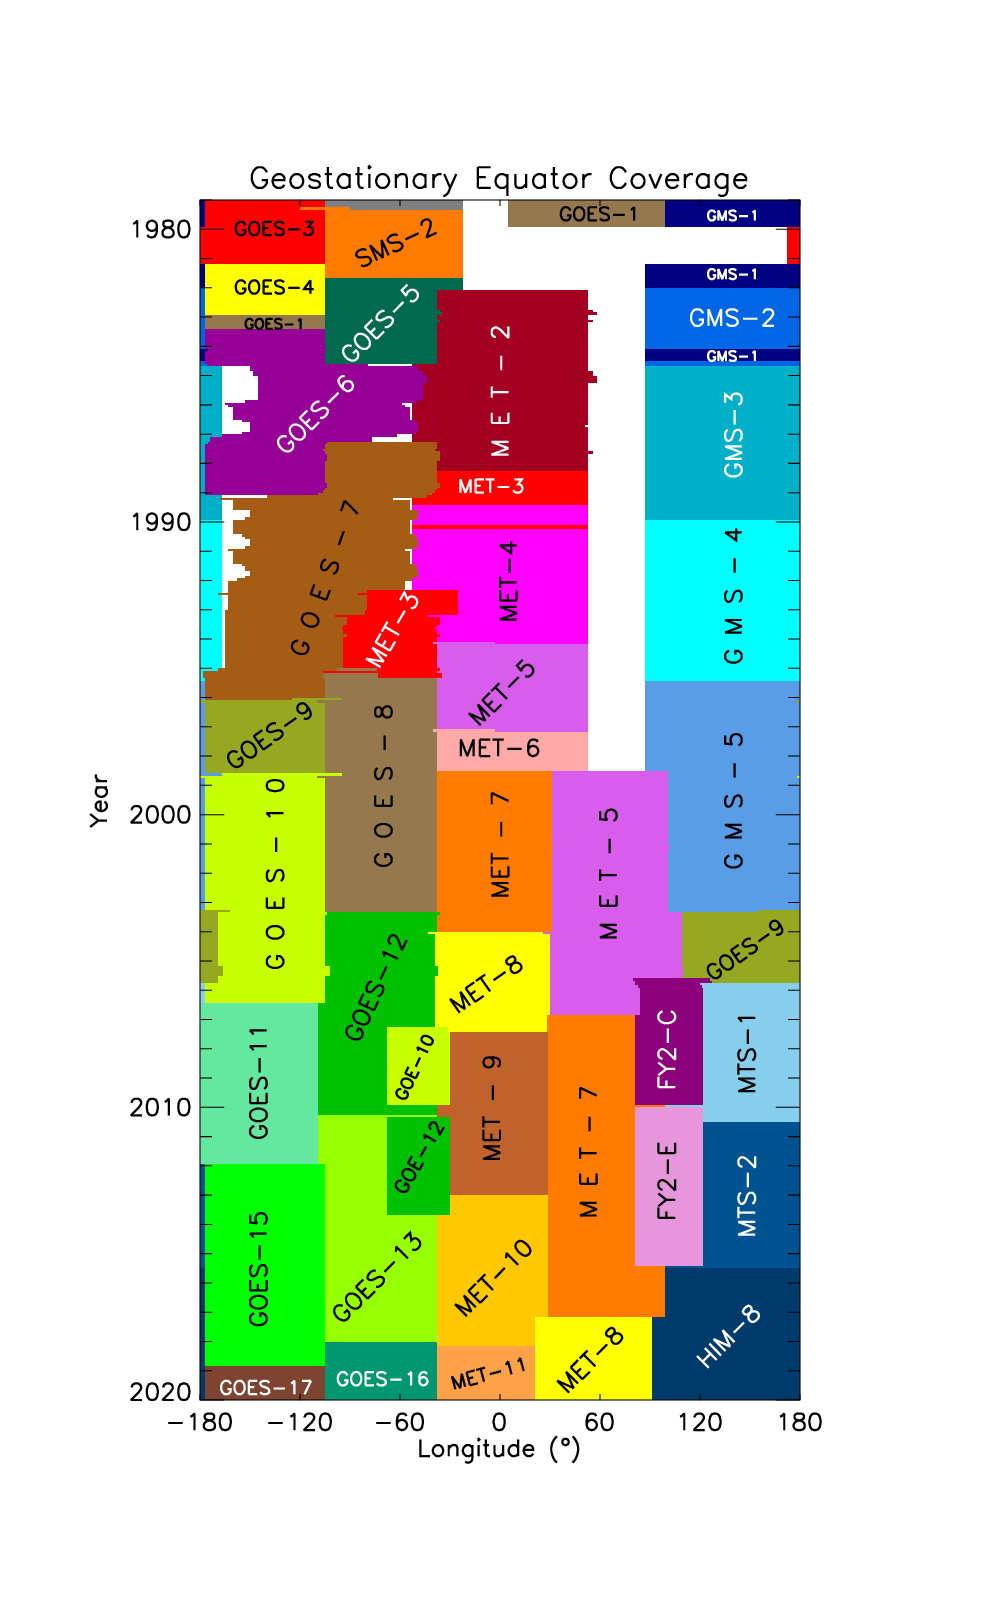
The geostationary satellite data (GridSat-B1) provides data from 3 channels: the CDR-quality infrared window (IRWIN) channel (near 11μm), the visible channel (near 0.6μm) and the infrared water vapor (IRWVP) channel (near 6.7μm). The GridSat-B1 data is projected onto a global 0.07 degree latitude equal-angle grid with date coverage spanning from 1980-present. This data is sourced from the 3-hourly International Satellite Cloud Climatology Project (ISCCP) B1 data. The satellites included in this dataset with their longitudinal coverage over time can be seen here. In regions of overlap the CDR methodology merges satellites by selecting the nadir-most observations for each grid point.
Notes:
-
Mappings from satid to satellite name are contained in the image's properties as satid_number: "satellite_name", e.g. satid_0: GOES-13, satid_1: GOES-15, and satid_2: GOES-16.
-
IRWIN data has been corrected for view zenith angle, but this correction is not perfect. It also treats all satellites the same way, whereas the view zenith angle dependence will vary by satellite. Some VZA residual will be apparent.
-
IRWVP data has no view zenith angle correction and is not CDR quality.
-
VSCHN data has no view zenith angle corrections and is not CDR quality.
-
Removing the View Zenigth Angle correction for the IRWIN channels can be done with the following: Original_temperature_observed = irwin_cdr - irwin_vza_adj
该数据集提供了来自静止卫星的全球红外测量的高质量气候数据记录(CDR)。
地球静止卫星数据(GridSat-B1)提供了3个频道的数据:CDR质量的红外窗口(IRWIN)频道(接近11μm),可见光频道(接近0.6μm)和红外水汽(IRWVP)频道(接近6.7μm)。GridSat-B1的数据被投射到一个全球0.07度纬度的等角网格上,日期覆盖从1980年至今。该数据来自于每3小时一次的国际卫星云雾学项目(ISCCP)B1数据。该数据集所包含的卫星及其纵向覆盖范围可以在这里看到。在重叠的区域,CDR方法通过选择每个网格点的最底线的观测数据来合并卫星。
备注。
从satid到卫星名称的映射包含在图像的属性中,即satid_number: "satellite_name",例如satid_0: GOES-13,satid_1: GOES-15,satid_2: GOES-16。
IRWIN数据已经对视图天顶角进行了校正,但这种校正并不完美。它对所有卫星的处理方式也是一样的,而视线天顶角的依赖性会因卫星而异。一些VZA残余将是明显的。
IRWVP数据没有视区天顶角校正,不符合CDR质量。
VSCHN数据没有视图天顶角校正,不是CDR质量。
移除IRWIN通道的视图天顶角校正可以通过以下方式完成。Original_temperature_observed = irwin_cdr - irwin_vza_adj
Dataset Availability
1980-01-01T00:00:00 - 2021-06-30T00:00:00
Dataset Provider
Collection Snippet
ee.ImageCollection("NOAA/CDR/GRIDSAT-B1/V2")
Resolution
7792 meters
Bands Table
| Name | Description | Min* | Max* | Units | Scale | Offset |
|---|---|---|---|---|---|---|
| irwin_cdr | Brightness temperature near 11μm, nadir-most observation | -2093 | 13615 | K | 0.01 | 200 |
| irwin_2 | Brightness temperature near 11μm, second-best observation (based on view zenith angle) | -4123 | 13579 | K | 0.01 | 200 |
| irwin_3 | Brightness temperature, third-best observation based on view zenith angle | -1624 | 14240 | K | 0.01 | 200 |
| irwvp | Brightness temperature near 6.7μm, nadir-most observation | -5907 | 10219 | K | 0.01 | 200 |
| irwvp_2 | Brightness temperature near 6.7μm, second-best observation based on view zenith angle | -5081 | 10260 | K | 0.01 | 200 |
| vschn | Visible reflectance near 0.6μm, nadir-most observation | -25000 | 4275 | 0.00004 | 1 | |
| vschn_2 | Visible reflectance near 0.6μm, second-best observation based on view zenith angle | -25000 | 3800 | 0.00004 | 1 | |
| irwin_vza_adj | Adjustment made to all IRWIN channels. Provided to allow users to reverse the view zenith correction for the irwin_cdr variable. | 36 | 171 | K | 0.25 | -10 |
| satid_ir1 | satid values for irwin_cdr. For this and other satid bands, the mappings of satid to satellite name are given in the properties for each image | 0 | 5 | 0 | 0 | |
| satid_ir2 | satid values per pixel for irwin_2 | 0 | 5 | 0 | 0 | |
| satid_ir3 | satid values per pixel for irwin_3 | 0 | 5 | 0 | 0 | |
| satid_wv1 | satid values per pixel for irwvp | 0 | 5 | 0 | 0 | |
| satid_wv2 | satid values per pixel for irwvp2 | 0 | 5 | 0 | 0 | |
| satid_vs1 | satid values per pixel for vischn | 0 | 5 | 0 | 0 | |
| satid_vs2 | satid values per pixel for vischn2 | 0 | 5 | 0 | 0 |
* = Values are estimated
影像属性:
| Name | Type | Description |
|---|---|---|
| satid_0 | String | Satellite name (see notes) |
| satid_1 | String | Satellite name (see notes) |
| satid_2 | String | Satellite name (see notes) |
| satid_3 | String | Satellite name (see notes) |
| satid_4 | String | Satellite name (see notes) |
| satid_5 | String | Satellite name (see notes) |
数据说明:
The NOAA CDR Program’s official distribution point for CDRs is NOAA’s National Climatic Data Center which provides sustained, open access and active data management of the CDR packages and related information in keeping with the United States’ open data policies and practices as described in the President's Memorandum on "Open Data Policy" and pursuant to the Executive Order of May 9, 2013, "Making Open and Machine Readable the New Default for Government Information". In line with these policies, the CDR data sets are nonproprietary, publicly available, and no restrictions are placed upon their use. For more information, see the Fair Use of NOAA's CDR Data Sets, Algorithms and Documentation pdf.
引用:
Kenneth R. Knapp, and NOAA CDR Program (2014): NOAA Climate Data Record (CDR) of Gridded Satellite Data from ISCCP B1 (GridSat-B1) 11 micron Brightness Temperature, Version 2. [indicate subset used]. NOAA National Climatic Data Center. doi:10.7289/V59P2ZKR [access date].
Knapp, K. R., S. Ansari, C. L. Bain, M. A. Bourassa, M. J. Dickinson, C. Funk, C. N. Helms, C. C. Hennon, C. D. Holmes, G. J. Huffman, J. P. Kossin, H.-T. Lee, A. Loew, and G. Magnusdottir, 2011: Globally gridded satellite (GridSat) observations for climate studies. Bulletin of the American Meteorological Society, 92, 893-907. doi:10.1175/2011BAMS3039.1
代码:
var dataset = ee.ImageCollection('NOAA/CDR/GRIDSAT-B1/V2')
                  .filter(ee.Filter.date('2017-05-01', '2017-05-14'));
var brightnessTemp = dataset.select(['irwin_cdr', 'vschn', 'irwvp']);
var brightnessTempVis = {
  min: 500.0,
  max: 10000.0,
};
Map.setCenter(7.71, 17.93, 2);
Map.addLayer(brightnessTemp, brightnessTempVis, 'Brightness Temperature');


 411
411


 被折叠的 条评论
为什么被折叠?
被折叠的 条评论
为什么被折叠?
 到【灌水乐园】发言


