


 GISD30是一个基于Landsat卫星数据的全球30米分辨率不透水表面动态数据集,自1985年至2020年,它在城市可持续发展、碳排放评估及生态建模中提供重要信息。利用GoogleEarthEngine的云计算,该数据集展示了不透水面的时空变化,准确度高达90.1%,揭示了全球尤其是亚洲显著的城市扩张趋势。
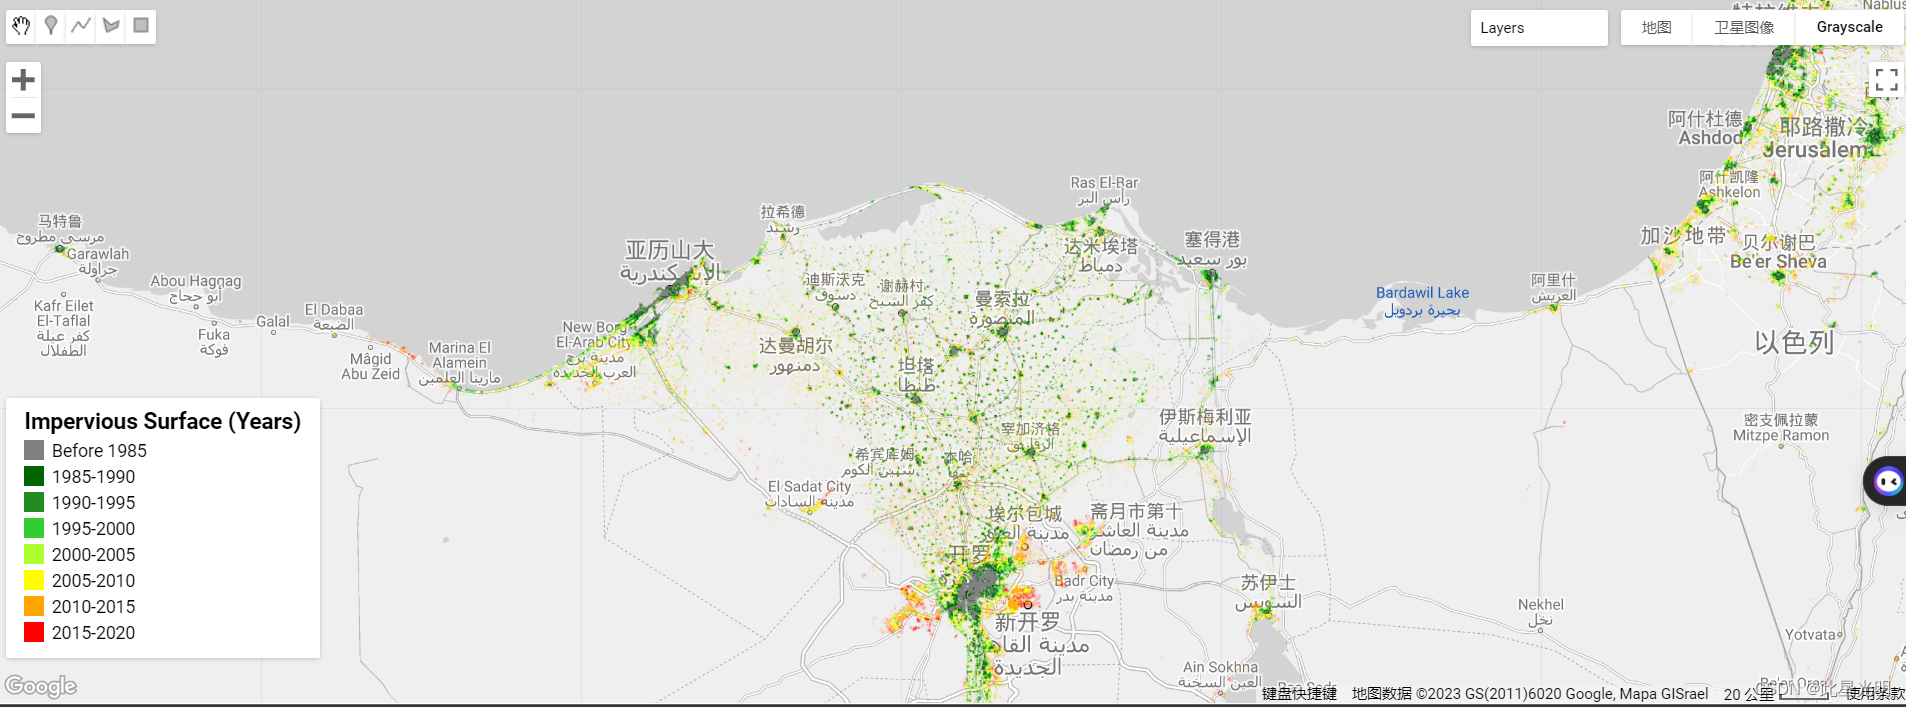
全球 30 米不透水表面动态数据集 (GISD30)
全球 30 米不透水表面动态数据集 (GISD30) 为了解 1985 年至 2020 年全球不断变化的不透水表面景观提供了宝贵的资源。该数据集在城市可持续发展、人为碳排放评估和全球生态环境建模等领域具有深远的科学意义和实际应用价值。GISD30 是通过一种创新的自动化方法精心创建的,该方法充分利用了光谱泛化和自动样本提取策略的优势。该数据集利用谷歌地球引擎云计算平台上的时间序列大地遥感卫星图像,提供了有关不透水表面动态的全面见解。
在数据集创建过程中,自动提取了全球训练样本和相应的反射光谱,从而提高了准确性和可靠性。考虑到不透水表面在不同时间和地理瓦片上的动态性质,采用了时空自适应分类模型。此外,还引入了时空一致性校正方法,以提高不透水表面动态的可靠性。GISD30 动态模型的准确度非常高,总体准确度为 90.1%,卡帕系数为 0.865,并通过 23,322 个全球时间序列样本的大量数据集进行了验证。通过该数据集,我们可以深入了解从 1985 年到 2020 年的 35 年间,全球不透水表面积翻了一番,其中亚洲的增幅最大。GISD30 数据集可免费访问,是在区域和全球范围内监测城市化的重要工具,为各种应用提供了宝贵的支持。在此访问该数据集(Liu 等人,2021b)。
全球动态数据集用于标注单一波段的扩展信息;具体而言,1985 年前的透水面积和不透水面积分别标注为 0 和 1,1985-1990 年、1990-1995 年、1995-2000 年、2000-2005 年、2005-2010 年、2010-2015 年和 2015-2020 年期间扩展的不透水面积分别标注为 2、3、4、5、6、7 和 8。
波段
| Years | Impervious Surface Labels |
|---|---|
| Before 1985 | 1 |
| 1985–1990 | 2 |
| 1990–1995 | 3 |
| 1995–2000 | 4 |
| 2000–2005 | 5 |
| 2005–2010 | 6 |
| 2010–2015 | 7 |
| 2015–2020 | 8 |
引用
Zhang, X., Liu, L., Zhao, T., Gao, Y., Chen, X., and Mi, J.: GISD30: global 30 m impervious-surface dynamic dataset from 1985 to 2020 using
time-series Landsat imagery on the Google Earth Engine platform, Earth Syst. Sci. Data, 14, 1831–1856,
https://doi.org/10.5194/essd-14-1831-2022, 2022
数据引用
Liangyun,Liu; Xiao,Zhang; Tingting,Zhao; Yuan,Gao; Xidong,Chen; Jun,Mi. (2021). GISD30: global 30-m impervious surface dynamic dataset from 1985 to
2020 using time-series Landsat imagery on the Google Earth Engine platform [Data set]. Zenodo. https://doi.org/10.5281/zenodo.5220816
代码
var gisd30 = ee.Image("projects/sat-io/open-datasets/GISD30_1985_2020");

//zoom to an urban center
Map.setCenter(31.16387, 30.97292,8)

var palette = ["#808080", "#006400", "#228B22", "#32CD32", "#ADFF2F", "#FFFF00", "#FFA500", "#FF0000"];

var snazzy = require("users/aazuspan/snazzy:styles");
snazzy.addStyle("https://snazzymaps.com/style/132/light-gray", "Grayscale");

Map.addLayer(gisd30,{min:1,max:8,palette:palette},'GISD 30')


var gisd30 = ee.Image("projects/sat-io/open-datasets/GISD30_1985_2020");
//zoom to an urban center
Map.setCenter(31.16387, 30.97292,8)

var gisd_vis = ["#808080", "#006400", "#228B22", "#32CD32", "#ADFF2F", "#FFFF00", "#FFA500", "#FF0000"];

var snazzy = require("users/aazuspan/snazzy:styles");
snazzy.addStyle("https://snazzymaps.com/style/132/light-gray", "Grayscale");

// Define a dictionary which will be used to make legend and visualize image on map
var dict = {
  "names": [
    "Before 1985",
    "1985-1990",
    "1990-1995",
    "1995-2000",
    "2000-2005",
    "2005-2010",
    "2010-2015",
    "2015-2020",
  ],
  "colors": [
    "#808080",
    "#006400",
    "#228B22",
    "#32CD32",
    "#ADFF2F",
    "#FFFF00",
    "#FFA500",
    "#FF0000"]};
  // Create a panel to hold the legend widget
  // Create a panel to hold the legend widget
// Create a panel to hold the legend widget
var legend = ui.Panel({
  style: {
    position: 'bottom-left',
    padding: '8px 15px'
  }
});

// Function to generate the legend
function addCategoricalLegend(panel, dict, title) {

  // Create and add the legend title.
  var legendTitle = ui.Label({
    value: title,
    style: {
      fontWeight: 'bold',
      fontSize: '18px',
      margin: '0 0 4px 0',
      padding: '0'
    }
  });
  panel.add(legendTitle);

  var loading = ui.Label('Loading legend...', {margin: '2px 0 4px 0'});
  panel.add(loading);

  // Creates and styles 1 row of the legend.
  var makeRow = function(color, name) {
    // Create the label that is actually the colored box.
    var colorBox = ui.Label({
      style: {
        backgroundColor: color,
        // Use padding to give the box height and width.
        padding: '8px',
        margin: '0 0 4px 0'
      }
    });

    // Create the label filled with the description text.
    var description = ui.Label({
      value: name,
      style: {margin: '0 0 4px 6px'}
    });

    return ui.Panel({
      widgets: [colorBox, description],
      layout: ui.Panel.Layout.Flow('horizontal')
    });
  };

  // Get the list of palette colors and class names from the image.
  var palette = dict['colors'];
  var names = dict['names'];
  loading.style().set('shown', false);

  for (var i = 0; i < names.length; i++) {
    panel.add(makeRow(palette[i], names[i]));
  }

  Map.add(panel);

}

addCategoricalLegend(legend, dict, 'Impervious Surface (Years)');

Map.addLayer(gisd30, {min:1,max:8,palette:gisd_vis}, 'Impervious Surface (Years)');License
This work is licensed under a Creative Commons Attribution 4.0 International License. You are free to copy and redistribute the material in any medium or format, and to transform and build upon the material for any purpose, even commercially. You must give appropriate credit, provide a link to the license, and indicate if changes were made.
Created by : Zhang, X., Liu, L., Zhao, T., Gao, Y., Chen, X., and Mi, J.
Curated in GEE by: Samapriya Roy
Keywords: Landsat, Urban, Google Earth Engine, Impervious area, Urban expansion, global dataset


 2675
2675

 被折叠的 条评论
为什么被折叠?
被折叠的 条评论
为什么被折叠?
 到【灌水乐园】发言


