


简
目录
copyProperties(source, properties, exclude)
ee.Date.fromYMD(year, month, day, timeZone)
介
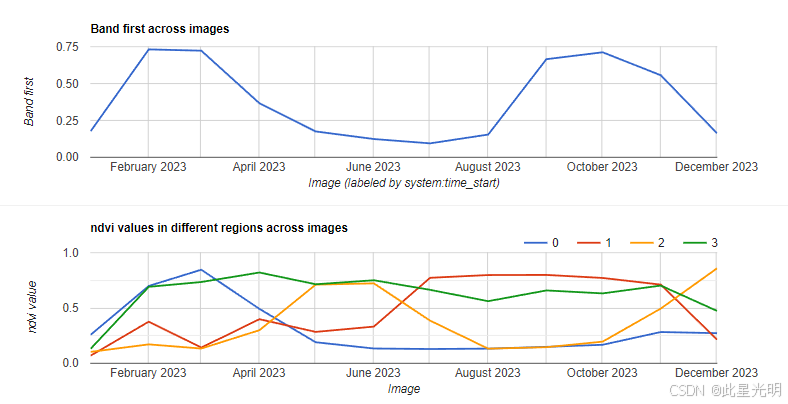
融合landsat8/9和sentinel2数据的2023年逐月NDVI指数的对比分析,这里的核心就是我们除了数据预处理后,这里需要我们进行在进行时序图表加载之前,我们需要设定指定的时间属性,特别是用function进行遍历的过程中的一些代码。
数据
Landsat 8和9是美国航天局(NASA)和美国地质调查局(USGS)合作开发的遥感卫星,用于收集全球的地表观测数据。这些卫星携带了先进的遥感仪器,可以提供高质量的影像数据,用于环境监测、土地利用规划、自然灾害监测等应用。
Landsat 8和9卫星搭载了多光谱传感器,能够捕捉可见光、红外线和热红外线波段的数据。其中,OLI(Operational Land Imager)传感器捕捉可见光和近红外波段的数据,TIRS(Thermal Infrared Sensor)传感器捕捉热红外波段的数据。这些数据可以用于研究植被健康、土地利用、水质监测等。
Sentinel-2是欧洲航天局(ESA)发射的一组遥感卫星,也用于收集地表观测数据。Sentinel-2卫星携带了多光谱传感器,能够捕捉可见光、红外线和短波红外线波段的数据。这些数据可以用于农业、森林管理、城市规划等领域。
与Landsat系列相比,Sentinel-2卫星具有更高的空间分辨率和更短的重访时间。Sentinel-2每隔5天就能够覆盖全球陆地表面,非常适合用于监测快速变化的地表特征和自然灾害。
Landsat 8和9以及Sentinel-2的数据都是免费向公众提供的,可以通过相关网站或数据平台获取和使用。这些数据对于环境保护、可持续发展和自然资源管理等方面都具有重要的应用价值。
函数
copyProperties(source, properties, exclude)
Copies metadata properties from one element to another.
Arguments:
this:destination (Element, default: null):
The object whose properties to override.
source (Element, default: null):
The object from which to copy the properties.
properties (List, default: null):
The properties to copy. If omitted, all ordinary (i.e. non-system) properties are copied.
exclude (List, default: null):
The list of properties to exclude when copying all properties. Must not be specified if properties is.
Returns: Element
ee.Date.fromYMD(year, month, day, timeZone)
Returns a Date given year, month, day.
Arguments:
year (Integer):
The year, 2013, for example.
month (Integer):
The month, 3, for example.
day (Integer):
The day, 15, for example.
timeZone (String, default: null):
The time zone (e.g., 'America/Los_Angeles'); defaults to UTC.
Returns: Date
代码
//加载研究区
var cor = [
  [48.09532576624447,31.98308763719514],
  [48.744892416635096,31.98308763719514],
  [48.744892416635096,32.40378543571943],
  [48.09532576624447,32.40378543571943],
  [48.09532576624447,31.98308763719514]
  ]

var geometry = ee.Geometry.Polygon(cor)


Map.centerObject(geometry);


var cor2 = [48.407577810922206,32.21343415732832]

var geometry2 = ee.Geometry.Point(cor2)


var cor3 = [
  [48.505939779916346,32.19193653242509],
  [48.63399916712338,32.1285761021755],
  [48.463024435678065,32.163749487730556],
  [48.30874230387218,32.318129872134236]
  ]

//转化为点
var point3 = cor3.map(function(coor){
  return ee.Feature(ee.Geometry.Point(coor))
  })

var geometry3 = ee.FeatureCollection(point3)


//设定起止时间
var time_start = '2023', time_end = '2024'

//加载landsat8 数据预处理
var landsat8 = ee.ImageCollection("LANDSAT/LC08/C02/T1_L2")
.filterDate(time_start, time_end)
.filterBounds(geometry)
.map(function(img){
  var ms = img.select('SR.*')
  var gain = ee.Number(img.get('REFLECTANCE_MULT_BAND_3'))
  var offset = ee.Number(img.get('REFLECTANCE_ADD_BAND_2'))
  var sr = ms.multiply(gain).add(offset)
  var ndvi = sr.normalizedDifference(['SR_B5','SR_B4']).rename('ndvi')
  return ndvi
  .copyProperties(img, ['system:time_start', 'system:time_end','system:index'])
  })

//加载landsat9 数据预处理
var landsat9 = ee.ImageCollection("LANDSAT/LC09/C02/T1_L2")
.filterDate(time_start, time_end)
.filterBounds(geometry)
.map(function(img){
  var ms = img.select('SR.*')
  var gain = ee.Number(img.get('REFLECTANCE_MULT_BAND_3'))
  var offset = ee.Number(img.get('REFLECTANCE_ADD_BAND_2'))
  var sr = ms.multiply(gain).add(offset)
  var ndvi = sr.normalizedDifference(['SR_B5','SR_B4']).rename('ndvi')
  return ndvi
  .copyProperties(img, ['system:time_start', 'system:time_end','system:index'])
  })

//加载sentinel-2 数据预处理
var sen2 = ee.ImageCollection("COPERNICUS/S2_SR_HARMONIZED")
.filterDate(time_start, time_end)
.filterBounds(geometry)
.map(function(img){
  var ms = img.select('B.*').multiply(0.0001);
  var ndvi = ms.normalizedDifference(['B8','B4']).rename('ndvi')
  return ndvi
  .copyProperties(img, ['system:time_start', 'system:time_end','system:index'])
  })

// 数据融合后的NDVI
var ndvi_collection = landsat8.merge(landsat9).merge(sen2)
.sort('system:time_start')
//逐月列表
var month_list = ee.List.sequence(1, 12);

//设定逐月的NDVI,这里我们需要设定一些属性和格式,方便图表的加载
var monthly_ndvi = ee.ImageCollection(month_list.map(function(month){
  var month_img = ndvi_collection.filter(ee.Filter.calendarRange(month, month, 'month')).median()
  var date = ee.Date.fromYMD(2023, month, 1)
  return month_img
  .set('system:time_start', date.millis())
  .set('system:index', date.format('YYYY-MM'))
  }));

Map.addLayer(monthly_ndvi.toBands().clip(geometry),[],'ndvi',false)

var chart1 = ui.Chart.image.series(monthly_ndvi, geometry2, ee.Reducer.first(), 30, 'system:time_start')

print(chart1)

var chart2 = ui.Chart.image.seriesByRegion(monthly_ndvi,
geometry3, ee.Reducer.first(), 'ndvi', 30, 'system:time_start', 'system:index')


print(chart2)
结果


 2085
2085

 被折叠的 条评论
为什么被折叠?
被折叠的 条评论
为什么被折叠?
 到【灌水乐园】发言


