


CARVE: L2 Atmospheric CO2, CO and CH4 Concentrations, NOAA CRDS, Alaska, 2012-2015
简介
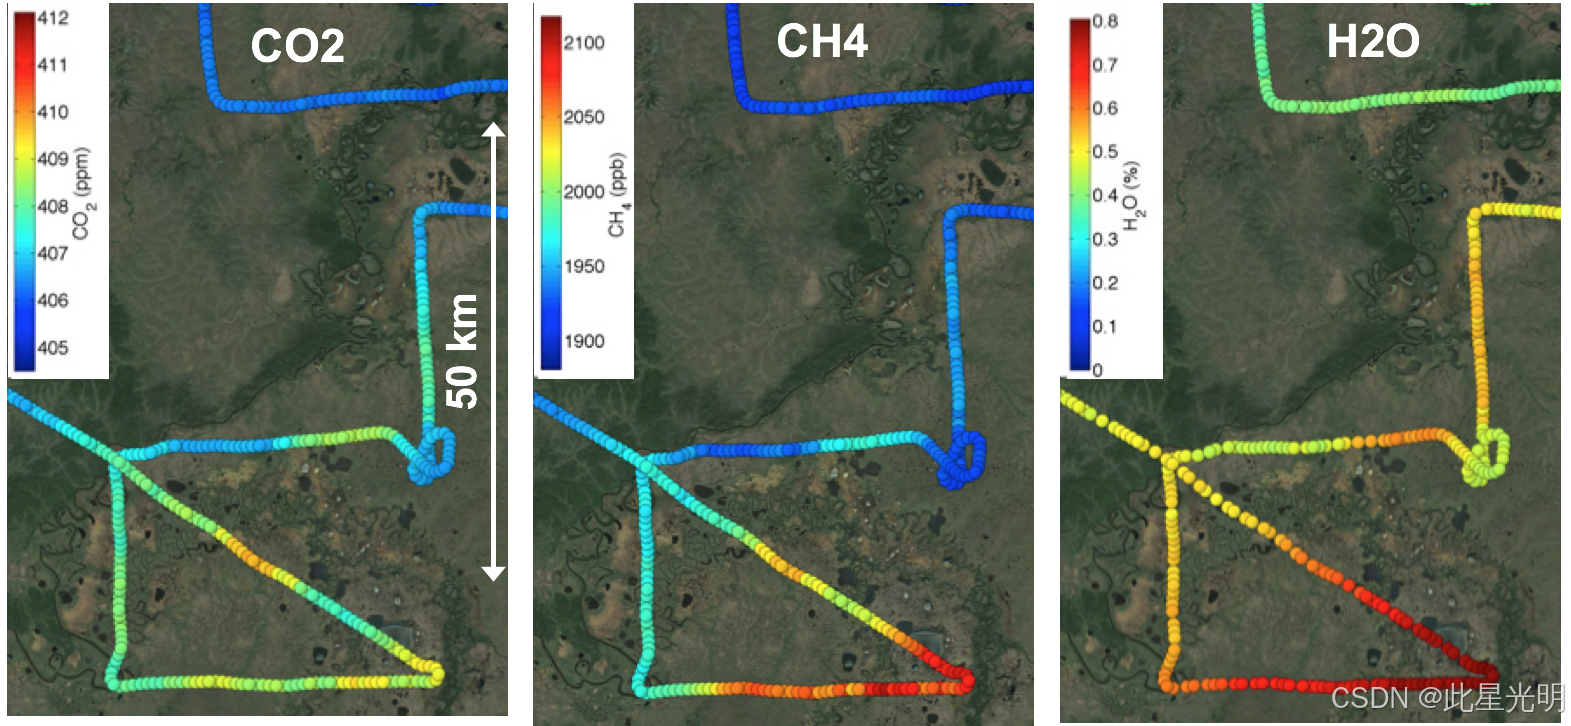
该数据集提供了为北极碳库脆弱性实验 (CARVE) 在阿拉斯加和加拿大北极地区进行的空中观测活动所收集的大气二氧化碳 (CO2)、甲烷 (CH4)、一氧化碳 (CO) 和水蒸气 (H2O) 浓度数据。数据是使用腔衰荡光谱仪 (CRDS;Picarro Inc.) 现场收集的,并在每次飞行中以 2 秒的间隔呈现。同时还提供了飞机的纬度、经度和高度。飞行活动于 2012 年至 2015 年的 3 月至 11 月期间进行,以便调查大气气体含量的季节和年际变化。该数据集中包含的测量值对于了解北极碳循环的变化以及北极永久冻土融化带来的潜在威胁至关重要。
摘要
Table 1. CARVE file naming convention. Example file name: carve_AtmosISGA_L2_N_b23_20120524_20150713021204.nc
| Name element | Example value | Units |
| Project name | carve | |
| Instrument | AtmosISGA | |
| Processing level | L2 | |
| Investigator group | N | NOAA ESRL group |
| Build ID | b23 | |
| Flight date | 20120524 | yyyymmdd |
| Processing date and time | 20150713021204 | yyyymmddhhmmss |
Data variables
Each file contains 8 geolocation variables and 8 science measurement variables described in Table 2.
Table 2. Data variables in each netCDF file. Fill value or missing data were set to -999.9 for all variables.
| Variable name | Description | Units |
| Geolocation measurements | ||
| center_lat | latitude | degrees North |
| center_lat_standard_error | latitude standard_error | degrees North |
| center_lon | longitude | degrees east |
| center_lon_standard_error | longitude standard error | degrees east |
| height | height of aircraft above ground | meters |
| height_standard_error | height standard error | meters |
| geolocation_qc | geolocation status flag | 0 = Success, 1 = Error |
| time | time | seconds since 1980-1-6 0:0:0 |
| Science measurements | ||
| co | Carbon monoxide dry mole fraction measurements at 2-second intervals | parts per billion (1x10^-9) |
| co_qc | QC flag for carbon monoxide measurements | see Table 3 |
| co2 | Carbon dioxide dry mole fraction measurements at 2-second intervals | parts per million (1x10^-6) |
| co2_qc | QC flag for carbon dioxide measurements | see Table 3 |
| ch4 | Methane dry mole fraction measurements at 2-second intervals | parts per billion (1x10^-9) |
| ch4_qc | QC flag for methane measurements | see Table 3 |
| h2o | Water vapor concentration at 2-second intervals | percent (1x10^-2) |
| h2o_qc | QC flag for water vapor measurements | see Table 3 |
Table 3. QC flag value descriptions
| QC Flag | Flag Meaning | Description |
| 0 | Valid | |
| 1 | OutOfRange | CO, CO2, or CH4 mole fractions are above or below the laboratory standards used to calibrate the instrument. If water vapor H20 > 3%, all three gases received a 1 flag. Laboratory standards for each year are listed in Table 4. |
| 2 | CavityAnomaly | Substantial variation in cavity pressure and/or temperature during course of observation |
| 3 | SuspectedLeak | Variation in cavity pressure is beyond 139.5-140.5 torr or the cavity temperature is beyond 44.98-45.02 C |
代码
!pip install leafmap
!pip install pandas
!pip install folium
!pip install matplotlib
!pip install mapclassify

import pandas as pd
import leafmap

url = "https://github.com/opengeos/NASA-Earth-Data"
df = pd.read_csv(url, sep="\t")
df

leafmap.nasa_data_login()


results, gdf = leafmap.nasa_data_search(
    short_name="CARVE_L2_AtmosGas_NOAA_1401",
    cloud_hosted=True,
    bounding_box=(-168.11, 60.21, -131.76, 71.56),
    temporal=("2012-05-23", "2014-11-09"),
    count=-1,  # use -1 to return all datasets
    return_gdf=True,
)


gdf.explore()

#leafmap.nasa_data_download(results[:5], out_dir="data")
引用
CO2, CH4, and CO measurements are reported on their respective World Meteorological Organization (WMO) standard scales:
- NOAA 2007 CO2 standard scale (see Zhao and Tans, 2006)
- NOAA 2004 CH4 standard scale (see Dlugokencky et al., 2005)
- NOAA 2004 CO standard scale (see Novelli et al., 1991)
H2O measurements used the manufacturer’s calibration.
网址推荐
知识星球
知识星球 | 深度连接铁杆粉丝,运营高品质社群,知识变现的工具 (zsxq.com)![]() https://wx.zsxq.com/group/48888525452428
https://wx.zsxq.com/group/48888525452428


 被折叠的 条评论
为什么被折叠?
被折叠的 条评论
为什么被折叠?
 到【灌水乐园】发言


