


之前已经讲过基于monocle2的拟时序分析,感兴趣的小伙伴可以看一下。
今天微信群里有人问了这样一个问题:这个图上面的山脊图如何画?
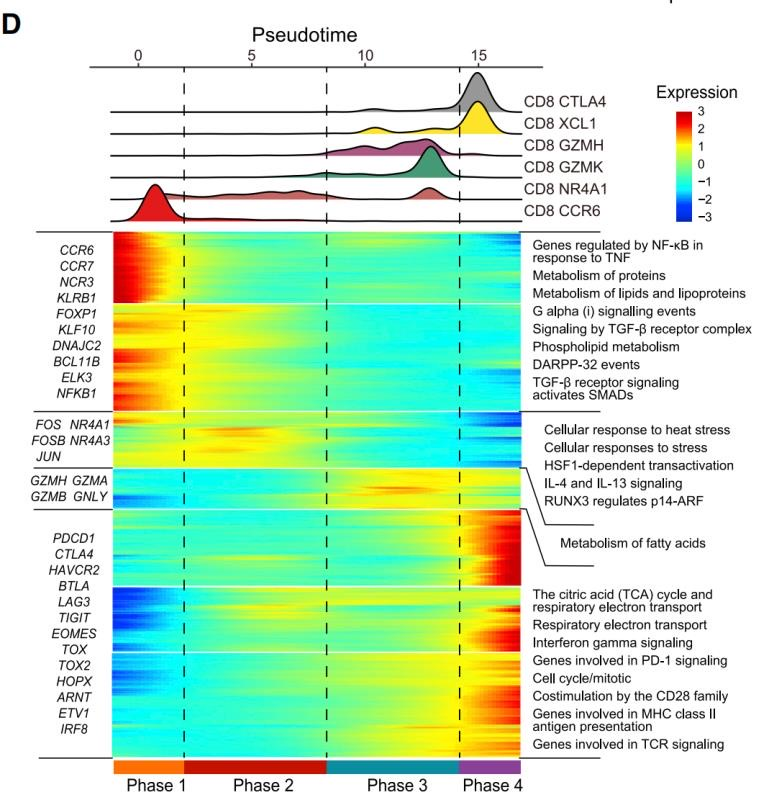
这里我给出几种简单的实现方法。还是后台回复20210812获取测试数据和代码。
library(monocle)
library(tidyverse)
library(ggridges)
library(RColorBrewer)
library(scales)

test=readRDS("test_monocle.rds")
plotdf=pData(test)

ggplot(plotdf, aes(x=Pseudotime,y=celltype,fill=celltype))+
  geom_density_ridges(scale=1) +
  geom_vline(xintercept = c(5,10),linetype=2)+
  scale_y_discrete("")+
  theme_minimal()+
  theme(
    panel.grid = element_blank()
  )
ggsave("tmp1.pdf",width = 13,height = 7,units = "cm")
ggplot(plotdf, aes(x=Pseudotime,y=celltype,fill = stat(x))) +
  geom_density_ridges_gradient(scale=1) +
  geom_vline(xintercept = c(5,10),linetype=2)+
  scale_fill_gradientn(name="Pseudotime",colors = colorRampPalette(rev(brewer.pal(10, "Spectral")))(99))+
  scale_y_discrete("")+
  theme_minimal()+
  theme(
    panel.grid = element_blank()
  )
ggsave("tmp2.pdf",width = 13,height = 7,units = "cm")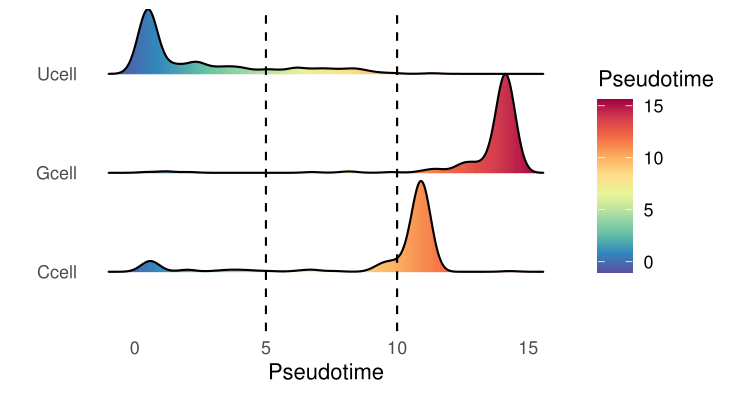
类似的问题还有:如何提取坐标?
plotdf2=as.data.frame(t(test@reducedDimS))
colnames(plotdf2)=c("component1","component2")
plotdf2$Pseudotime=test$Pseudotime

plotdf2%>%ggplot(aes(component1,component2,color=Pseudotime))+
  geom_point()+
  theme_minimal()
ggsave("tmp3.pdf",width = 13,height = 10,units = "cm")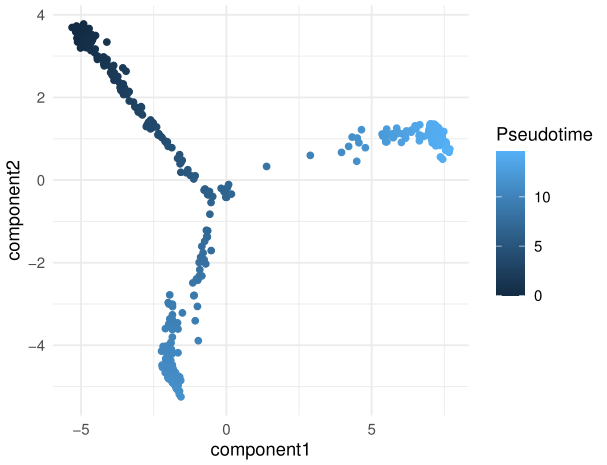
因水平有限,有错误的地方,欢迎批评指正!


 458
458


 被折叠的 条评论
为什么被折叠?
被折叠的 条评论
为什么被折叠?
 到【灌水乐园】发言


