


理论部分见 算法笔记:ARIMA_UQI-LIUWJ的博客-CSDN博客 3.1 & 3.2
1 绘制自相关函数ACF
from statsmodels.graphics.tsaplots import plot_acf
plot_acf(df['Temp'])
plt.show()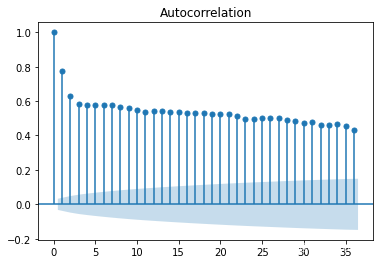
2 绘制偏自相关函数PACF
from statsmodels.graphics.tsaplots import plot_pacf
plot_pacf(df['Temp'])
plt.show()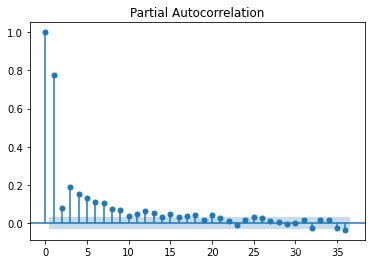
理论部分见 算法笔记:ARIMA_UQI-LIUWJ的博客-CSDN博客 3.1 & 3.2
from statsmodels.graphics.tsaplots import plot_acf
plot_acf(df['Temp'])
plt.show()
from statsmodels.graphics.tsaplots import plot_pacf
plot_pacf(df['Temp'])
plt.show()
 3063
2058
1247
3063
2058
1247

 被折叠的 条评论
为什么被折叠?
被折叠的 条评论
为什么被折叠?
 到【灌水乐园】发言


