


基因组生信分析教程
DNA 1. Germline Mutation Vs. Somatic Mutation 傻傻分不清楚
DNA 2. SCI 文章中基因组变异分析神器之 maftools
DNA 3. SCI 文章中基因组变异分析神器之 maftools
DNA 4. SCI 文章中基因组的突变信号(maftools)
DNA 6. 基因组变异之绘制精美瀑布图(ComplexHeatmap)
DNA 7. 基因组拷贝数变异分析及可视化 (GISTIC2.0)
DNA 8. 癌症的突变异质性及寻找新的癌症驱动基因(MutSigCV)
DNA 10. 识别癌症驱动基因 (OncodriveCLUST)
DNA 11. 识别肿瘤蛋白质三维结构上突变热点(HotSpot3D)
DNA 12. SCI 文章绘图之全基因组关联分析可视化(GWAS)
DNA 14. SCI 文章肿瘤微卫星不稳定性计算方法(MSI)
今天介绍肿瘤微卫星不稳定性的计算软件(MSIsensor系列),涉及到4款软件,也是一种迭代升级,针对配对实体瘤,无对照的实体瘤,以及cfDNA的MSI score 检测,下面就给大家介绍一下。
1. MSIsensor
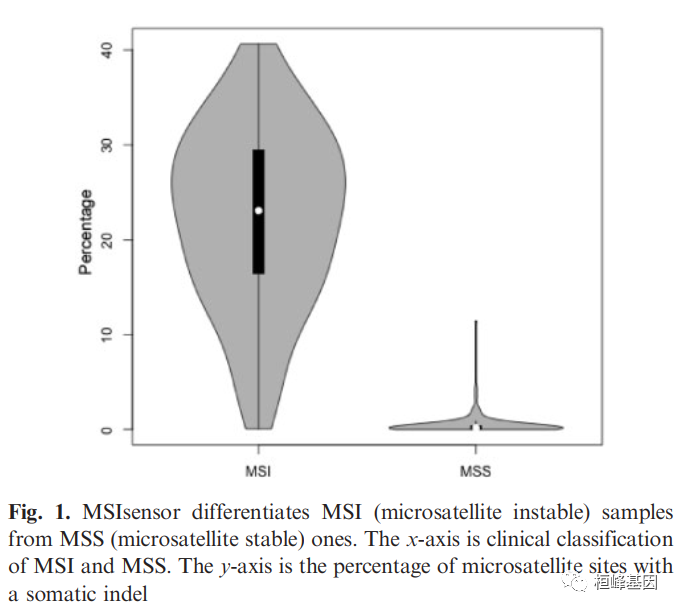
微卫星不稳定性(MSI)是大基因组不稳定性的重要指标,与包括林奇综合征在内的许多遗传疾病有关。MSI状态也是多种癌症类型(如结直肠癌和子宫内膜癌)良好生存的独立预后因素,还提示化疗药物的选择。然而,目前基于pcr -电泳的检测过程既费力又耗时,通常需要目测来对样品进行分类。开发了MSIsensor,一个c++程序,用于自动检测体细胞微卫星的变化。计算配对肿瘤和正常序列数据中每个位点微卫星的长度分布,随后使用这些数据对两个样本中观察到的分布进行统计比较。综合测试表明,MSIsensor是一种从标准肿瘤-正常配对序列数据中获得MSI状态的有效工具。
使用说明:
Install
You may already have these prerequisite packages. If not, and you're on Debian or Ubuntu:
sudo apt-get install zlib1g-dev libncurses5-dev libncursesw5-devIf you are using Fedora, CentOS or RHEL, you'll need these packages instead:
sudo yum install zlib-devel ncurses-devel ncursesUsing Pre-built
For Linux and OSX binaries, look for
msisensor.linuxand/ormsisensor.macosin attachments to each release
Using bioconda
conda install msisensorBuild from source code
Clone the msisensor master branch, and build the msisensor binary:
git clone https://github.com/ding-lab/msisensor.git
cd msisensor
make
Now you can put the resulting binary where your $PATH can find it. If you have su permissions, then we recommend dumping it in the system directory for locally compiled packages:
sudo mv msisensor /usr/local/bin/Usage
Version 0.6
    Usage:  msisensor <command> [options]
Key commands:
scan            scan homopolymers and miscrosatelites
    msi             msi scoring
msisensor scan [options]:
-d   <string>   reference genome sequences file, *.fasta format
   -o   <string>   output homopolymer and microsatelittes file

   -l   <int>      minimal homopolymer size, default=5
   -c   <int>      context length, default=5
   -m   <int>      maximal homopolymer size, default=50
   -s   <int>      maximal length of microsate, default=5
   -r   <int>      minimal repeat times of microsate, default=3
   -p   <int>      output homopolymer only, 0: no; 1: yes, default=0

   -h   help
msisensor msi [options]:
-d   <string>   homopolymer and microsates file
   -n   <string>   normal bam file
   -t   <string>   tumor  bam file
   -o   <string>   output distribution file

   -e   <string>   bed file, optional
   -f   <double>   FDR threshold for somatic sites detection, default=0.05
   -c   <int>      coverage threshold for msi analysis, WXS: 20; WGS: 15, default=20
   -z   <int>      coverage normalization for paired tumor and normal data, 0: no; 1: yes, default=0
   -r   <string>   choose one region, format: 1:10000000-20000000
   -l   <int>      minimal homopolymer size, default=5
   -p   <int>      minimal homopolymer size for distribution analysis, default=10
   -m   <int>      maximal homopolymer size for distribution analysis, default=50
   -q   <int>      minimal microsates size, default=3
   -s   <int>      minimal microsates size for distribution analysis, default=5
   -w   <int>      maximal microstaes size for distribution analysis, default=40
   -u   <int>      span size around window for extracting reads, default=500
   -b   <int>      threads number for parallel computing, default=1
   -x   <int>      output homopolymer only, 0: no; 1: yes, default=0
   -y   <int>      output microsatellite only, 0: no; 1: yes, default=0

   -h   help
Example
Scan microsatellites from reference genome:
msisensor scan -d reference.fa -o microsatellites.listMSI scoring:
msisensor msi -d microsatellites.list -n normal.bam -t tumor.bam -e bed.file -o output.prefixNote: normal and tumor bam index files are needed in the same directory as bam files
Output
The list of microsatellites is output in "scan" step. The MSI scoring step produces 4 files:
output.prefix
    output.prefix_dis_tab
    output.prefix_germline
    output.prefix_somatic
microsatellites.list: microsatellite list output ( columns with *_binary means: binary conversion of DNA bases based on A=00, C=01, G=10, and T=11 )
chromosome      location        repeat_unit_length     repeat_unit_binary    repeat_times    left_flank_binary     right_flank_binary      repeat_unit_bases      left_flank_bases       right_flank_bases
 1       10485   4       149     3       150     685     GCCC    AGCCG   GGGTC
 1       10629   2       9       3       258     409     GC      CAAAG   CGCGC
 1       10652   2       2       3       665     614     AG      GGCGC   GCGCG
 1       10658   2       9       3       546     409     GC      GAGAG   CGCGC
 1       10681   2       2       3       665     614     AG      GGCGC   GCGCG
output.prefix: msi score output
Total_Number_of_Sites   Number_of_Somatic_Sites %
 640     75      11.72
output.prefix_dis_tab: read count distribution (N: normal; T: tumor)
1       16248728        ACCTC   11      T       AAAGG   N       0       0       0       0       1       38      0       0       0       0       0       0       0
 1       16248728        ACCTC   11      T       AAAGG   T       0       0       0       0       17      22      1       0       0       0       0       0       0
output.prefix_somatic: somatic sites detected ( FDR: false discovery rate )
chromosome   location        left_flank     repeat_times    repeat_unit_bases    right_flank      difference      P_value    FDR     rank
 1       16200729        TAAGA   10      T       CTTGT   0.55652 2.8973e-15      1.8542e-12      1
 1       75614380        TTTAC   14      T       AAGGT   0.82764 5.1515e-15      1.6485e-12      2
 1       70654981        CCAGG   21      A       GATGA   0.80556 1e-14   2.1333e-12      3
 1       65138787        GTTTG   13      A       CAGCT   0.8653  1e-14   1.6e-12 4
 1       35885046        TTCTC   11      T       CCCCT   0.84682 1e-14   1.28e-12        5
 1       75172756        GTGGT   14      A       GAAAA   0.57471 1e-14   1.0667e-12      6
 1       76257074        TGGAA   14      T       GAGTC   0.66023 1e-14   9.1429e-13      7
 1       33087567        TAGAG   16      A       GGAAA   0.53141 1e-14   8e-13   8
 1       41456808        CTAAC   14      T       CTTTT   0.76286 1e-14   7.1111e-13      9
output.prefix_germline: germline sites detected
chromosome   location        left_flank     repeat_times    repeat_unit_bases    right_flank      genotype
 1       1192105 AATAC   11      A       TTAGC   5|5
 1       1330899 CTGCC   5       AG      CACAG   5|5
 1       1598690 AATAC   12      A       TTAGC   5|5
 1       1605407 AAAAG   14      A       GAAAA   1|1
 1       2118724 TTTTC   11      T       CTTTT   1|1
Test sample
We provided one small dataset (tumor and matched normal bam files) to test the msi scoring step:
cd ./test
    bash run.sh
We also provided a R script to visualize MSI score distribution of MSIsensor output. ( msi score list only or msi score list accompanied with known msi status). For msi score list only as input:
R CMD BATCH "--args msi_score_only_list msi_score_only_distribution.pdf" plot.rFor msi score list accompanied with known msi status as input:
R CMD BATCH "--args msi_score_and_status_list msi_score_and_status_distribution.pdf" plot.r2. MSIsensor2
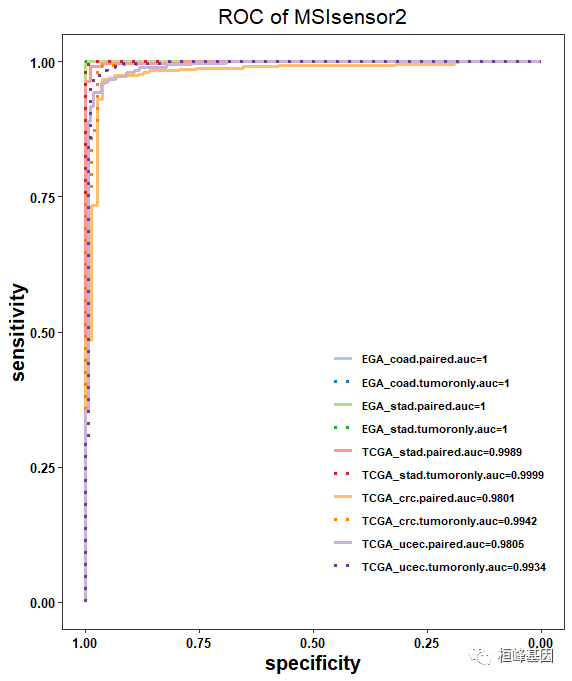
MSIsensor2专门对单样本进行微卫星检测。而且,MSIsensor2 号称同时适用于cfDNA样本和FFPE样本。输入文件需要准备 比对后的 BAM 文件即可。
使用说明:
MSIsensor2 下载和安装:
git clone https://github.com/niu-lab/msisensor2.git
cd msisensor2
chmod +x msisensor2
MSIsensor2使用:
Version 0.1
Usage:  msisensor2 <command> [options]
msisensor2 msi [options]:-M <string> models directory for tumor only data
-t <string> tumor bam file
-o <string> output distribution file
-c <int> coverage threshold for msi analysis, WXS: 20; WGS: 15, default=20
-b <int> threads number for parallel computing, default=1
-x <int> output homopolymer only, 0: no; 1: yes, default=0
-y <int> output microsatellite only, 0: no; 1: yes, default=0
-h helpExample
计算MSI scoring: 只有一个肿瘤的bam数据,参考基因组为hg38。
注意:bam索引文件需要与bam文件在同一个目录中
msisensor2 msi -M ./models_hg38 -t ./test/example.tumor.only.hg38.bam -o output.tumor.prefixhg19 or GRCh37 bam:
msisensor2 msi -M ./models_hg19_GRCh37 -t ./test/example.tumor.only.hg19.bam -o output.tumor.prefixb37 or humanG1Kv37 bam:
msisensor2 msi -M ./models_b37_HumanG1Kv37 -t ./test/example.tumor.only.b37.bam -o output.tumor.prefixOutput
for tumor only input, the MSI scoreing step produces 3 files:
output.tumor.prefix
output.tumor.prefix_dis
output.tumor.prefix_somaticoutput.prefix: msi score
Total_Number_of_Sites Number_of_Somatic_Sites %
2 1 50.002. output.prefix_dis: read count distribution (T: tumor)
chr22 29286892 AAAGC 12[T] CTCTT
T: 0 0 0 0 0 0 0 0 25 71 4 86 3 0 0 0 0 0 0 0 0 0 0 0 0 0 0 0 0 0 0 0 0 0 0 0 0 0 0 0 0 0 0 0 0 0 0 0 0 0 0 0 0 0 0 0 0 0 0 0 0 0 0 0 0 0 0 0 0 0 0 0 0 0 0 0 0 0 0 0 0 0 0 0 0 0 0 0 0 0 0 0 0 0 0 0 0 0 0 03. output.prefix_somatic: somatic sites detected
chromosome location left_flank repeat_times repeat_unit_bases right_flank discrimination_value_ML
chr22 29286892 AAAGC 12 T CTCTT 0.98852我们提供了一个小数据集(只有肿瘤的bam文件)来测试msi评分步骤:
msisensor2 msi -M ./models_hg38 -t ./test/example.tumor.only.hg38.bam -o output.tumor.prefix
msisensor2 msi -M ./models_hg19 -t ./test/example.tumor.only.hg19.bam -o output.tumor.prefix我们还提供了一个R脚本来可视化MSIsensor2输出的MSI分数分布。(只有msi分数列表或msi分数列表附带已知的msi状态)。对于msi分数列表仅作为输入:
R CMD BATCH "--args msi_score_only_list msi_score_only_distribution.pdf" plot.r对于msi分数列表,并将已知的msi状态作为输入:
R CMD BATCH "--args msi_score_and_status_list msi_score_and_status_distribution.pdf" plot.r3. MSIsensor-ct
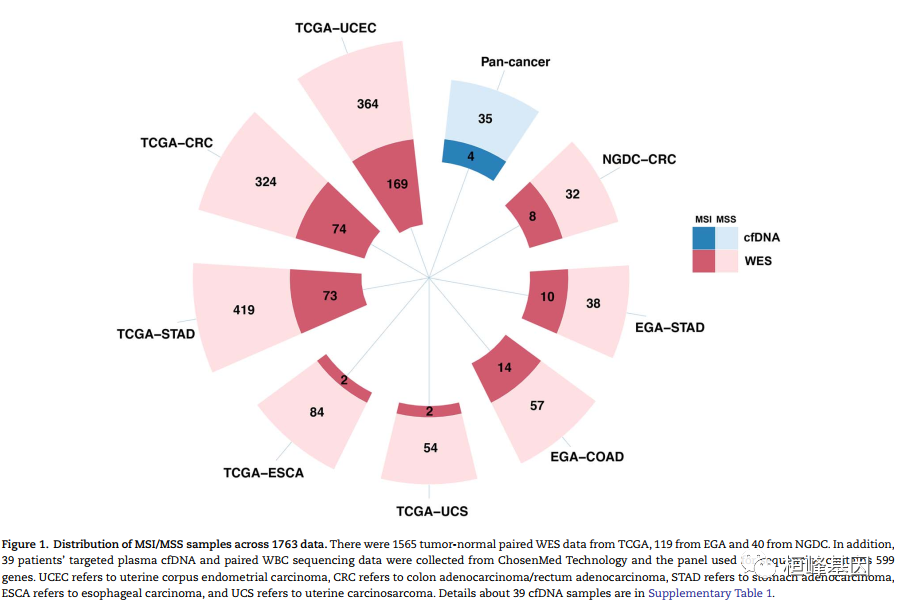
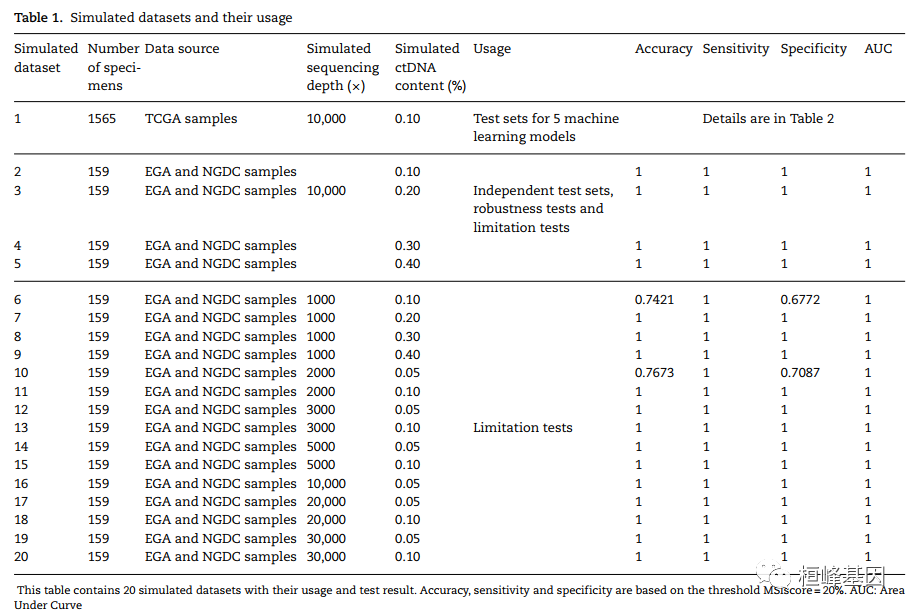
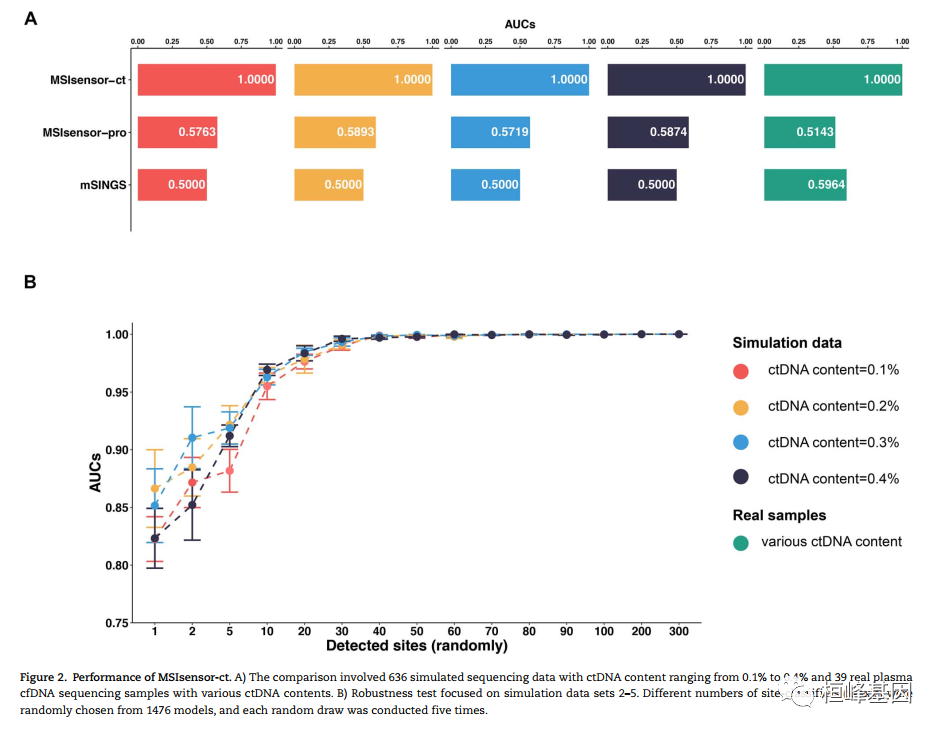
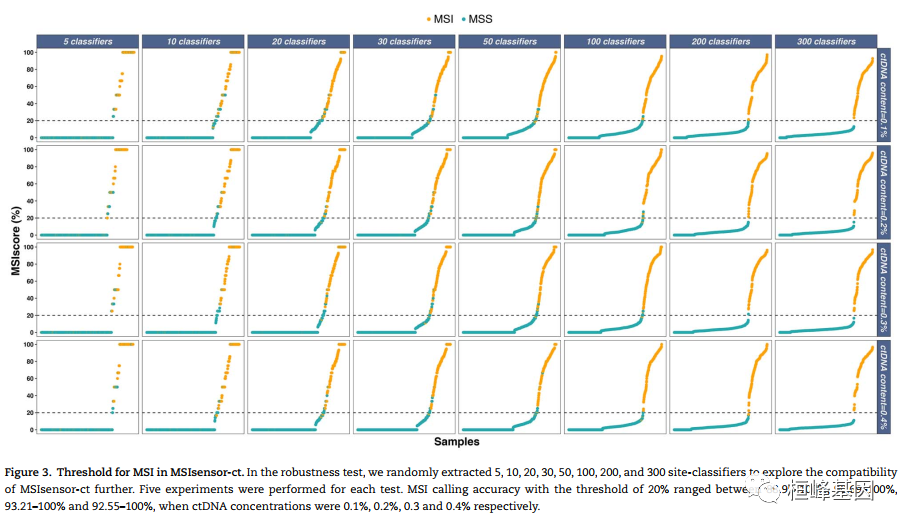
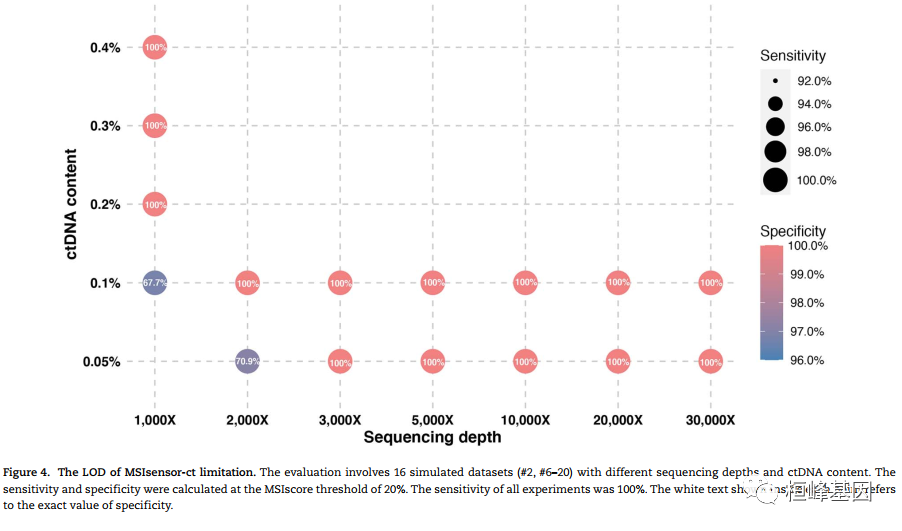
微卫星不稳定性(MSI)是一种很有前途的癌症预后和化学敏感性的生物标志物。从肿瘤-正常配对或仅肿瘤测序数据检测MSI的技术正在迅速发展。然而,肿瘤组织往往是不足的,不可用的,或以其他方式难以获得。越来越多的临床证据表明,血浆循环细胞游离DNA (cfNDA)技术作为一种无创MSI检测方法的巨大潜力。结果:我们开发了基于机器学习协议的生物信息学工具MSIsensor-ct,致力于使用cfDNA测序数据检测MSI状态,潜在稳定的MSI评分阈值为20%。MSIsensor-ct在不同水平的循环肿瘤DNA (ctDNA)和测序深度的独立检测数据集上的评估显示,在0.05% ctDNA含量的检测限(LOD)内,准确率为100%。MSIsensor-ct只需要BAM文件作为输入,使其用户友好,易于集成到下一代测序(NGS)分析管道。https://github.com/niu-lab/MSIsensor-ct 免费获得
使用说明:
Install
Currently, MSIsensor-ct is based on Linux system, and we provide binaries only. Please note your GCC version should be at least 5.0.x.
git clone https://github.com/niu-lab/msisensor-ct.git
cd msisensor-ct
chmod +x msisensor-ctUsage
Version 0.1
Usage: msisensor-ct <command> [options]Key commands:
msi msi scoringmsisensor-ct msi [options]:
-D <boolean> activate processing for ctDNA samples
-M   <string>   models directory for tumor only data
   -t   <string>   tumor  bam file
   -o   <string>   output distribution file

   -c   <int>      coverage threshold for msi analysis, WXS: 20; WGS: 15, default=20
   -b   <int>      threads number for parallel computing, default=1
   -x   <int>      output homopolymer only, 0: no; 1: yes, default=0
   -y   <int>      output microsatellite only, 0: no; 1: yes, default=0

   -h   help
Example
MSI scoring:
hg38 bam:
msisensor-ct msi -D -M ./models_hg38 -t ./test/example.cfdna.hg38.bam -o output.prefixhg19 or GRCh37 bam:
msisensor-ct msi -D -M ./models_hg19_GRCh37 -t ./test/example.cfdna.hg19.bam -o output.prefixb37 or HumanG1Kv37 bam:
msisensor-ct msi -D -M ./models_b37_HumanG1Kv37 -t ./test/example.cfdna.b37.bam -o output.prefixNote: bam index files are needed in the same directory as bam files
Output
The MSI scoring step produces 3 files:
output.prefix
output.prefix_dis
output.prefix_somaticoutput.prefix: msi score output
Total_Number_of_Sites Number_of_Somatic_Sites % 2 2 100.00output.prefix_dis: read count distribution (T: tumor)
chr22 29286892 AAAGC 12[T] CTCTT T: 0 0 0 0 0 0 0 0 25 71 4 86 3 0 0 0 0 0 0 0 0 0 0 0 0 0 0 0 0 0 0 0 0 0 0 0 0 0 0 0 0 0 0 0 0 0 0 0 0 0 0 0 0 0 0 0 0 0 0 0 0 0 0 0 0 0 0 0 0 0 0 0 0 0 0 0 0 0 0 0 0 0 0 0 0 0 0 0 0 0 0 0 0 0 0 0 0 0 0 0output.prefix_somatic: somatic sites detected
chromosome   location        left_flank     repeat_times    repeat_unit_bases    right_flank    discrimination_value_ML


 chr22  29286892  AAAGC  12  T  CTCTT  0.98852
Test sample
We provided one small dataset to test the msi scoring step:
msisensor-ct msi -D -M ./models_hg38 -t ./test/example.cfdna.hg38.bam -o output.prefix
    msisensor-ct msi -D -M ./models_hg19_GRCh37 -t ./test/example.cfdna.hg19.bam -o output.prefix
    msisensor-ct msi -D -M ./models_b37_HumanG1Kv37 -t ./test/example.cfdna.b37.bam -o output.prefix
We also provided a R script to visualize MSI score distribution of MSIsensor-ct output. ( msi score list only or msi score list accompanied with known msi status).
For msi score list only as input:
R CMD BATCH "--args msi_score_only_list msi_score_only_distribution.pdf" plot.rFor msi score list accompanied with known msi status as input:
R CMD BATCH "--args msi_score_and_status_list msi_score_and_status_distribution.pdf" plot.r4. MSIsensor-pro
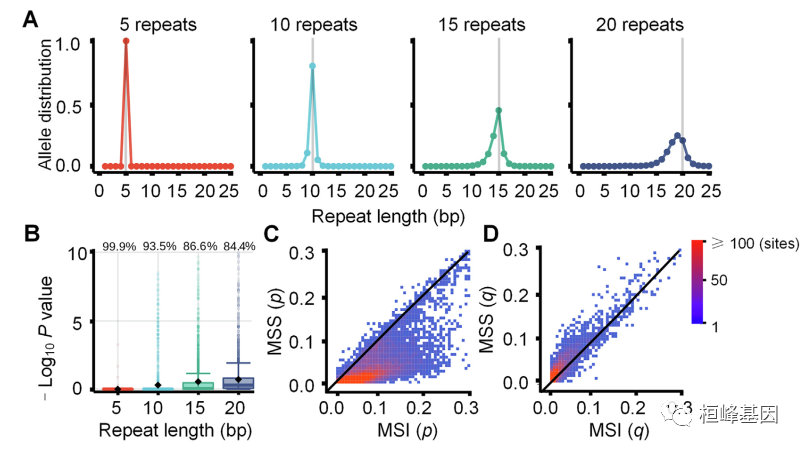
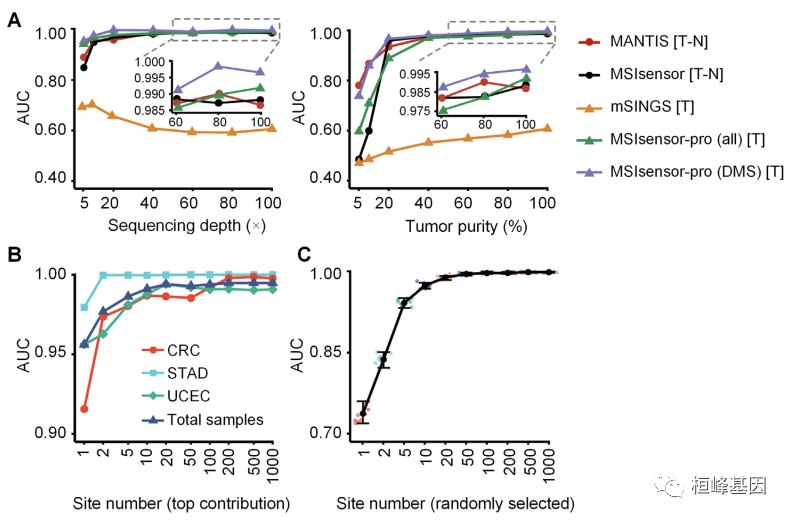
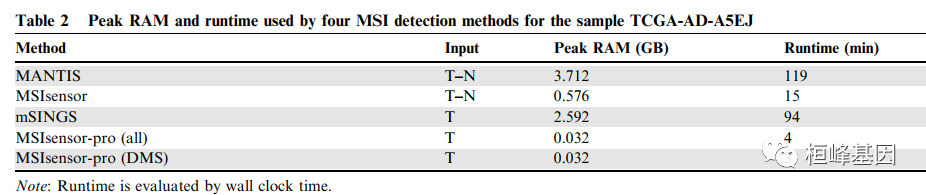
微卫星不稳定性(MSI)是癌症治疗和预后的重要生物标志物。传统的实验分析既费力又耗时,而下一代基于测序的计算方法不适用于白血病样本、石蜡包埋样本或其他疾病患者来源的异种移植物/类器官,因为需要匹配的正常样本。在此,
开发了 MSIsensor-pro,这是一个开源的单样本MSI评分方法临床应用。MSIsensor-pro 引入了一个多项分布模型来量化每个肿瘤样本的聚合酶滑移,并引入了一种判别位点选择方法来实现MSI未匹配正常样品的检测。我们证明了mssensor -pro是一个超快的,准确、鲁棒的MSI调用方法。使用不同测序深度和肿瘤的样本在纯度方面,mssensor -pro在准确度方面均显著优于目前领先的方法计算成本。MSIsensor-pro可在https://github.com/xjtu-omics/msisensor-pro上获得。
使用说明:
Install
Directly using binary version
wget https://github.com/xjtu-omics/msisensor-pro/raw/master/binary/msisensor-pro
  chmod +x msisensor-pro
  export PATH=`pwd`:$PATH
Install Using Docker
docker pull pengjia1110/msisensor-pro
   docker run pengjia1110/msisensor-pro msisensor-pro
Install Using Bioconda
conda install msisensor-proInstall from source code
( Recommended For Developers )
Install the dependencies
Dependent packages including zlib, ncurses and nurses-dev are required for MSIsensor-pro. You may already have these prerequisite packages. If not, you need to run the following code to obtain dependent packages.
For Debian or Ubuntu:
sudo apt-get install libbz2-dev zlib1g-dev libcurl4-openssl-dev libncurses5-dev libncursesw5-devFor Fedora, CentOS or RHEL
sudo yum install bzip2-devel xz-devel zlib-devel ncurses-devel ncurses
Build MSIsensor-pro from source code
colne the repository from our github
git clone https://github.com/xjtu-omics/msisensor-promake
cd msisensor-pro/
./INSTALL
install
sudo mv msisensor-pro /usr/local/bin/
Usage:
msisensor-pro <command> [options]Key Commands:
scan
scan the reference genome to get microsatellites informationbaseline
build baseline for tumor only detectionmsi
evaluate MSI using paired tumor-normal sequencing datapro
evaluate MSI using single (tumor) sample sequencing data
See more detail in the Key Commands page and Best Practices page.
Best Practices for MSI classification using MSIsensor-pro
(a) For tumor only samples:
1. scan : scan the reference genome to get microsatellites information
msisensor-pro scan -d /path/to/reference.fa -o /path/to/reference.listThis module scans the reference genome to get microsatellites information. You need to input (-d) a reference file (*.fa or *.fasta), and you will get a microsatellites file (-o) for following analysis.
2. baseline : build baseline for tumor only detection
msisensor-pro baseline -d /path/to/reference.list -i /path/to/configure.txt -o /path/to/baseline/directoryThis module builds baseline for the input microsatellites (-d) from the scan module output or our github. You also need to offer some normal sample sequence data (-i,click here for more detail about configure file) from the sample sequencing center or platform and the output directory (-o).
3. pro : evaluate MSI using single (tumor) sample sequencing data
msisensor-pro pro -d /path/to/baseline/directory/reference_baseline.list -t /path/to/tumor/case1_sorted.bam -o /path/to/outputThis module scores the MSI using the tumor only sequence data. You need to offer the microsatellites with baseline (-d) from the baseline module, the aligned sequencing file (-t) and the output prefix (-o).
(b) For tumor-normal paired samples:
1. scan : scan the reference genome to get microsatellites information
msisensor-pro scan -d /path/to/reference.fa -o /path/to/reference.siteThis module scans the reference genome to get microsatellites information. You need to input (-d) a reference file (*.fa or *.fasta), and you will get a microsatellites file (-o) for following analysis.
2. msi : evaluate MSI using paired tumor-normal sequencing data
msisensor-pro msi -d /path/to/reference.site -n /path/to/case1_normal_sorted.bam -t /path/to/case1_tumor_sorted.References:
1. Niu B, Ye K, Zhang Q, et al. MSIsensor: microsatellite instability detection using paired tumor-normal sequence data. Bioinformatics. 2014;30(7):1015-1016. doi:10.1093/bioinformatics/btt755
2. Han X, Zhang S, Zhou DC, et al. MSIsensor-ct: microsatellite instability detection using cfDNA sequencing data. Brief Bioinform. 2021;22(5):bbaa402. doi:10.1093/bib/bbaa402
3. Jia P, Yang X, Guo L, et al. MSIsensor-pro: Fast, Accurate, and Matched-normal-sample-free Detection of Microsatellite Instability. Genomics Proteomics Bioinformatics. 2020;18(1):65-71. doi:10.1016/j.gpb.2020.02.001
MSIsensor 系列检测 MSI的软件整理完成,其实使用起来并不难,输入文件都是 比对后的 BAM 文件,需要对其进行去重和排序,例外就是需要注意MSI 检测输入的基因组序列必须跟比对时使用的基因组序列版本一致,否是就会出现不停的报错,这点需要大家注意下,其他问题不大!
桓峰基因,铸造成功的您!
未来桓峰基因公众号将不间断的推出单细胞系列生信分析教程,
敬请期待!!
桓峰基因和投必得合作,文章润色优惠85折,需要文章润色的老师可以直接到网站输入领取桓峰基因专属优惠券码:KYOHOGENE,然后上传,付款时选择桓峰基因优惠券即可享受85折优惠哦!https://www.topeditsci.com/
有想进生信交流群的老师可以扫最后一个二维码加微信,备注“单位+姓名+目的”,有些想发广告的就免打扰吧,还得费力气把你踢出去!


 904
904


 被折叠的 条评论
为什么被折叠?
被折叠的 条评论
为什么被折叠?
 到【灌水乐园】发言


