# 导入相关模块
import os
import tensorflow as tf
import math
import numpy as np
import itertools

from waymo_open_dataset.utils import range_image_utils
from waymo_open_dataset.utils import transform_utils
from waymo_open_dataset.utils import  frame_utils
from waymo_open_dataset import dataset_pb2 as open_dataset
# 读取一帧
# 数据集中的每个文件都是一系列帧,按帧的开始时间戳排列的
FILENAME = '/your/path/to/frames'
dataset = tf.data.TFRecordDataset(FILENAME, compression_type='')
for data in dataset:
    frame = open_dataset.Frame()
    frame.ParseFromString(bytearray(data.numpy()))
    break
# 从frame中parse出距离图像和摄像头投影
(range_images, camera_projections,
_, range_image_top_pose) = frame_utils.parse_range_image_and_camera_projection(frame)
print(frame.context)
# 输出如下
name: "1887497421568128425_94_000_114_000"
camera_calibrations {
  name: FRONT
  intrinsic: 2044.3189893365634  # 3x3内参矩阵展平
  intrinsic: 2044.3189893365634
  intrinsic: 966.3197697401635
  intrinsic: 624.7706323955747
  intrinsic: 0.048519645404847
  intrinsic: -0.31855151741237414
  intrinsic: -0.0005279507169045765
  intrinsic: -0.0010850539443264748
  intrinsic: 0.0
  extrinsic {  # 4x4外参矩阵展平
    transform: 0.9999646289832713
    transform: 0.008246053155616117
    transform: -0.0016563181166113767
    transform: 1.539410419713088
    transform: -0.00821545053170668
    transform: 0.9998095286456695
    transform: 0.01770346863994159
    transform: -0.02209790123934037
    transform: 0.001801986378900245
    transform: -0.01768923505070438
    transform: 0.9998419094078879
    transform: 2.1155481715436157
    transform: 0.0
    transform: 0.0
    transform: 0.0
    transform: 1.0
  }
  width: 1920
  height: 1280
  rolling_shutter_direction: RIGHT_TO_LEFT
}
......
laser_calibrations {
  name: FRONT
  beam_inclination_min: -1.5707963267948966
  beam_inclination_max: 0.5235987755982988
  extrinsic {  # 4x4外参矩阵展平
    transform: 0.9999048208492021
    transform: 0.013695249190427495
    transform: 0.0016701473399531404
    transform: 4.07
    transform: -0.013714694211443964
    transform: 0.9998309396760642
    transform: 0.012247417244672352
    transform: 0.0
    transform: -0.0015021335531979008
    transform: -0.01226915710595505
    transform: 0.9999236027710805
    transform: 0.689
    transform: 0.0
    transform: 0.0
    transform: 0.0
    transform: 1.0
  }
}
......
laser_calibrations {
  name: TOP
  beam_inclinations: -0.3109493854930212    # 64线激光束倾角
  beam_inclinations: -0.30000797541691293
  beam_inclinations: -0.28894899849179745
  beam_inclinations: -0.27914715773047827
  beam_inclinations: -0.26885488607059527
  beam_inclinations: -0.2587631844009475
  beam_inclinations: -0.2496436247739
  beam_inclinations: -0.23989098905841688
  beam_inclinations: -0.23102118903462854
  beam_inclinations: -0.22145870237981402
  beam_inclinations: -0.21238996690976286
  beam_inclinations: -0.20353703902829912
  beam_inclinations: -0.19500701059583037
  beam_inclinations: -0.18651174674860194
  beam_inclinations: -0.17878444725969622
  beam_inclinations: -0.17037497392150325
  beam_inclinations: -0.16275416990018288
  beam_inclinations: -0.15483289542313527
  beam_inclinations: -0.1478791701456641
  beam_inclinations: -0.14019162329181478
  beam_inclinations: -0.1334295535482175
  beam_inclinations: -0.12572409229511128
  beam_inclinations: -0.1191768458241973
  beam_inclinations: -0.11248261105736179
  beam_inclinations: -0.10616972942937819
  beam_inclinations: -0.09994175384109583
  beam_inclinations: -0.0942770856777746
  beam_inclinations: -0.08824504125653987
  beam_inclinations: -0.08329002824756504
  beam_inclinations: -0.07750058418225625
  beam_inclinations: -0.07261572005798489
  beam_inclinations: -0.067625528780896
  beam_inclinations: -0.06307231708736083
  beam_inclinations: -0.05810509472866876
  beam_inclinations: -0.054288110830716496
  beam_inclinations: -0.04972514815889717
  beam_inclinations: -0.04591839416273613
  beam_inclinations: -0.041593579281457904
  beam_inclinations: -0.038109181768801514
  beam_inclinations: -0.03411633830316019
  beam_inclinations: -0.031502879502198766
  beam_inclinations: -0.02779932795483009
  beam_inclinations: -0.025184279030967982
  beam_inclinations: -0.022024062904501873
  beam_inclinations: -0.019379929499173887
  beam_inclinations: -0.01602395690597569
  beam_inclinations: -0.013814845777836648
  beam_inclinations: -0.010652459373336809
  beam_inclinations: -0.007632915795832584
  beam_inclinations: -0.00444004277348653
  beam_inclinations: -0.0017582387733503513
  beam_inclinations: 0.0013751081632051854
  beam_inclinations: 0.0036498475711435052
  beam_inclinations: 0.006660825067341447
  beam_inclinations: 0.009540156078575501
  beam_inclinations: 0.012668780564021542
  beam_inclinations: 0.01550473973846933
  beam_inclinations: 0.01861105589746259
  beam_inclinations: 0.020996297564079613
  beam_inclinations: 0.023855099978695282
  beam_inclinations: 0.026797513488081792
  beam_inclinations: 0.02994290957014778
  beam_inclinations: 0.03280612751232437
  beam_inclinations: 0.0359642112806986
  beam_inclination_min: -0.31642009053107534
  beam_inclination_max: 0.037543253164885715
  extrinsic {  # 4x4外参矩阵展平
    transform: -0.857219928456495
    transform: -0.5149504002527315
    transform: -0.0002820223274792702
    transform: 1.43
    transform: 0.5149500725158579
    transform: -0.8572198126137495
    transform: 0.0007846517450211272
    transform: 0.0
    transform: -0.0006458118568723072
    transform: 0.0005273916947437333
    transform: 0.9999996523924625
    transform: 2.184
    transform: 0.0
    transform: 0.0
    transform: 0.0
    transform: 1.0
  }
}
stats {
  laser_object_counts {
    type: TYPE_VEHICLE
    count: 57
  }
  laser_object_counts {
    type: TYPE_PEDESTRIAN
    count: 1
  }
  laser_object_counts {
    type: TYPE_SIGN
    count: 9
  }
  time_of_day: "Day"
  location: "location_other"
  weather: "sunny"
  camera_object_counts {
    type: TYPE_VEHICLE
    count: 37
  }
  camera_object_counts {
    type: TYPE_PEDESTRIAN
    count: 1
  }
}
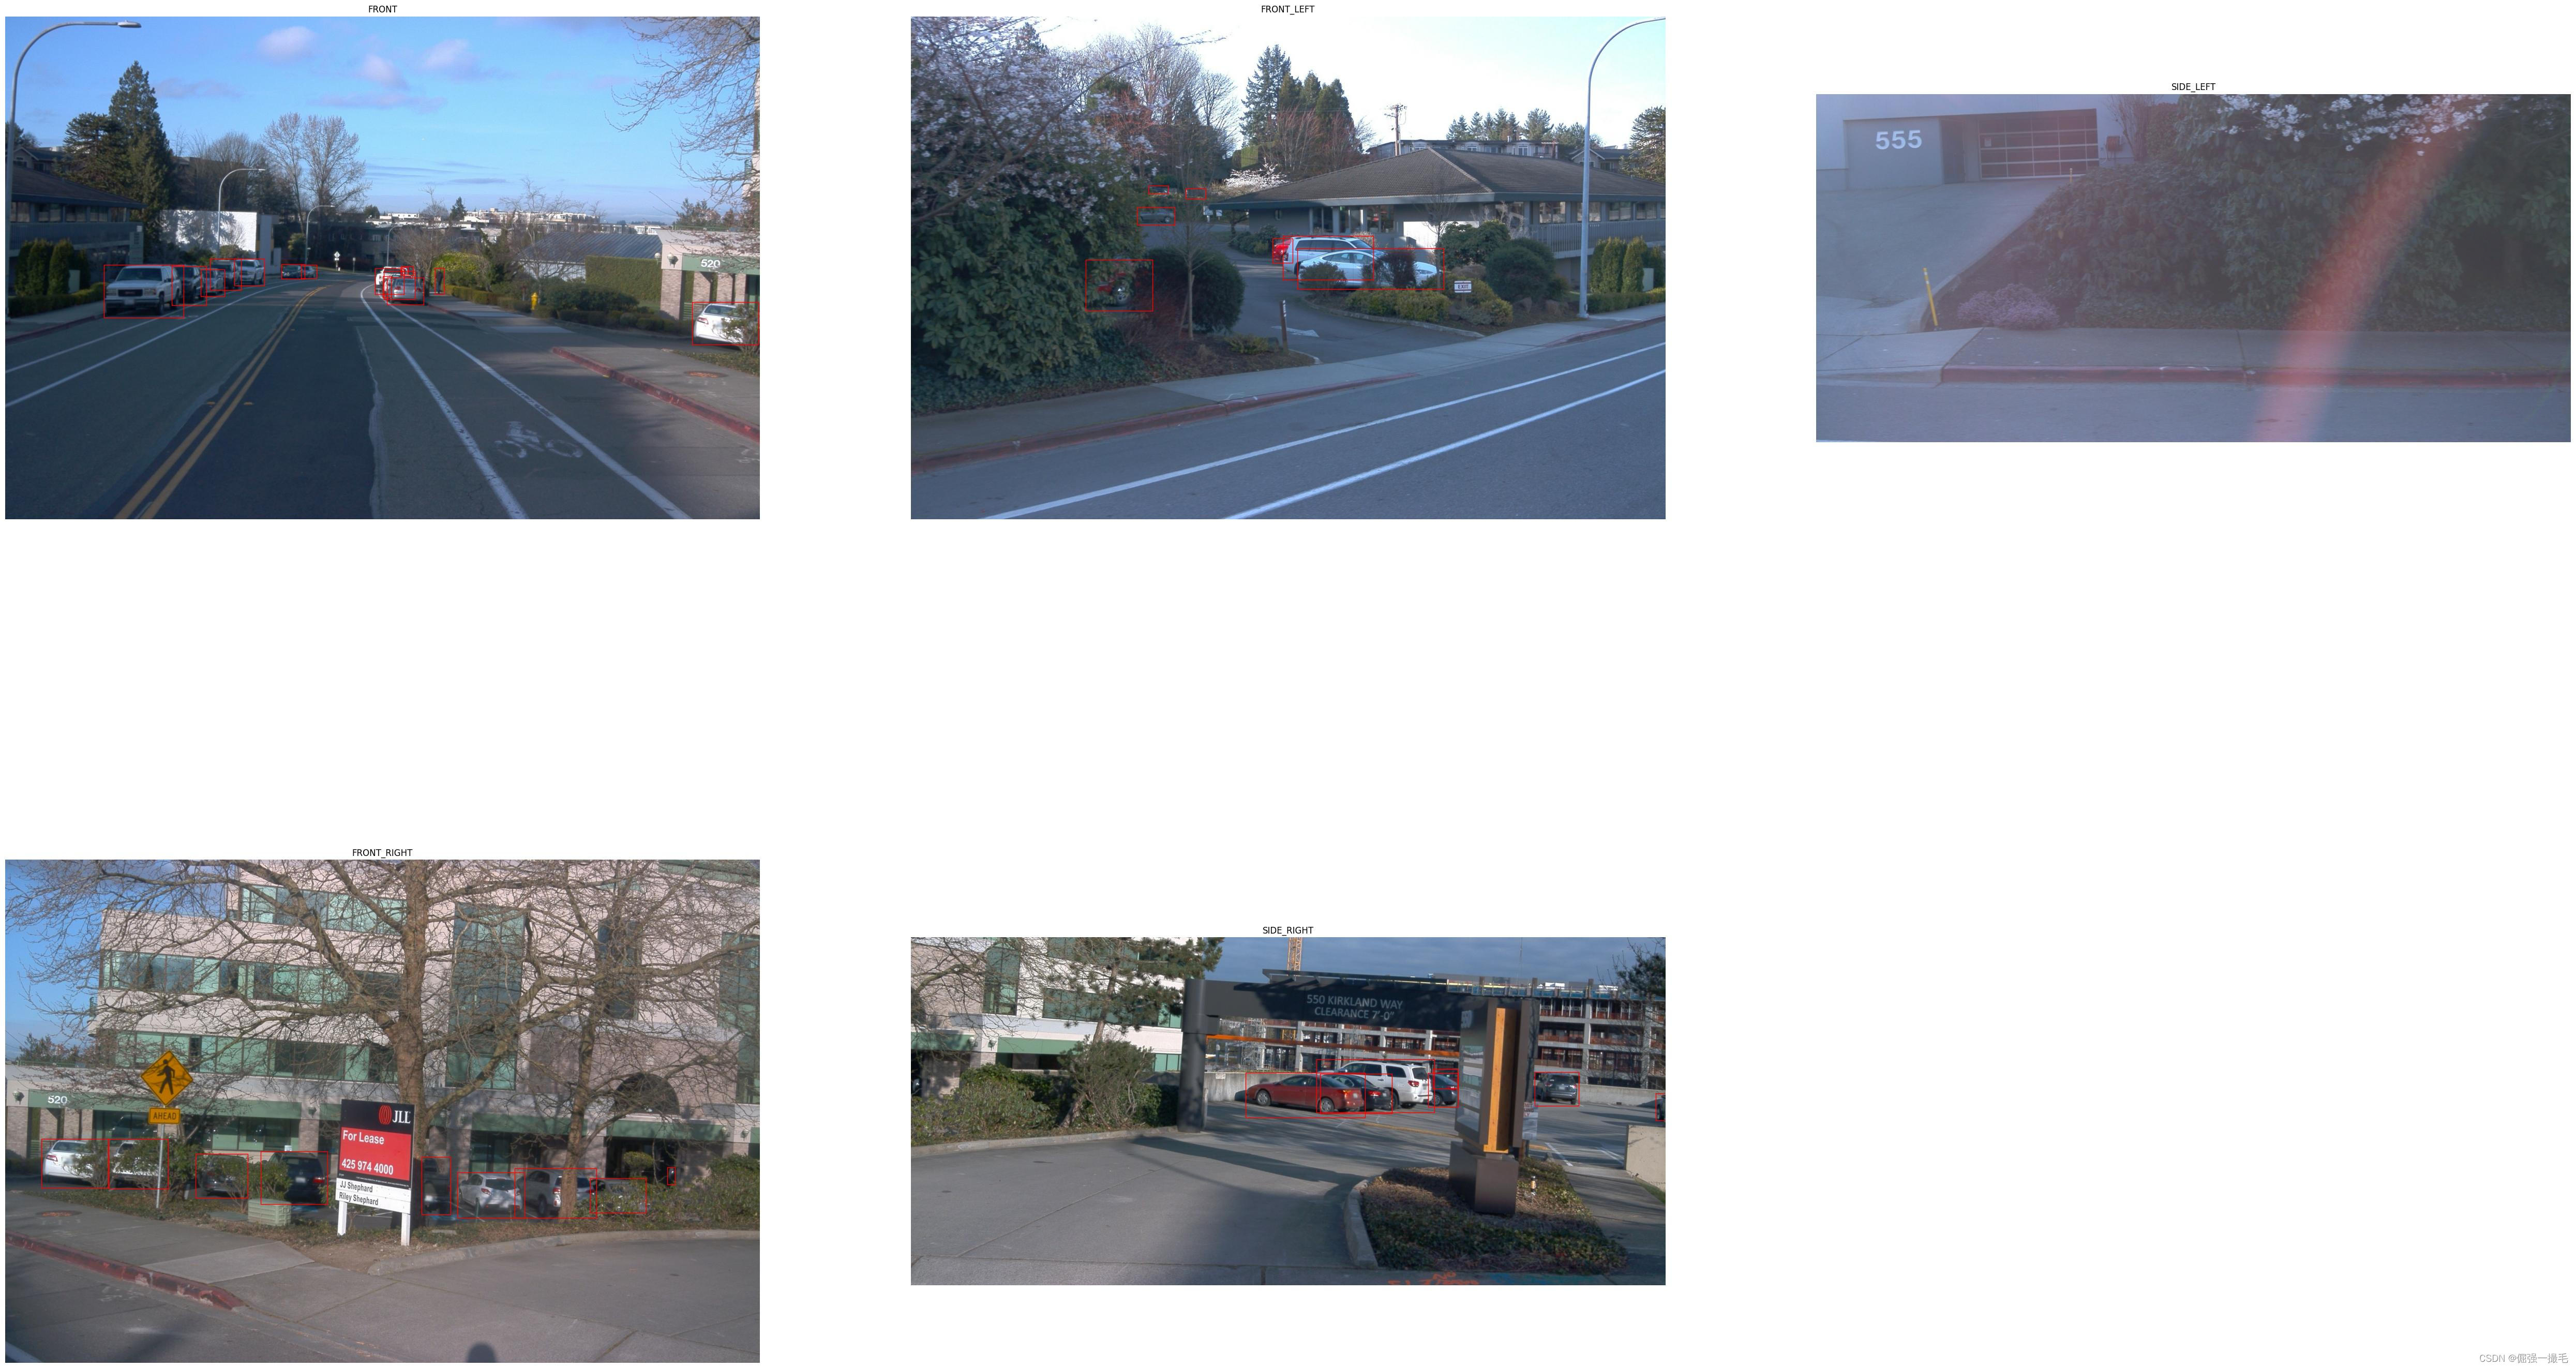
# 可视化相机图像和相机标签
import matplotlib.pyplot as plt
import matplotlib.patches as patches

def show_camera_image(camera_image, camera_labels, layout, cmap=None):
    """Show a camera image and the given camera labels."""
    ax = plt.subplot(*layout)
    # Draw the camera labels.
    for camera_labels in camera_labels:
        # Ignore camera labels that do not correspond to this camera.
        if camera_labels.name != camera_image.name:
            continue
        # Iterate over the individual labels.
        for label in camera_labels.labels:
            # Draw the object bounding box.
            ax.add_patch(patches.Rectangle(xy=(label.box.center_x - 0.5 * label.box.length,
               label.box.center_y - 0.5 * label.box.width),
               width=label.box.length, height=label.box.width,
               linewidth=1, edgecolor='red', facecolor='none'))
    # Show the camera image.
    plt.imshow(tf.image.decode_jpeg(camera_image.image), cmap=cmap)
    plt.title(open_dataset.CameraName.Name.Name(camera_image.name))
    plt.grid(False)
    plt.axis('off')

plt.figure(figsize=(64, 60))

for index, image in enumerate(frame.images):
    show_camera_image(image, frame.camera_labels, [3, 3, index+1])
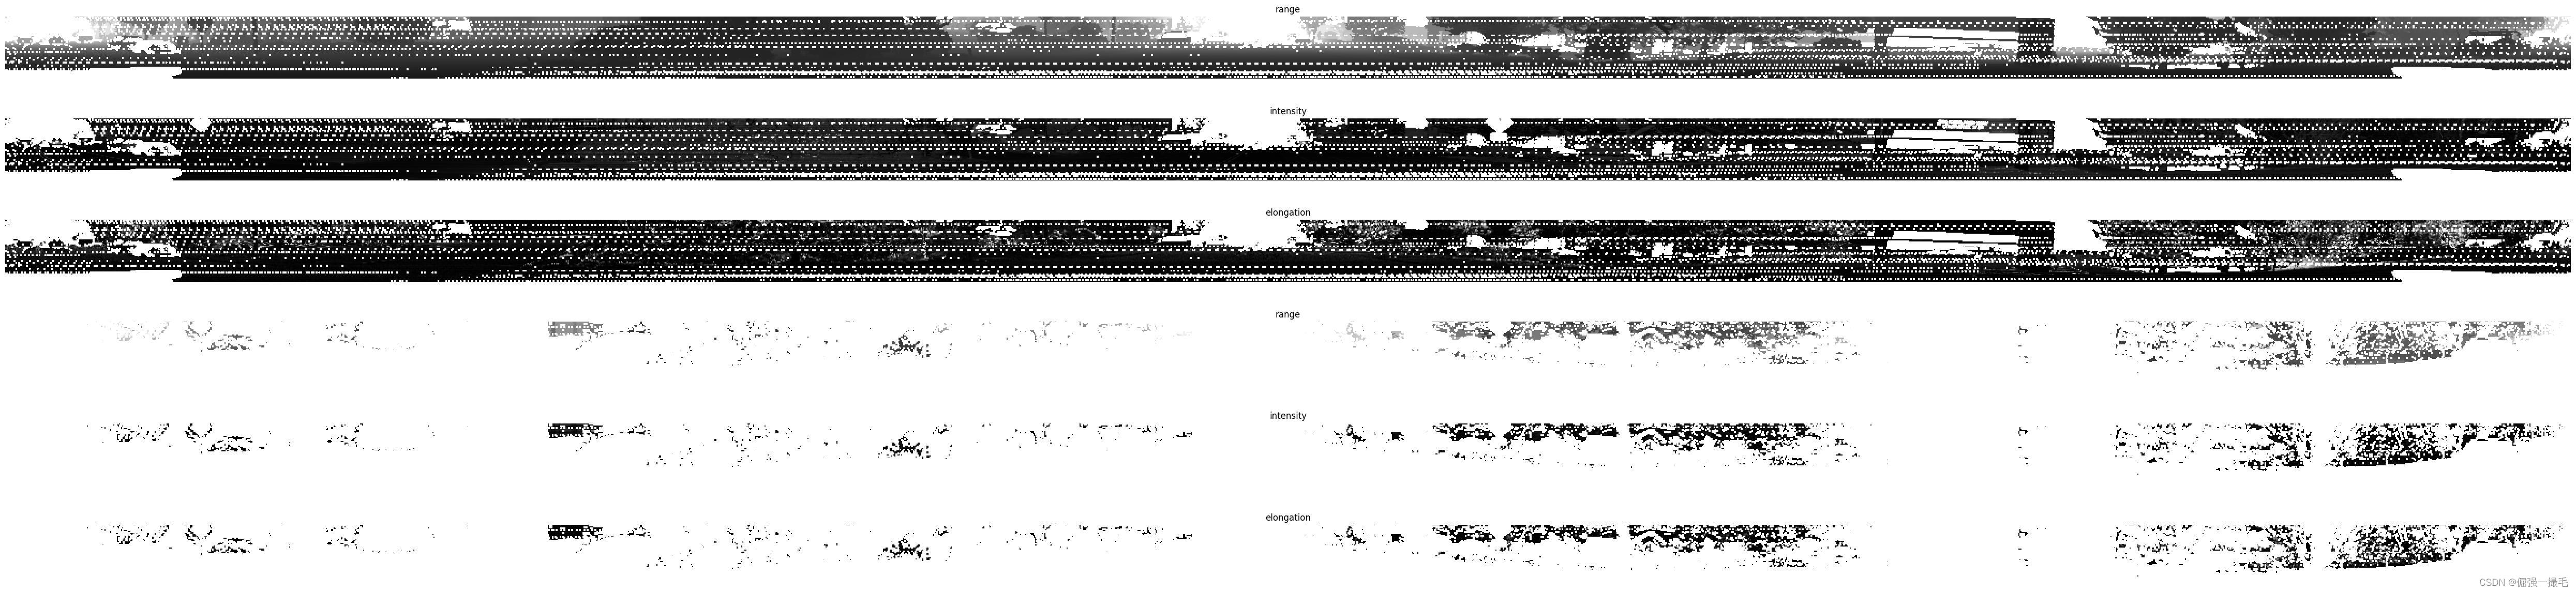
# 可视化距离图像
plt.figure(figsize=(64, 20))
def plot_range_image_helper(data, name, layout, vmin = 0, vmax=1, cmap='gray'):
    """Plots range image.

    Args:
        data: range image data
        name: the image title
        layout: plt layout
        vmin: minimum value of the passed data
        vmax: maximum value of the passed data
        cmap: color map
    """
    plt.subplot(*layout)
    plt.imshow(data, cmap=cmap, vmin=vmin, vmax=vmax)
    plt.title(name)
    plt.grid(False)
    plt.axis('off')

def get_range_image(laser_name, return_index):
    """Returns range image given a laser name and its return index."""
    return range_images[laser_name][return_index]

def show_range_image(range_image, layout_index_start = 1):
    """Shows range image.

    Args:
        range_image: the range image data from a given lidar of type MatrixFloat.
        layout_index_start: layout offset
    """
    range_image_tensor = tf.convert_to_tensor(range_image.data)
    range_image_tensor = tf.reshape(range_image_tensor, range_image.shape.dims)
    lidar_image_mask = tf.greater_equal(range_image_tensor, 0)
    range_image_tensor = tf.where(lidar_image_mask, range_image_tensor,
                                    tf.ones_like(range_image_tensor) * 1e10)
    range_image_range = range_image_tensor[...,0]
    range_image_intensity = range_image_tensor[...,1]
    range_image_elongation = range_image_tensor[...,2]
    plot_range_image_helper(range_image_range.numpy(), 'range',
                    [8, 1, layout_index_start], vmax=75, cmap='gray')
    plot_range_image_helper(range_image_intensity.numpy(), 'intensity',
                    [8, 1, layout_index_start + 1], vmax=1.5, cmap='gray')
    plot_range_image_helper(range_image_elongation.numpy(), 'elongation',
                    [8, 1, layout_index_start + 2], vmax=1.5, cmap='gray')
frame.lasers.sort(key=lambda laser: laser.name)
show_range_image(get_range_image(open_dataset.LaserName.TOP, 0), 1)
show_range_image(get_range_image(open_dataset.LaserName.TOP, 1), 4)
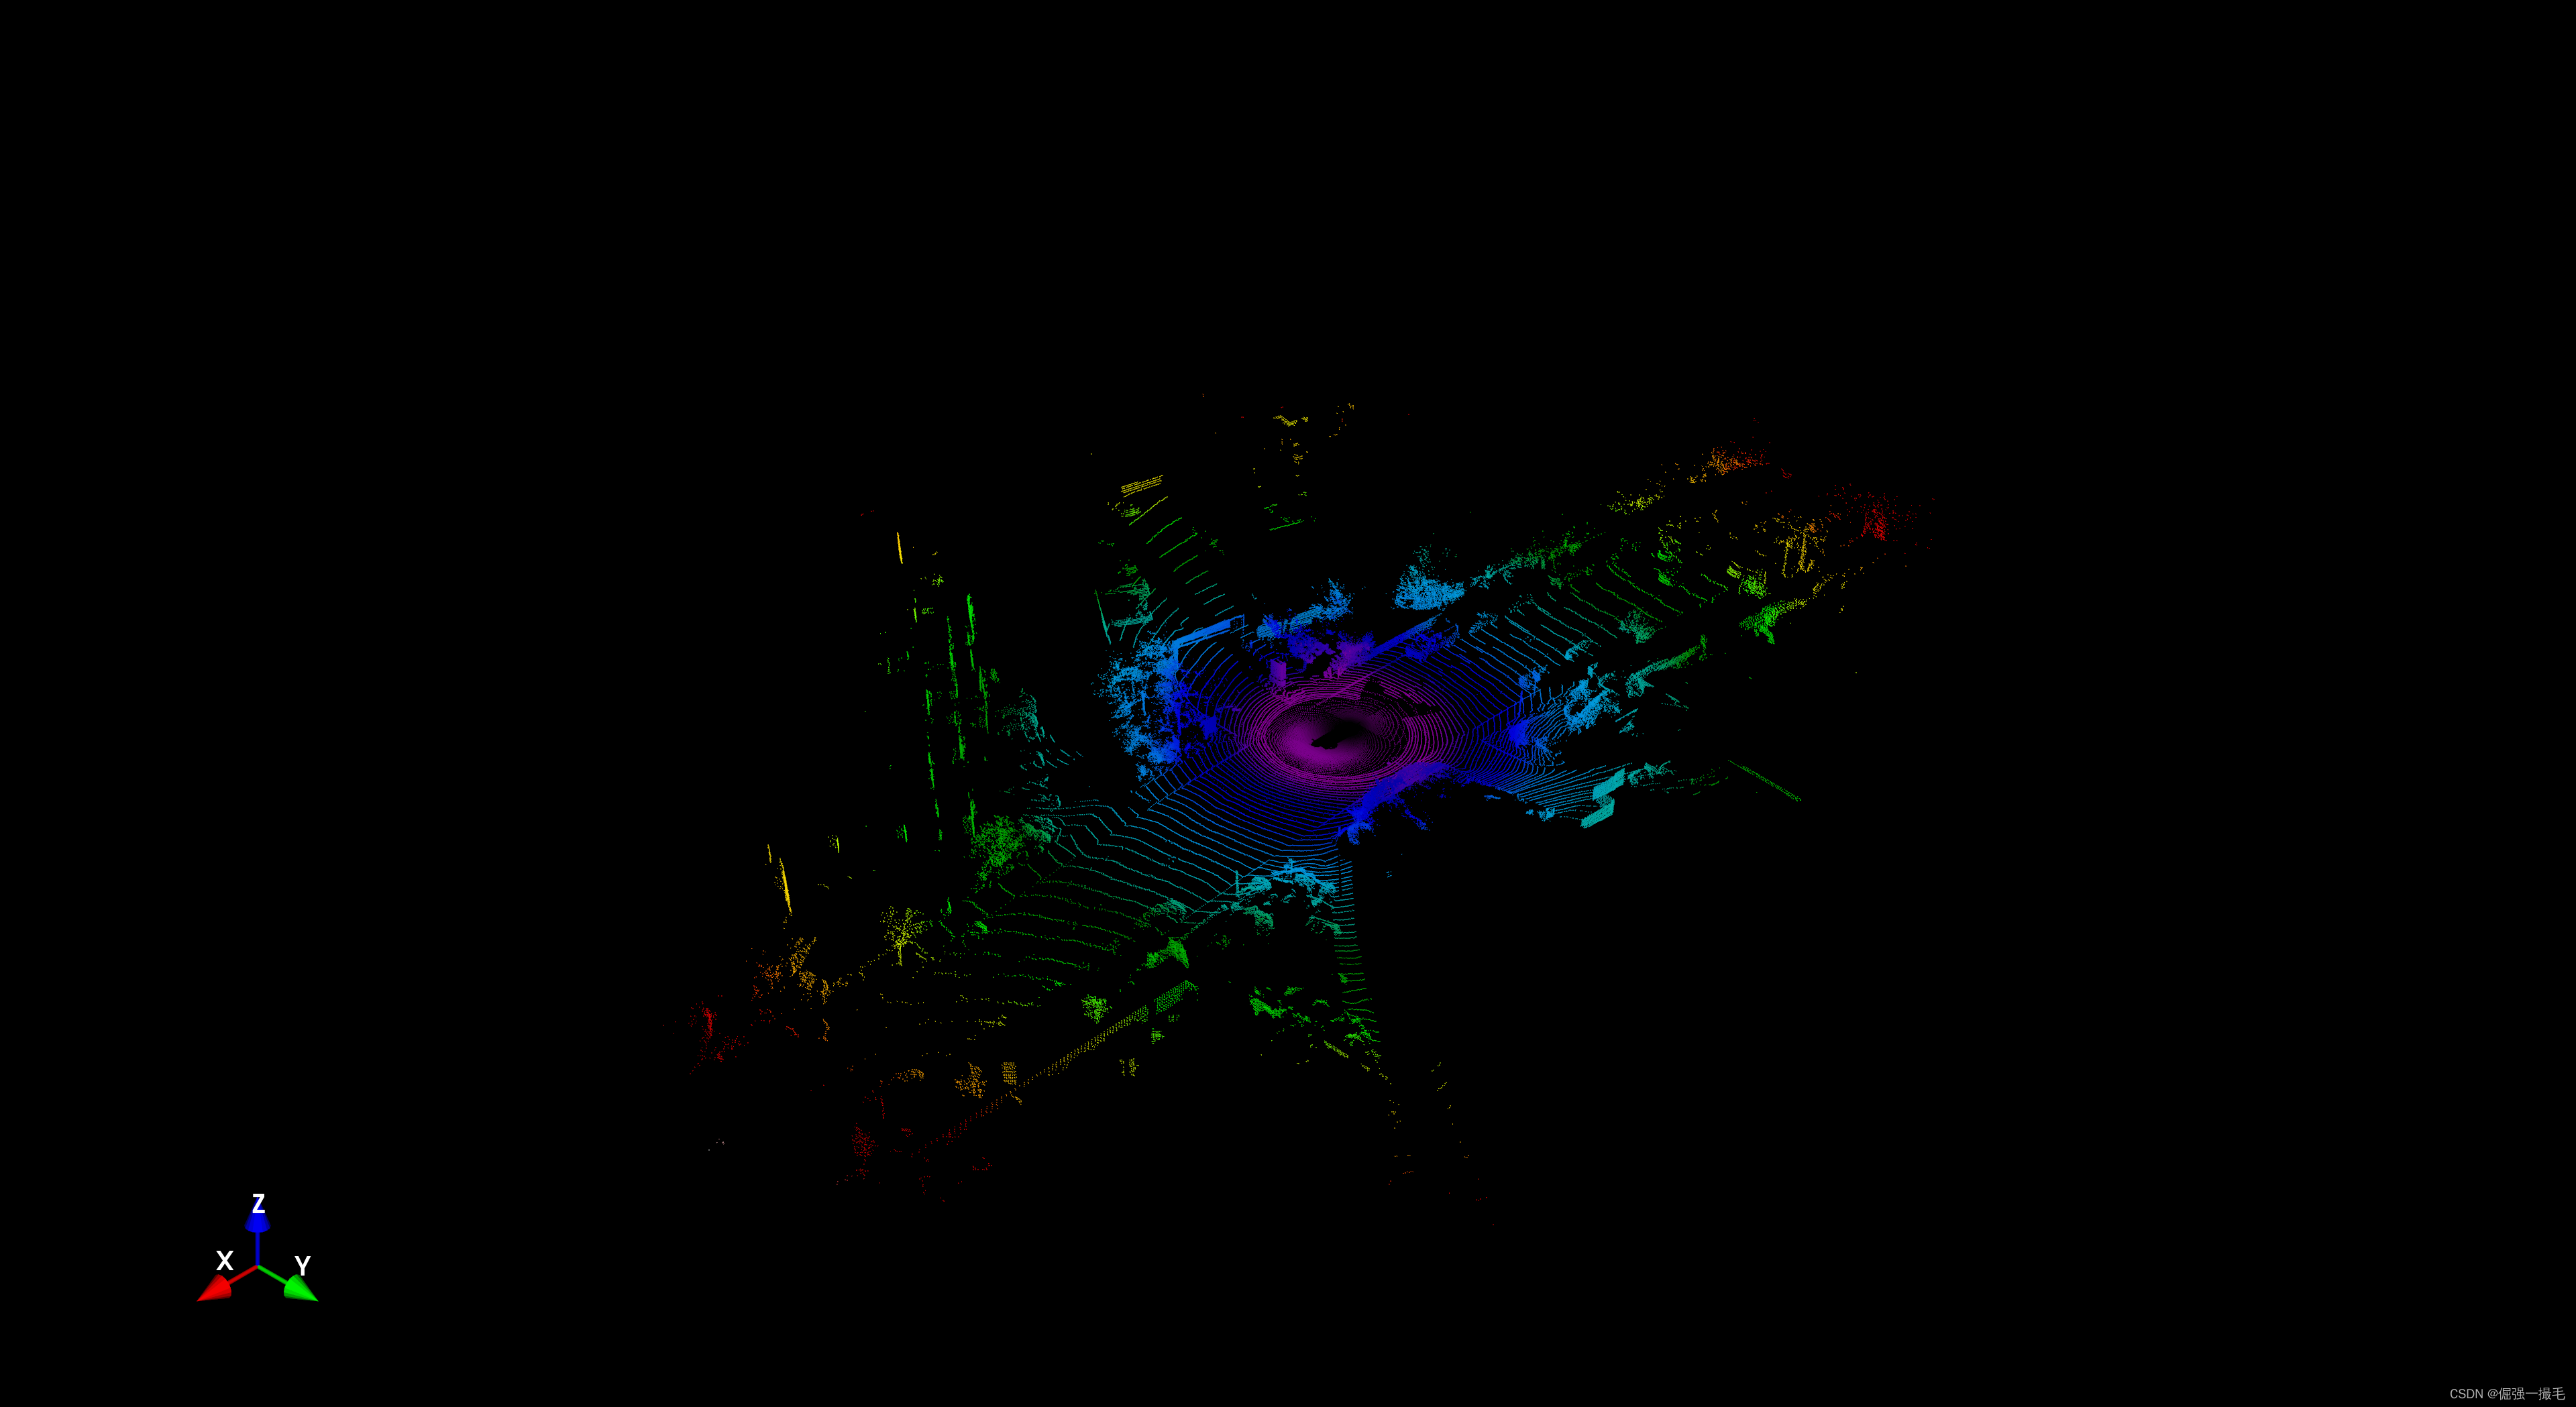
# 点云转换与可视化
points, cp_points = frame_utils.convert_range_image_to_point_cloud(
    frame,
    range_images,
    camera_projections,
    range_image_top_pose)
points_ri2, cp_points_ri2 = frame_utils.convert_range_image_to_point_cloud(
    frame,
    range_images,
    camera_projections,
    range_image_top_pose,
    ri_index=1)

# 3d points in vehicle frame.
points_all = np.concatenate(points, axis=0)
points_all_ri2 = np.concatenate(points_ri2, axis=0)
# camera projection corresponding to each point.
cp_points_all = np.concatenate(cp_points, axis=0)
cp_points_all_ri2 = np.concatenate(cp_points_ri2, axis=0)

print(points_all.shape)
print(cp_points_all.shape)
print(points_all[0:2])
for i in range(5):
    print(points[i].shape)
    print(cp_points[i].shape)

print(points_all_ri2.shape)
print(cp_points_all_ri2.shape)
print(points_all_ri2[0:2])
for i in range(5):
    print(points_ri2[i].shape)
    print(cp_points_ri2[i].shape)

# 上述points都是ndarray格式,可以用mayavi可视化点云
# 输出如下
(164256, 3)
(164256, 6)
[[-6.1152344e+01 -7.6904297e-03  4.3441429e+00]
 [-6.4060211e+01  1.4831543e-01  4.4438515e+00]]
(148217, 3)
(148217, 6)
(3847, 3)
(3847, 6)
(4171, 3)
(4171, 6)
(4421, 3)
(4421, 6)
(3600, 3)
(3600, 6)
(25830, 3)
(25830, 6)
[[-63.50363    12.851746    4.570942 ]
 [-64.729034   14.886841    4.6256332]]
(25425, 3)
(25425, 6)
(98, 3)
(98, 6)
(103, 3)
(103, 6)
(158, 3)
(158, 6)
(46, 3)
(46, 6)
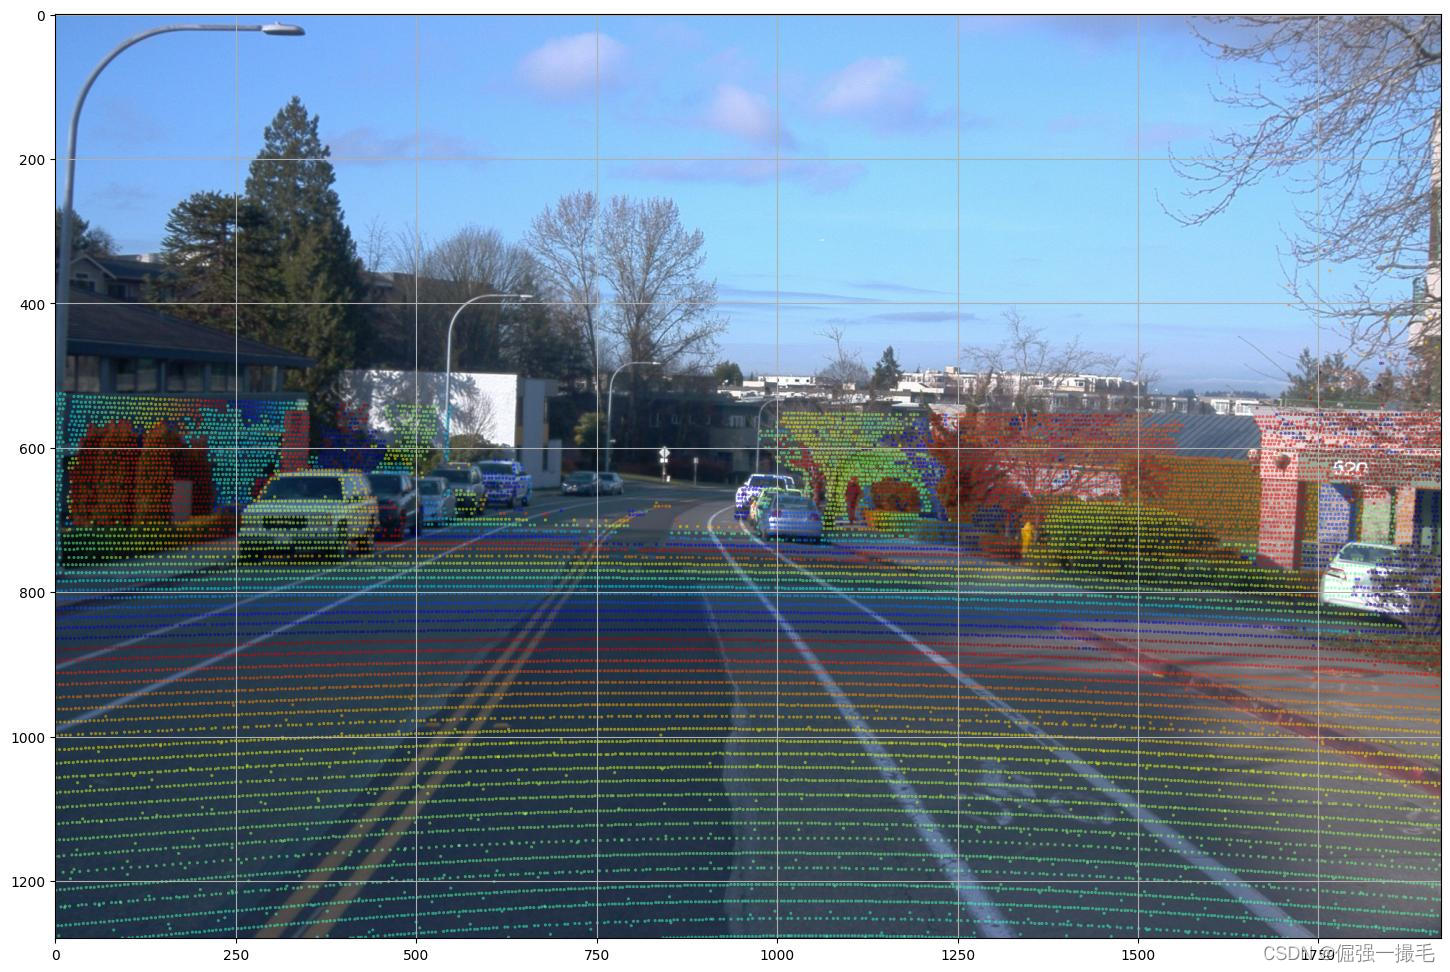
# 可视化相机投影
images = sorted(frame.images, key=lambda i:i.name)
cp_points_all_concat = np.concatenate([cp_points_all, points_all], axis=-1)
cp_points_all_concat_tensor = tf.constant(cp_points_all_concat)

# The distance between lidar points and vehicle frame origin.
points_all_tensor = tf.norm(points_all, axis=-1, keepdims=True)
cp_points_all_tensor = tf.constant(cp_points_all, dtype=tf.int32)

mask = tf.equal(cp_points_all_tensor[..., 0], images[0].name)

cp_points_all_tensor = tf.cast(tf.gather_nd(
    cp_points_all_tensor, tf.where(mask)), dtype=tf.float32)
points_all_tensor = tf.gather_nd(points_all_tensor, tf.where(mask))

projected_points_all_from_raw_data = tf.concat(
    [cp_points_all_tensor[..., 1:3], points_all_tensor], axis=-1).numpy()

def rgba(r):
    """Generates a color based on range.

    Args:
        r: the range value of a given point.
    Returns:
        The color for a given range
    """
    c = plt.get_cmap('jet')((r % 20.0) / 20.0)
    c = list(c)
    c[-1] = 0.5  # alpha
    return c

def plot_image(camera_image):
    """Plot a cmaera image."""
    plt.figure(figsize=(20, 12))
    plt.imshow(tf.image.decode_jpeg(camera_image.image))
    plt.grid("off")

# 可视化相机投影
def plot_points_on_image(projected_points, camera_image, rgba_func,
                         point_size=10.0):
    """Plots points on a camera image.

    Args:
        projected_points: [N, 3] numpy array. The inner dims are
        [camera_x, camera_y, range].
        camera_image: jpeg encoded camera image.
        rgba_func: a function that generates a color from a range value.
        point_size: the point size.

    """
    plot_image(camera_image)

    xs = []
    ys = []
    colors = []

    for point in projected_points:
        xs.append(point[0])  # width, col
        ys.append(point[1])  # height, row
        colors.append(rgba_func(point[2]))

    plt.scatter(xs, ys, c=colors, s=point_size, edgecolors="none")

plot_points_on_image(projected_points_all_from_raw_data,
                     images[0], rgba, point_size=5.0)
plt.savefig('pc_project.jpg', bbox_inches='tight')


 698
698

 被折叠的 条评论
为什么被折叠?
被折叠的 条评论
为什么被折叠?
 到【灌水乐园】发言


