


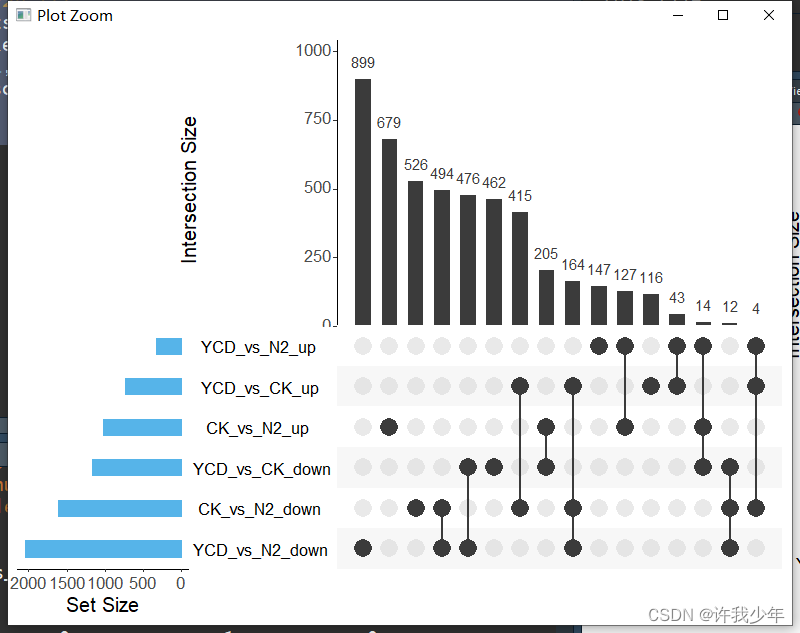
基于UpSetR画Upset韦恩图
首先data的格式为
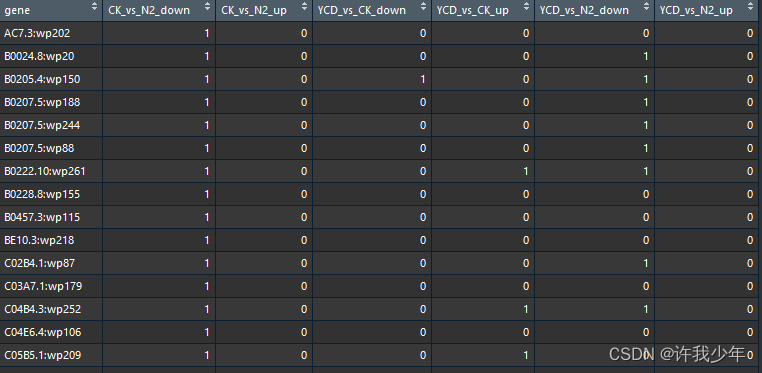
setwd('D:\\16_huangjian\\02_DEG')

library(ggplot2)
library(readxl)
library(UpSetR)
matrix = read.table("./upsForplot.txt", header=T, row.names=NULL, sep="\t")
nsets = dim(matrix)[2]-1
#pdf(file="upsetview.txt.upsetV.pdf", onefile=FALSE, paper="special", width=10,
#height=5, bg="white", pointsize=12)
upset(matrix, nsets=nsets, sets.bar.color = "#56B4E9",
      mb.ratio = c(0.5, 0.5),keep.order=T,#sets.x.labe
      point.size=6,line.size=1,#number.angles
      order.by = "freq",text.scale=1.8
      )
#dev.off()
结果
做该图的在线网站:https://www.omicstudio.cn/tool/43


 342
342


 被折叠的 条评论
为什么被折叠?
被折叠的 条评论
为什么被折叠?
 到【灌水乐园】发言


