


2、验证回环检测算法,需要有人工标记回环的数据集。然而人工标记回环是很不方便的,我们会考虑根据标准轨迹计算回环。即,如果轨迹中有两个帧的位姿非常相近,就认为它们是回环。请根据
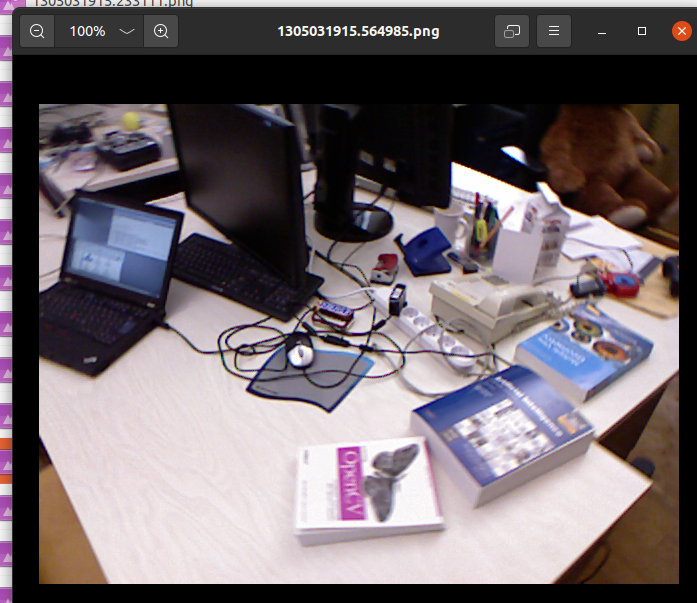
TUM数据集给出的标准轨迹,计算出一个数据集中的回环。这些回环的图像真的相似吗?

文章目录
20231010 更新
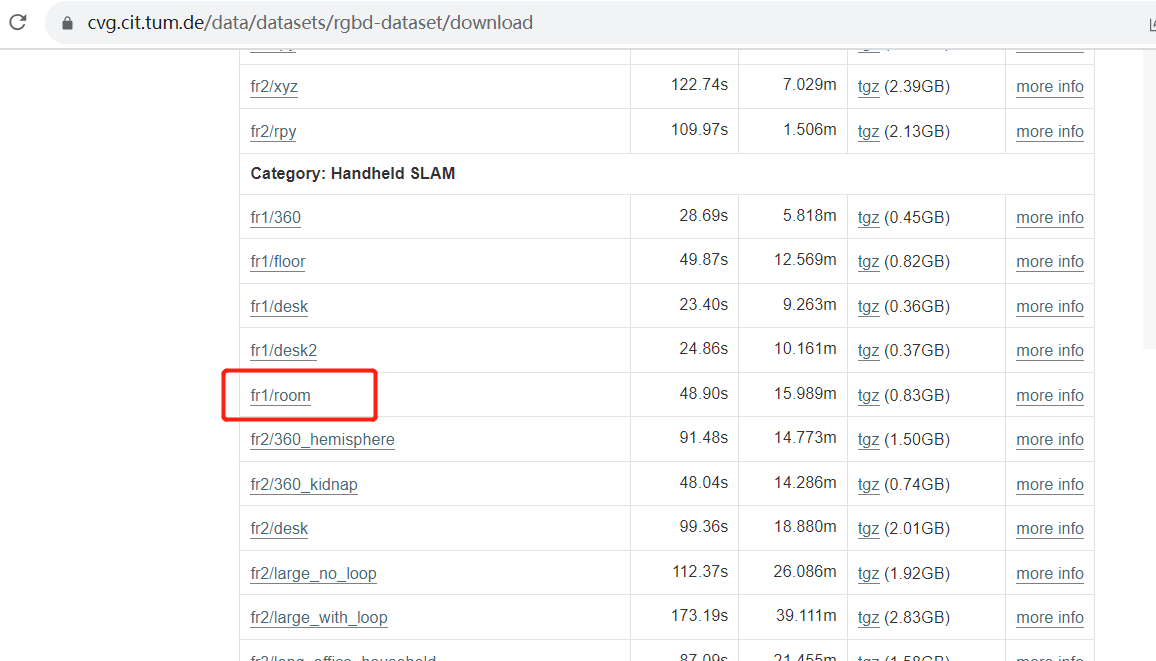
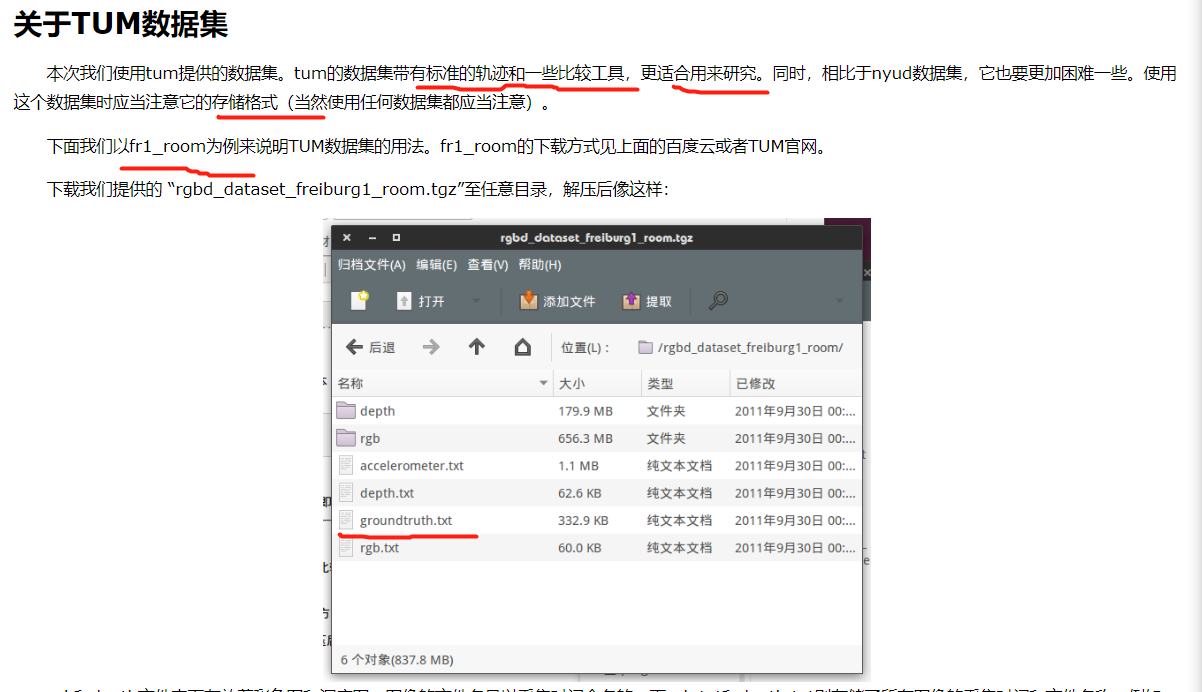
以 fr1/room 数据集为例
TUM数据集网址:https://cvg.cit.tum.de/data/datasets/rgbd-dataset/download
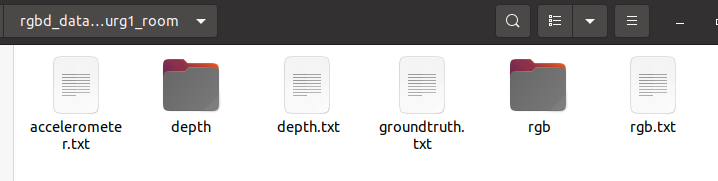


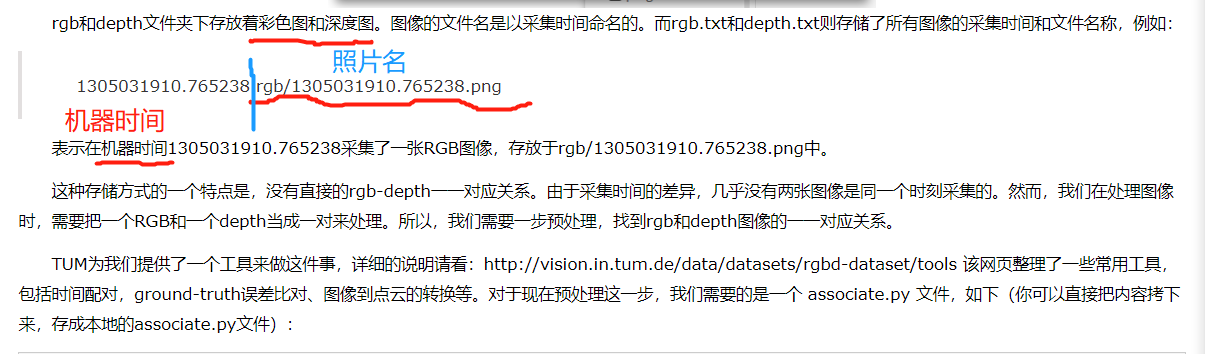
时间戳不一致,需要匹配
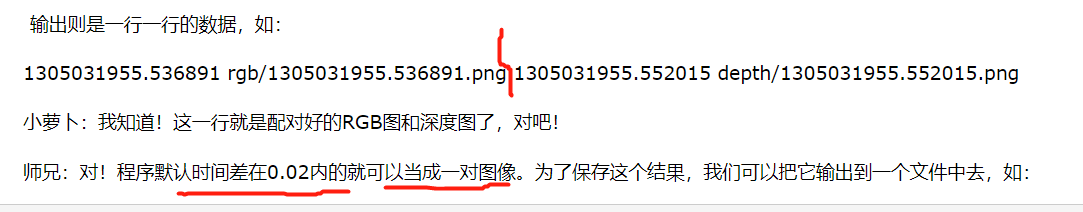
associate.py程序默认时间差在0.02内的就可以当成一对图像。
来自
associate.py的说明:
The Kinect provides the color and depth images in an un-synchronized way. This means that the set of time stamps from the color images do not intersect with those of the depth images. Therefore, we need some way of associating color images to depth images.
For this purpose, you can use the ‘‘associate.py’’ script. It reads the time stamps from the rgb.txt file and the depth.txt file, and joins them by finding the best matches.
Kinect以不同步的方式提供颜色和深度图像。这意味着来自彩色图像的时间戳集不会与深度图像的时间戳集相交。因此,我们需要某种方法将彩色图像与深度图像关联起来。为此,可以使用“associate.py”脚本。它从rgb.txt文件和depth.txt文件中读取时间戳,并通过寻找最佳匹配将它们连接起来。
将数据 匹配起来:
python3 associate.py rgb.txt depth.txt > associate.txt
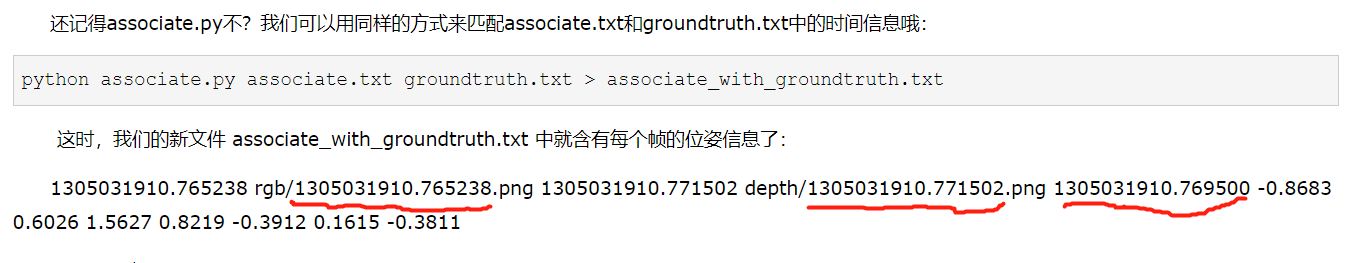
python3 associate.py associate.txt groundtruth.txt > associate_with_groundtruth.txt
报错:
Traceback (most recent call last):
  File "associate.py", line 119, in <module>
    matches = associate(first_list, second_list,float(args.offset),float(args.max_difference))
  File "associate.py", line 96, in associate
    first_keys.remove(a)
AttributeError: 'dict_keys' object has no attribute 'remove'
CMakeLists.txt
cmake_minimum_required(VERSION 2.8)

project(tum)  # 输出文件名

include_directories("/usr/include/eigen3")
find_package(Pangolin REQUIRED)
include_directories(${Pangolin_INCLUDE_DIRS})


add_executable(tum plotTrajectory.cpp)
target_link_libraries(tum ${Pangolin_LIBRARIES})

#[[
add_executable(tum tum.cpp)
target_link_libraries(tum ${Pangolin_LIBRARIES})

]]
Code: 标准轨迹 绘制 【无需删注释】
增加了 跳过注释 部分代码
#include <pangolin/pangolin.h>
#include <Eigen/Core>
#include <unistd.h>
#include <string>
// 本例演示了如何画出一个预先存储的轨迹
using namespace std;
using namespace Eigen;
// path to trajectory file
string trajectory_file = "../cvg.cit.tum.de_rgbd_dataset_freiburg1_rgbd_dataset_freiburg1_room-groundtruth.txt"; // 该文件和.cpp同一目录
void DrawTrajectory(vector<Isometry3d, Eigen::aligned_allocator<Isometry3d>>);
int main(int argc, char **argv) {
vector<Isometry3d, Eigen::aligned_allocator<Isometry3d>> poses;
ifstream fin(trajectory_file);
if (!fin) {
cout << "cannot find trajectory file at " << trajectory_file << endl;
return 1;
}
string line;
while (getline(fin,line)) {
if (line[0] == '#') // 跳过注释
continue;
double time, tx, ty, tz, qx, qy, qz, qw;
fin >> time >> tx >> ty >> tz >> qx >> qy >> qz >> qw;
Isometry3d Twr(Quaterniond(qw, qx, qy, qz));
Twr.pretranslate(Vector3d(tx, ty, tz));
poses.push_back(Twr);
}
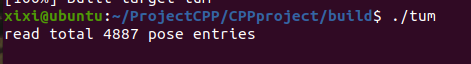
cout << "read total " << poses.size() << " pose entries" << endl;
// draw trajectory in pangolin
DrawTrajectory(poses);
return 0;
}
/*******************************************************************************************/
void DrawTrajectory(vector<Isometry3d, Eigen::aligned_allocator<Isometry3d>> poses) {
// create pangolin window and plot the trajectory
pangolin::CreateWindowAndBind("Trajectory Viewer", 1024, 768);
glEnable(GL_DEPTH_TEST);
glEnable(GL_BLEND);
glBlendFunc(GL_SRC_ALPHA, GL_ONE_MINUS_SRC_ALPHA);
pangolin::OpenGlRenderState s_cam(
pangolin::ProjectionMatrix(1024, 768, 500, 500, 512, 389, 0.1, 1000),
pangolin::ModelViewLookAt(0, -0.1, -1.8, 0, 0, 0, 0.0, -1.0, 0.0)
);
pangolin::View &d_cam = pangolin::CreateDisplay()
.SetBounds(0.0, 1.0, 0.0, 1.0, -1024.0f / 768.0f)
.SetHandler(new pangolin::Handler3D(s_cam));
while (pangolin::ShouldQuit() == false) {
glClear(GL_COLOR_BUFFER_BIT | GL_DEPTH_BUFFER_BIT);
d_cam.Activate(s_cam);
glClearColor(1.0f, 1.0f, 1.0f, 1.0f);
glLineWidth(2); // 修改 线的宽度
for (size_t i = 0; i < poses.size(); i++) {
// 画每个位姿的三个坐标轴
Vector3d Ow = poses[i].translation();
Vector3d Xw = poses[i] * (0.1 * Vector3d(1, 0, 0));
Vector3d Yw = poses[i] * (0.1 * Vector3d(0, 1, 0));
Vector3d Zw = poses[i] * (0.1 * Vector3d(0, 0, 1));
glBegin(GL_LINES);
glColor3f(1.0, 0.0, 0.0);
glVertex3d(Ow[0], Ow[1], Ow[2]);
glVertex3d(Xw[0], Xw[1], Xw[2]);
glColor3f(0.0, 1.0, 0.0);
glVertex3d(Ow[0], Ow[1], Ow[2]);
glVertex3d(Yw[0], Yw[1], Yw[2]);
glColor3f(0.0, 0.0, 1.0);
glVertex3d(Ow[0], Ow[1], Ow[2]);
glVertex3d(Zw[0], Zw[1], Zw[2]);
glEnd();
}
// 画出连线
for (size_t i = 0; i < poses.size(); i++) {
glColor3f(0.0, 0.0, 0.0);
glBegin(GL_LINES);
auto p1 = poses[i], p2 = poses[i + 1];
glVertex3d(p1.translation()[0], p1.translation()[1], p1.translation()[2]);
glVertex3d(p2.translation()[0], p2.translation()[1], p2.translation()[2]);
glEnd();
}
pangolin::FinishFrame();
usleep(5000); // sleep 5 ms
}
}
Code: 根据轨迹位姿判断回环
当取 Δ \Delta Δ = 50 时
#include <pangolin/pangolin.h>
#include <Eigen/Core>
#include <Eigen/Geometry>
#include <unistd.h>

using namespace std;
using namespace Eigen;

// path to groundtruth file
string groundtruth_file = "../associate_with_groundtruth.txt"; //  且.txt文件和.cpp在同一目录
// 设置检测的间隔,使得检测具有稀疏性的同时覆盖整个环境
int delta = 50;   // 这里的值要是不适合,有时测不到回环
// 齐次变换矩阵差的范数,小于该值时认为位姿非常接近
double threshold = 0.4;

int main(int argc, char **argv) {

  vector<Isometry3d, Eigen::aligned_allocator<Isometry3d>> poses;
  vector<string> times;

  ifstream fin(groundtruth_file);
  if (!fin) {
    cout << "cannot find trajectory file at " << groundtruth_file << endl;
    return 1;
  }


  string line;
  while (getline(fin,line)) {
    if (line[0] == '#')  // 跳过注释
        continue;

    string time, temp1, temp2, temp3, temp4;
    double tx, ty, tz, qx, qy, qz, qw;
    fin >> time >> temp1 >> temp2 >> temp3 >> temp4 >> tx >> ty >> tz >> qx >> qy >> qz >> qw;
    Isometry3d Twr(Quaterniond(qw, qx, qy, qz));
    Twr.pretranslate(Vector3d(tx, ty, tz));
    times.push_back(time); // 后面要用这个时间戳
    poses.push_back(Twr);
  }
  cout << "read total " << poses.size() << " pose entries" << endl;

  //设置检测到回环后重新开始检测图片间隔数量
  cout << "**************************************************" << endl;
  cout << "Detection Start!!!" << endl;
  cout << "**************************************************" << endl;
  for (size_t i = 0 ; i < poses.size() - delta; i += delta){
    for (size_t j = i + delta ; j < poses.size() ; j++){
      Matrix4d Error = (poses[i].inverse() * poses[j]).matrix() - Matrix4d::Identity();
      if (Error.norm() < threshold){
	cout << "时间戳为 " << times[i] << " 的rgb照片与时间戳为 "<< times[j] << " 的rgb照片构成回环" << endl;
	cout << "位姿误差为" << Error.norm() << endl;
	cout << "**************************************************" << endl;
	break;
      }
    }
  }
  cout << "Detection Finish!!!" << endl;
  cout << "**************************************************" << endl;
  return 0;
}
这里的位姿 差评估方法 为:

感觉有更好的评估方式
Δ
\Delta
Δ 和 阈值 都是可调的,可以看看区别。
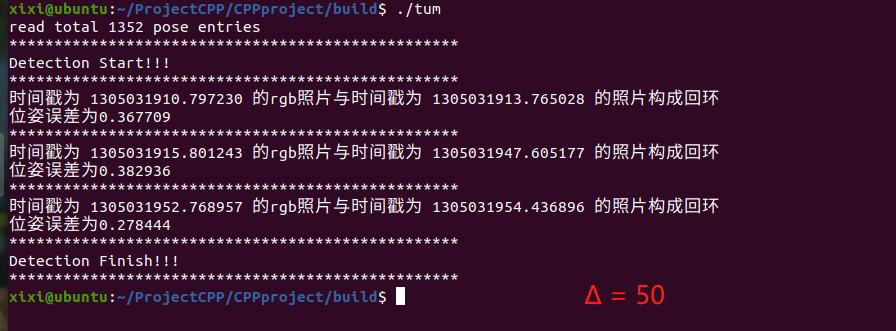
这里的 位姿数量变少了,由于 associate.py 只匹配时间戳上最接近的点,缺少相近时间戳的前面部分位姿被排除了。
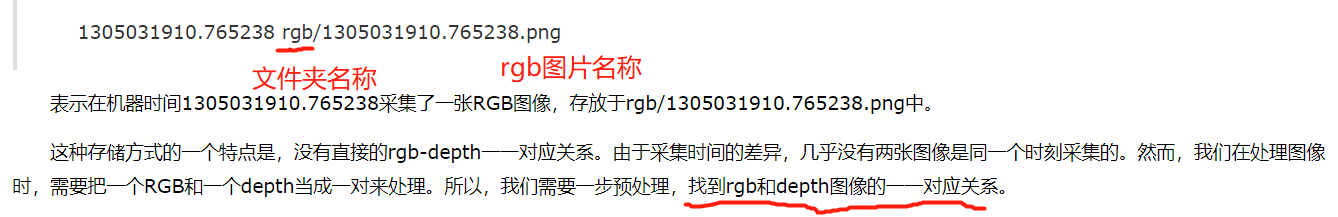
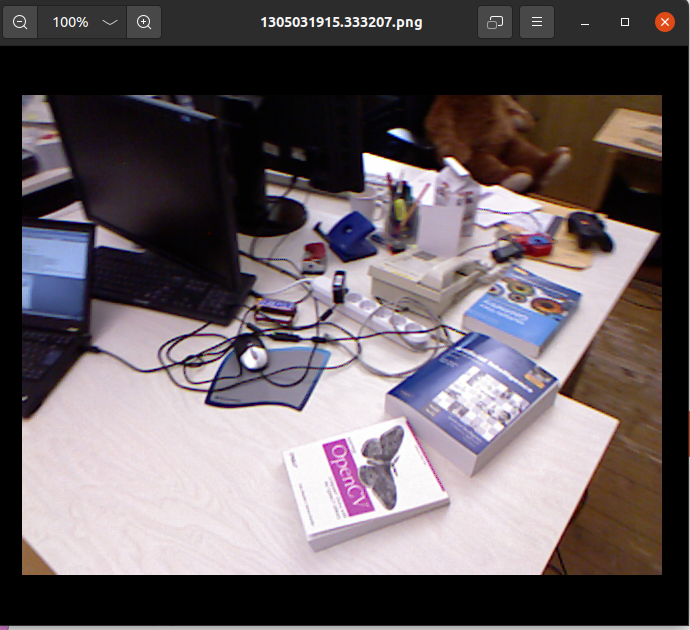
在 rgb 文件夹找相应的图片
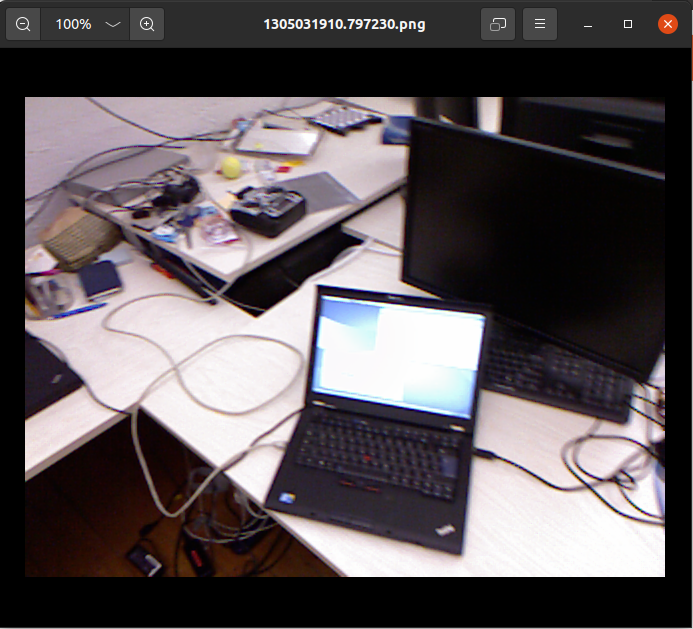


就这个程序而言,返回结果的相似程度显然取决于 阈值的设置,阈值越小越相似。但阈值过小有可能错过部分实际回环点。此外
Δ
\Delta
Δ 设置过大有可能错过部分实际回环点,过小有可能返回非期待的 附近的相似点。
有待改进。
之前的
——————————————
TUM数据集资料_链接
TUM数据集网址:https://cvg.cit.tum.de/data/datasets/rgbd-dataset/download
TUM 数据集 使用Tips
【Ctrl + ‘+’】放大字体。 博客园的字体有点小。
普通人; 赚钱花钱
乐趣:搞科研 + 码代码

associate.py
#!/usr/bin/python
# Software License Agreement (BSD License)
#
# Copyright (c) 2013, Juergen Sturm, TUM
# All rights reserved.
#
# Redistribution and use in source and binary forms, with or without
# modification, are permitted provided that the following conditions
# are met:
#
#  * Redistributions of source code must retain the above copyright
#    notice, this list of conditions and the following disclaimer.
#  * Redistributions in binary form must reproduce the above
#    copyright notice, this list of conditions and the following
#    disclaimer in the documentation and/or other materials provided
#    with the distribution.
#  * Neither the name of TUM nor the names of its
#    contributors may be used to endorse or promote products derived
#    from this software without specific prior written permission.
#
# THIS SOFTWARE IS PROVIDED BY THE COPYRIGHT HOLDERS AND CONTRIBUTORS
# "AS IS" AND ANY EXPRESS OR IMPLIED WARRANTIES, INCLUDING, BUT NOT
# LIMITED TO, THE IMPLIED WARRANTIES OF MERCHANTABILITY AND FITNESS
# FOR A PARTICULAR PURPOSE ARE DISCLAIMED. IN NO EVENT SHALL THE
# COPYRIGHT OWNER OR CONTRIBUTORS BE LIABLE FOR ANY DIRECT, INDIRECT,
# INCIDENTAL, SPECIAL, EXEMPLARY, OR CONSEQUENTIAL DAMAGES (INCLUDING,
# BUT NOT LIMITED TO, PROCUREMENT OF SUBSTITUTE GOODS OR SERVICES;
# LOSS OF USE, DATA, OR PROFITS; OR BUSINESS INTERRUPTION) HOWEVER
# CAUSED AND ON ANY THEORY OF LIABILITY, WHETHER IN CONTRACT, STRICT
# LIABILITY, OR TORT (INCLUDING NEGLIGENCE OR OTHERWISE) ARISING IN
# ANY WAY OUT OF THE USE OF THIS SOFTWARE, EVEN IF ADVISED OF THE
# POSSIBILITY OF SUCH DAMAGE.
#
# Requirements:
# sudo apt-get install python-argparse

"""
The Kinect provides the color and depth images in an un-synchronized way. This means that the set of time stamps from the color images do not intersect with those of the depth images. Therefore, we need some way of associating color images to depth images.

For this purpose, you can use the ''associate.py'' script. It reads the time stamps from the rgb.txt file and the depth.txt file, and joins them by finding the best matches.
"""

import argparse
import sys
import os
import numpy


def read_file_list(filename):
    """
    Reads a trajectory from a text file.

    File format:
    The file format is "stamp d1 d2 d3 ...", where stamp denotes the time stamp (to be matched)
    and "d1 d2 d3.." is arbitary data (e.g., a 3D position and 3D orientation) associated to this timestamp.

    Input:
    filename -- File name

    Output:
    dict -- dictionary of (stamp,data) tuples

    """
    file = open(filename)
    data = file.read()
    lines = data.replace(","," ").replace("\t"," ").split("\n")
    list = [[v.strip() for v in line.split(" ") if v.strip()!=""] for line in lines if len(line)>0 and line[0]!="#"]
    list = [(float(l[0]),l[1:]) for l in list if len(l)>1]
    return dict(list)

def associate(first_list, second_list,offset,max_difference):
    """
    Associate two dictionaries of (stamp,data). As the time stamps never match exactly, we aim
    to find the closest match for every input tuple.

    Input:
    first_list -- first dictionary of (stamp,data) tuples
    second_list -- second dictionary of (stamp,data) tuples
    offset -- time offset between both dictionaries (e.g., to model the delay between the sensors)
    max_difference -- search radius for candidate generation

    Output:
    matches -- list of matched tuples ((stamp1,data1),(stamp2,data2))

    """
    first_keys = first_list.keys()
    second_keys = second_list.keys()
    potential_matches = [(abs(a - (b + offset)), a, b)
                         for a in first_keys
                         for b in second_keys
                         if abs(a - (b + offset)) < max_difference]
    potential_matches.sort()
    matches = []
    for diff, a, b in potential_matches:
        if a in first_keys and b in second_keys:
            first_keys.remove(a)
            second_keys.remove(b)
            matches.append((a, b))

    matches.sort()
    return matches

if __name__ == '__main__':

    # parse command line
    parser = argparse.ArgumentParser(description='''
    This script takes two data files with timestamps and associates them
    ''')
    parser.add_argument('first_file', help='first text file (format: timestamp data)')
    parser.add_argument('second_file', help='second text file (format: timestamp data)')
    parser.add_argument('--first_only', help='only output associated lines from first file', action='store_true')
    parser.add_argument('--offset', help='time offset added to the timestamps of the second file (default: 0.0)',default=0.0)
    parser.add_argument('--max_difference', help='maximally allowed time difference for matching entries (default: 0.02)',default=0.02)
    args = parser.parse_args()

    first_list = read_file_list(args.first_file)
    second_list = read_file_list(args.second_file)

    matches = associate(first_list, second_list,float(args.offset),float(args.max_difference))

    if args.first_only:
        for a,b in matches:
            print("%f %s"%(a," ".join(first_list[a])))
    else:
        for a,b in matches:
            print("%f %s %f %s"%(a," ".join(first_list[a]),b-float(args.offset)," ".join(second_list[b])))

# associate.py
python associate.py rgb.txt depth.txt
python associate.py rgb.txt depth.txt > associate.txt

draw_groundtruth.py

python draw_groundtruth.py
如何查找每个图像的真实位置呢?
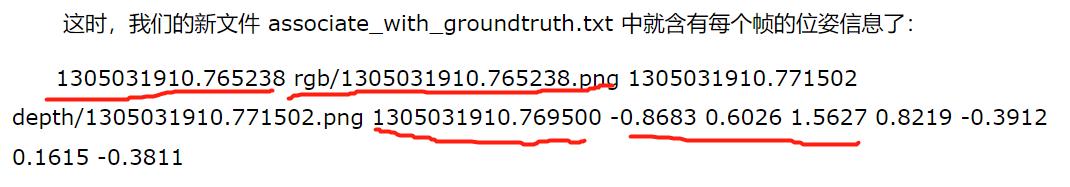
python associate.py associate.txt groundtruth.txt > associate_with_groundtruth.txt
- 存 associate.py
- 试运行
使用TUM数据集,并与标准轨迹进行比较
数据集下载
TUM数据集网址:https://cvg.cit.tum.de/data/datasets/rgbd-dataset/download
wget https://cvg.cit.tum.de/rgbd/dataset/freiburg1/rgbd_dataset_freiburg1_room.tgz
tar -xf rgbd_dataset_freiburg1_room.tgz
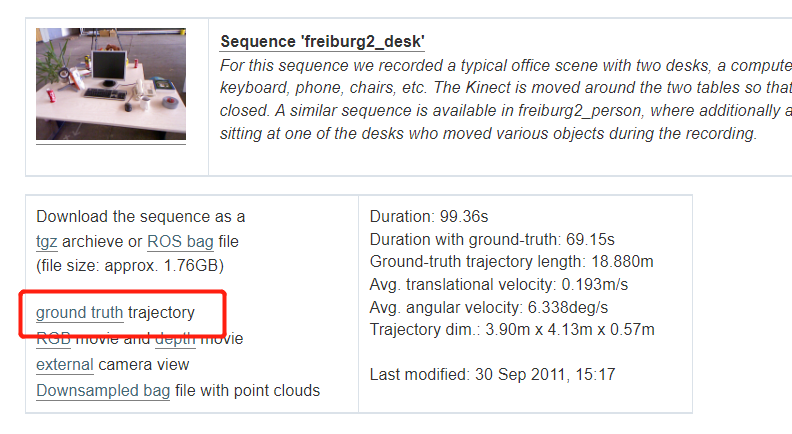
仅下载轨迹
TUM数据集网址:https://cvg.cit.tum.de/data/datasets/rgbd-dataset/download
https://cvg.cit.tum.de/data/datasets/rgbd-dataset/download
在数据集下载界面往下拉 或

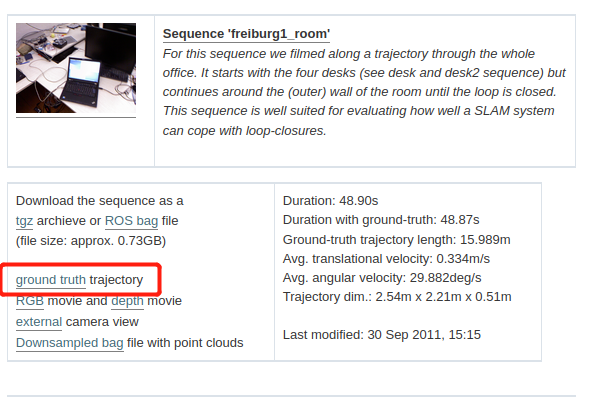
点击进去,另存为。
https://cvg.cit.tum.de/rgbd/dataset/freiburg1/rgbd_dataset_freiburg1_room-groundtruth.txt 或直接复制这个链接,另存即可。
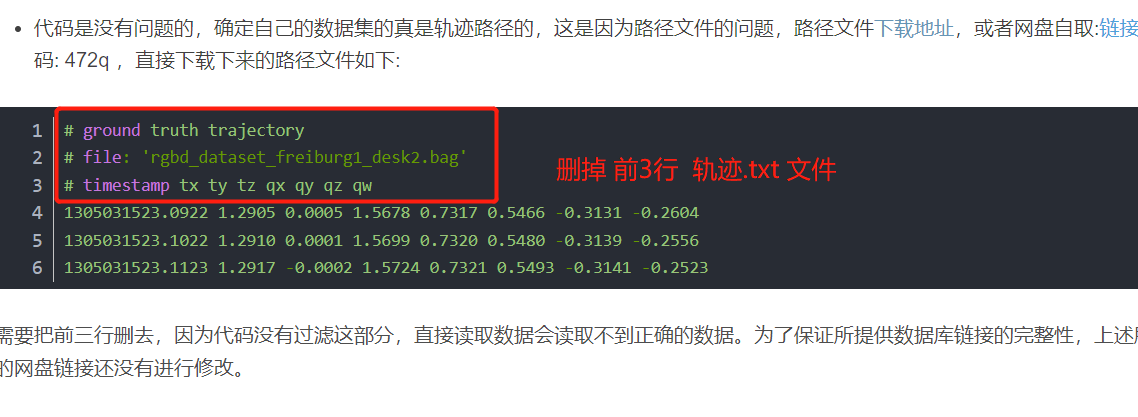
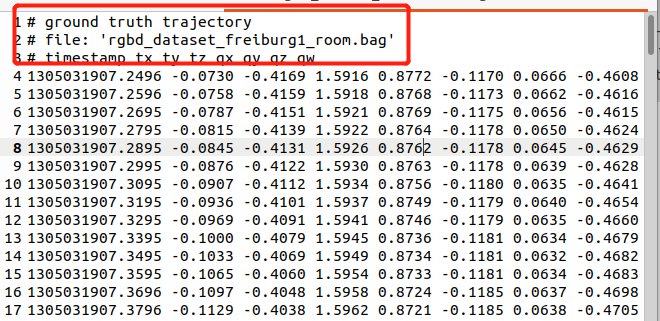
需要把轨迹的.txt的前3行注释删掉
!! 轨迹显示
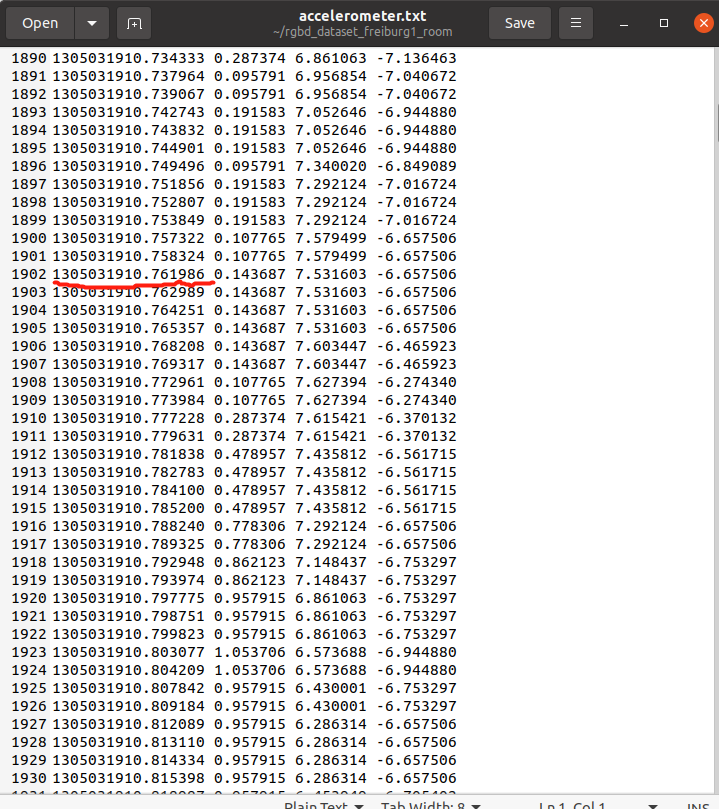
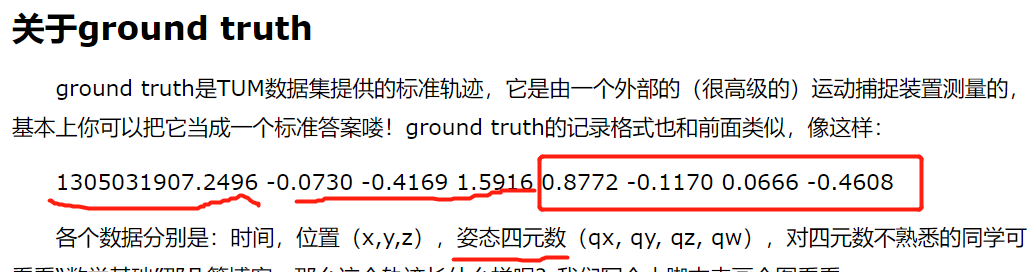
trajectory.txt每一行的内容为: t i m e , t x , t y , t z , q x , q y , q z time, t_x,t_y,t_z,q_x, q_y, q_z time,tx,ty,tz,qx,qy,qz
time: 该位姿的记录时间
t \bm{t} t:平移
q \bm{q} q:旋转四元数
plotTrajectory.cpp
#include <pangolin/pangolin.h>
#include <Eigen/Core>
#include <unistd.h>

// 本例演示了如何画出一个预先存储的轨迹

using namespace std;
using namespace Eigen;

// path to trajectory file
string trajectory_file = "../rgbd_dataset_freiburg1_desk-groundtruth.txt"; // 该文件和.cpp同一目录

void DrawTrajectory(vector<Isometry3d, Eigen::aligned_allocator<Isometry3d>>);

int main(int argc, char **argv) {

  vector<Isometry3d, Eigen::aligned_allocator<Isometry3d>> poses;
  ifstream fin(trajectory_file);
  if (!fin) {
    cout << "cannot find trajectory file at " << trajectory_file << endl;
    return 1;
  }

  while (!fin.eof()) {
    double time, tx, ty, tz, qx, qy, qz, qw;
    fin >> time >> tx >> ty >> tz >> qx >> qy >> qz >> qw;
    Isometry3d Twr(Quaterniond(qw, qx, qy, qz));
    Twr.pretranslate(Vector3d(tx, ty, tz));
    poses.push_back(Twr);
  }
  cout << "read total " << poses.size() << " pose entries" << endl;

  // draw trajectory in pangolin
  DrawTrajectory(poses);
  return 0;
}

/*******************************************************************************************/
void DrawTrajectory(vector<Isometry3d, Eigen::aligned_allocator<Isometry3d>> poses) {
  // create pangolin window and plot the trajectory
  pangolin::CreateWindowAndBind("Trajectory Viewer", 1024, 768);
  glEnable(GL_DEPTH_TEST);
  glEnable(GL_BLEND);
  glBlendFunc(GL_SRC_ALPHA, GL_ONE_MINUS_SRC_ALPHA);

  pangolin::OpenGlRenderState s_cam(
    pangolin::ProjectionMatrix(1024, 768, 500, 500, 512, 389, 0.1, 1000),
    pangolin::ModelViewLookAt(0, -0.1, -1.8, 0, 0, 0, 0.0, -1.0, 0.0)
  );

  pangolin::View &d_cam = pangolin::CreateDisplay()
    .SetBounds(0.0, 1.0, 0.0, 1.0, -1024.0f / 768.0f)
    .SetHandler(new pangolin::Handler3D(s_cam));

  while (pangolin::ShouldQuit() == false) {
    glClear(GL_COLOR_BUFFER_BIT | GL_DEPTH_BUFFER_BIT);
    d_cam.Activate(s_cam);
    glClearColor(1.0f, 1.0f, 1.0f, 1.0f);
    glLineWidth(2);  //  修改 线的宽度
    for (size_t i = 0; i < poses.size(); i++) {
      // 画每个位姿的三个坐标轴
      Vector3d Ow = poses[i].translation();
      Vector3d Xw = poses[i] * (0.1 * Vector3d(1, 0, 0));
      Vector3d Yw = poses[i] * (0.1 * Vector3d(0, 1, 0));
      Vector3d Zw = poses[i] * (0.1 * Vector3d(0, 0, 1));
      glBegin(GL_LINES);
      glColor3f(1.0, 0.0, 0.0);
      glVertex3d(Ow[0], Ow[1], Ow[2]);
      glVertex3d(Xw[0], Xw[1], Xw[2]);
      glColor3f(0.0, 1.0, 0.0);
      glVertex3d(Ow[0], Ow[1], Ow[2]);
      glVertex3d(Yw[0], Yw[1], Yw[2]);
      glColor3f(0.0, 0.0, 1.0);
      glVertex3d(Ow[0], Ow[1], Ow[2]);
      glVertex3d(Zw[0], Zw[1], Zw[2]);
      glEnd();
    }
    // 画出连线
    for (size_t i = 0; i < poses.size(); i++) {
      glColor3f(0.0, 0.0, 0.0);
      glBegin(GL_LINES);
      auto p1 = poses[i], p2 = poses[i + 1];
      glVertex3d(p1.translation()[0], p1.translation()[1], p1.translation()[2]);
      glVertex3d(p2.translation()[0], p2.translation()[1], p2.translation()[2]);
      glEnd();
    }
    pangolin::FinishFrame();
    usleep(5000);   // sleep 5 ms
  }
}
CMakeLists.txt
include_directories("/usr/include/eigen3")

find_package(Pangolin REQUIRED)
include_directories(${Pangolin_INCLUDE_DIRS})
add_executable(plotTrajectory plotTrajectory.cpp)
target_link_libraries(plotTrajectory ${Pangolin_LIBRARIES})
mkdir build && cd build
cmake ..
make
./plotTrajectory
rgbd_dataset_freiburg1_room-groundtruth.txt
包含了 旋转信息
rgbd_dataset_freiburg1_desk-groundtruth.txt
desk TXT数据连接
xwininfo
byzanz-record -x 72 -y 64 -w 1848 -h 893 -d 10 --delay=5 -c /home/xixi/myGIF/test.gif
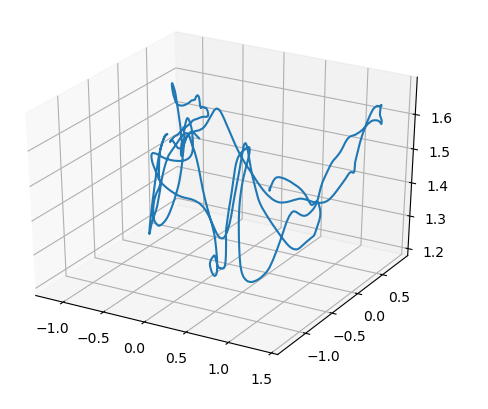
轨迹显示 Python3 仅处理了 位移信息
draw_groundtruth.py
#!/usr/bin/env python
# coding=utf-8

import numpy as np
import matplotlib.pyplot as plt
import mpl_toolkits.mplot3d

f = open("./rgbd_dataset_freiburg1_room-groundtruth.txt")
x = []
y = []
z = []
for line in f:
    if line[0] == '#': # 这里跳过了 注释行
        continue
    data = line.split()
    x.append( float(data[1] ) )
    y.append( float(data[2] ) )
    z.append( float(data[3] ) )
ax = plt.subplot( 111, projection='3d')
ax.plot(x,y,z)
plt.show()
命令行:
python3 draw_groundtruth.py
根据标准轨迹计算回环
tum.cpp
#include <pangolin/pangolin.h>
#include <Eigen/Core>
#include <Eigen/Geometry>
#include <unistd.h>
using namespace std;
using namespace Eigen;
// path to groundtruth file ***记得删掉轨迹txt的前3行注释。保证首行即为轨迹数据 ***
string groundtruth_file = "../rgbd_dataset_freiburg1_room-groundtruth.txt"; // 且.txt文件和.cpp在同一目录
// 设置检测的间隔,使得检测具有稀疏性的同时覆盖整个环境
int delta = 15; // 这里的值要是不适合,有时测不到回环
// 齐次变换矩阵差的范数,小于该值时认为位姿非常接近
double threshold = 0.4;
int main(int argc, char **argv) {
vector<Isometry3d, Eigen::aligned_allocator<Isometry3d>> poses;
vector<string> times;
ifstream fin(groundtruth_file);
if (!fin) {
cout << "cannot find trajectory file at " << groundtruth_file << endl;
return 1;
}
int num = 0;
while (!fin.eof()) {
string time_s;
double tx, ty, tz, qx, qy, qz, qw;
fin >> time_s >> tx >> ty >> tz >> qx >> qy >> qz >> qw;
Isometry3d Twr(Quaterniond(qw, qx, qy, qz));
Twr.pretranslate(Vector3d(tx, ty, tz));
// 相当于从第150个位姿开始,这是因为标准轨迹的记录早于照片拍摄(前120个位姿均无对应照片)
if (num > 120 && num % delta == 0){
times.push_back(time_s);
poses.push_back(Twr);
}
num++;
}
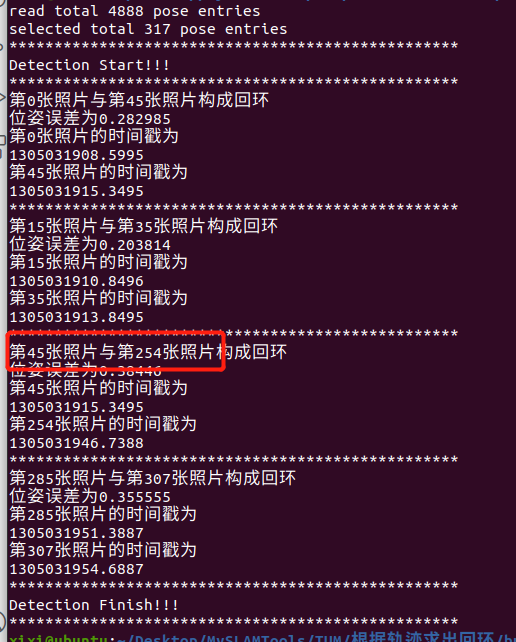
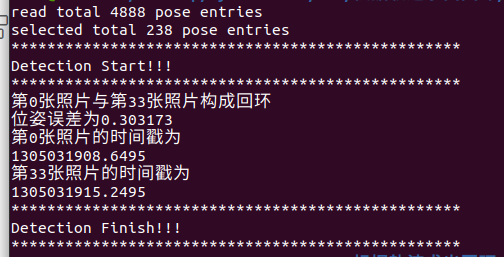
cout << "read total " << num << " pose entries" << endl;
cout << "selected total " << poses.size() << " pose entries" << endl;
//设置检测到回环后重新开始检测图片间隔数量
cout << "**************************************************" << endl;
cout << "Detection Start!!!" << endl;
cout << "**************************************************" << endl;
for (size_t i = 0 ; i < poses.size() - delta; i += delta){
for (size_t j = i + delta ; j < poses.size() ; j++){
Matrix4d Error = (poses[i].inverse() * poses[j]).matrix() - Matrix4d::Identity();
if (Error.norm() < threshold){
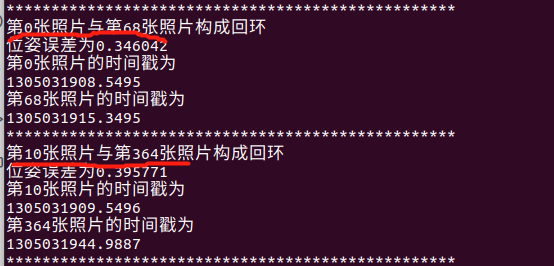
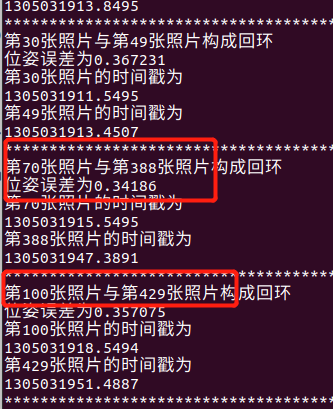
cout << "第" << i << "张照片与第" << j << "张照片构成回环" << endl;
cout << "位姿误差为" << Error.norm() << endl;
cout << "第" << i << "张照片的时间戳为" << endl << times[i] << endl;
cout << "第" << j << "张照片的时间戳为" << endl << times[j] << endl;
cout << "**************************************************" << endl;
break;
}
}
}
cout << "Detection Finish!!!" << endl;
cout << "**************************************************" << endl;
return 0;
}
CMakeLists.txt
cmake_minimum_required(VERSION 2.8)

project(tum)  # 输出文件名

include_directories("/usr/include/eigen3")
find_package(Pangolin REQUIRED)
include_directories(${Pangolin_INCLUDE_DIRS})

add_executable(tum tum.cpp)
target_link_libraries(tum ${Pangolin_LIBRARIES})
命令行窗口指令:
mkdir build  # 若是已建有,跳过这步
cd build
cmake ..
make
./tum
轨迹.txt文件里的时间和图片的不太一致,暂时不清楚怎么对应。
delta = 15:

delta = 20:
delta = 10: 获得更多组结果。
由于 图片读取间隔的原因,图片名称不完全对应。。

新建 .txt文件 touch CMakeLists.txt
在待创建.txt文件的目录下打开命令行窗口。
touch CMakeLists.txt
其它类型文件 亦可用。
CMakeLists.txt文件 包含的内容


 4480
4480


 被折叠的 条评论
为什么被折叠?
被折叠的 条评论
为什么被折叠?
 到【灌水乐园】发言


