


单细胞转录组学提供了研究组织内异质细胞群之间「配体-受体 (LR)」 相互作用的机会。然而,大多数用于推断细胞间通讯的现有工具不允许对在受体细胞中引起某些生物反应的功能性 LR 关联进行优先排序。同时,目前的工具无法识别对接收细胞的下游细胞类型的影响。
CommPath 是一个开源 R 包,去年10月发表在Computational and Structural Biotechnology Journal 「6.15IF」。CommPath 策划了一个全面的信号通路数据库来解释 LR 关联的因果,以此推断功能性 LR 交互,可用于分析和可视化单细胞转录组数据中 LR 相互作用和通路介导的细胞间通讯链。此外,CommPath 通过考虑用户定义的细胞群的上游和下游细胞来确定细胞间通信链。将 CommPath 应用于人类肝细胞癌数据集表明其能够破译复杂的 LR 相互作用模式和相关的细胞间通讯链,以及它们在疾病与体内平衡方面的变化。
后台回复「afcommpath」即可获得本文代码与数据。
项目地址:
https://github.com/yingyonghui/CommPath
使用介绍(看好注释)
r包安装及引用
CommPath包可以通过Github安装:
#devtools::install_github("yingyonghui/CommPath")
#引用R包
library(Seurat)
library(Matrix)
library(circlize)
library(ggplot2)
library(dplyr)
library(reshape2)
library(GSVA)
library(SingleR)
library(CommPath)
生成seurat对象
#设置目录并读取data文件夹下的10X文件
data_dir = paste0(getwd(),"/data")           #路径必须中文
samples=list.files(data_dir)
dir=file.path(data_dir,samples)
afdata = Read10X(data.dir = dir)
# 简单创建一个seurat对象“sample”,每个feature至少在3细胞中表达同时每个细胞中至少200个feature被检测到
sample = Seurat::CreateSeuratObject(counts = afdata,
                                     project = "SeuratObject",
                                     min.cells = 3,
                                     min.features = 200)
# 计算一下线粒体与核糖体基因的百分比,在sample@meta.data添加列名"percent.mt"与"percent.rb"
sample = Seurat::PercentageFeatureSet(sample, pattern = "^MT-", col.name = "percent.mt")
sample = Seurat::PercentageFeatureSet(sample, pattern = "^RP", col.name = "percent.rb")
# 质控
mask1 = sample$nCount_RNA >= 1000
mask2 = sample$nFeature_RNA >= 500
mask3 = sample$percent.mt <= 20
mask = mask1 & mask2 & mask3
sample = sample[, mask]
# 标准化
sample = Seurat::SCTransform(sample)
# 简单降个维
sample = Seurat::RunPCA(sample)
sample = Seurat::RunUMAP(sample, dims = 1:30)
sample = Seurat::RunTSNE(sample, dims = 1:30)
# 分一下cluster
sample = Seurat::FindNeighbors(sample, dims = 1:30)
sample = Seurat::FindClusters(sample, resolution = 1.2)
#简单注释一下
refdata=celldex::HumanPrimaryCellAtlasData()
afdata = GetAssayData(sample, slot="data")
cellpred = SingleR(test = afdata,
                    ref = refdata,
                    labels = refdata$label.main,
                    clusters = sample@meta.data$seurat_clusters)
metadata = cellpred@metadata
celltype = data.frame(ClusterID = rownames(cellpred),
                      celltype = cellpred$labels,
                      stringsAsFactors = F)
#########细胞注释后结果可视化
newLabels=celltype$celltype
names(newLabels)=levels(sample)
sample=RenameIdents(sample, newLabels)
#简单可视化一下
p1=DimPlot(sample, reduction = "pca")
p2=DimPlot(sample, reduction = "tsne")
p3=DimPlot(sample, reduction = "umap")
p1+p2+p3

#增加一列为celltype的对象
sample$celltype=Idents(sample)
准备compath的输入文件
#expr : the expression matrix of gene * cell. Expression values are required to be first normalized by the library-size and log-transformed;
#label : a vector of labels indicating identity classes of cells in the expression matrix, and the order of labels should match the order of cells in the expression matrix.
#The remaining one variable obj is the CommPath object created from expr and label and processed by CommPath standard procedures.
#This variable would be temporarily ignored since we will recreate it by the following steps.
#准备compath的输入文件,调用sample(seurat对象)中的SCT(或RNA)下的数据,用过先前课程的同学准备好把sample改成af即可
#CommPath 包含人类 (hsapiens)、小鼠 (mmusculus)、大鼠 (rnorvegicus)、斑马鱼 (drerio)、果蝇 (dmelanogaster) 和蠕虫 (celegans) 物种的 LR 和通路数据库
expr=as.matrix(sample@assays$SCT@data)
label=sample$celltype
comm.obj <- createCommPath(expr.mat = expr,
                      cell.info = label,
                      species = "hsapiens")
系列分析(看注释,不调格式了宝子):
#为表达矩阵中的每个细胞簇识别标记配体和受体(显着高表达的配体和受体)
#CommPath 提供findLRmarker以通过t.test或wilcox.test识别这些标记。
comm.obj <- findLRmarker(object = comm.obj, method = "wilcox.test")
############潜在配体-受体 (LR) 关联的统计鉴定
#########
######
###
##
# To find significant LR pairs
comm.obj <- findLRpairs(object = comm.obj,
logFC.thre = 0,
p.thre = 0.01)
#然后将具有统计学意义的LR对计数和细胞簇之间的整体相互作用强度存储在comm.obj@interact[['InteractNumer']]中
#每个LR对的详细信息存储在comm.obj@interact[[' InteractGene']]
#可以通过 circos plot 可视化所有交互
# To show the counts of LR associations among all clusters
# Here we set the parameter "filter" as FALSE, which means that those LR interactions are identified only based on their expression profiles, not filtered by pathways in the receiver cells (as described in the later sections)
#线的方向表示从配体到受体的关联,线的宽度表示簇中 LR 对的计数
pdf('01.circosPlot.count.nonfiltered.pdf',height=6,width=6)
circosPlot(object = comm.obj, filter=FALSE)
dev.off()
# To show the overall interaction intensity of LR interactions among all clusters
#线条的宽度代表集群之间的整体交互强度
pdf('01.circosPlot.intensity.nonfiltered.pdf',height=6,width=6)
circosPlot(object = comm.obj, plot="intensity", filter=FALSE)
dev.off()
############通路富集分析
#########
######
###
##
#CommPath 进行通路分析以确定失调的信号通路,其中包含每个簇的标记配体和受体
# To find pathways of which the genesets show overlap with the marker ligands and receptors
# CommPath provides pathway annotations from KEGG pathways, WikiPathways, reactome pathways, and GO terms
# Here we take the KEGG pathways as an example
#显示与标记配体和受体重叠的基因集存储在comm.obj@pathway[['pathwayLR']]中
comm.obj <- findLRpath(object = comm.obj, category = "kegg")
#然后对通路进行评分以测量每个细胞中每个通路的激活水平
# To compute pathway activation score by the gsva algorithm or in an average manner
# For more information about the gsva algorithm, see the GSVA package (PMID23323831)
comm.obj <- scorePath(object = comm.obj, method = "gsva", min.size = 10, parallel.sz = 4)
#CommPath提供diffAllPath对每个簇进行通路差异激活分析,找到每个通路中的受体和配体
# To get significantly up-regulated pathways in each cluster
#结果变量acti.path.dat中存储了几列
#mean.diff 、mean.1、mean.2、t、df、P.val和P.val.adj 列显示统计结果;description列显示路径名称
#ligand.in.path和receptor.in.path列显示当前cluster表达的、包含在当前通路中的标记配体和受体
acti.path.dat <- diffAllPath(object = comm.obj, only.posi = TRUE, only.sig = TRUE)
head(acti.path.dat)
#保存结果
write.csv(acti.path.dat,"02.acti.path.dat.csv")
#然后我们使用pathHeatmap来呈现每个集群的那些差异激活途径的热图
pdf('02.pathHeatmap.pdf',height=10,width=7)
pathHeatmap(object = comm.obj,
acti.path.dat = acti.path.dat,
top.n.pathway = 10,
cell.aver = TRUE)
dev.off()
#筛选与激活通路相关的 LR 相互作用
#对于每个细胞簇,CommPath 识别激活通路中涉及的 LR 关联以筛选功能性 LR 相互作用
#这些通路过滤的相互作用被认为更有可能触发受体细胞中相应的分子通路
# To screen functional LR interactions
comm.obj <- filterLR(object = comm.obj, acti.path.dat = acti.path.dat)
#然后将过滤后的显着LR对的计数和相应的细胞簇间的整体相互作用强度存储在comm.obj@interact.filter[['InteractNumer']]中
#每个LR对的详细信息存储在comm.obj@interact.filter[['InteractGene']]
#接下来通过去除那些只包含特定标记配体的途径来过滤途径,这些配体不会触发下游簇中的任何途径
acti.path.filtered.dat <- filterPath(object = comm.obj, acti.path.dat = acti.path.dat)
# To show the counts of filtered LR associations among all clusters
pdf('03.circosPlot.count.filtered.pdf',height=6,width=6)
circosPlot(object = comm.obj, filter=TRUE)
dev.off()
# To show the overall interaction intensity of filtered LR interactions among all clusters
pdf('03.circosPlot.intensity.filtered.pdf',height=6,width=6)
circosPlot(object = comm.obj, plot="intensity", filter=TRUE)
dev.off()
#可以突出显示特定集群的交互,这里以单核细胞为例,上同
select.ident = 'Monocyte'
pdf('04.circosPlot.Monocyte.count.filtered.pdf',height=6,width=6)
circosPlot(object = comm.obj, select.ident = select.ident, filter=TRUE)
dev.off()
##########对于感兴趣的特定簇,CommPath 提供函数findLigand ( findReceptor ) 来查找上游(下游)簇以及与特定簇相互作用的相应配体(受体)
#########
######
###
##
# To find upstream clusters and ligands for the selected cluster and receptor
#设定ident与受体(可以根据acti.path.dat.csv选择)
select.ident = "Monocyte"
select.receptor = "CXCR4"
ident.up.dat <- findLigand(object = comm.obj,
select.ident = select.ident,
select.receptor = select.receptor)
head(ident.up.dat)
# To find downstream clusters and receptors for the selected cluster and ligand
#设定ident与配体(可以根据acti.path.dat.csv选择)
select.ident = "Monocyte"
select.ligand = "TNF"
ident.down.dat <- findReceptor(object = comm.obj,
select.ident = select.ident,
select.ligand = select.ligand)
head(ident.down.dat)
#变量ident.up.dat/ident.down.dat中存储了 7 列:
#列cell.from,cell.to,ligand,receptor显示上游和下游簇以及 LR 关联的特定配体和受体;
#列log2FC.LR、P.val.LR、P.val.adj.LR显示相互作用强度(通过配体和受体的log2FC的乘积测量)以及LR 对假设检验的相应原始和调整P值。
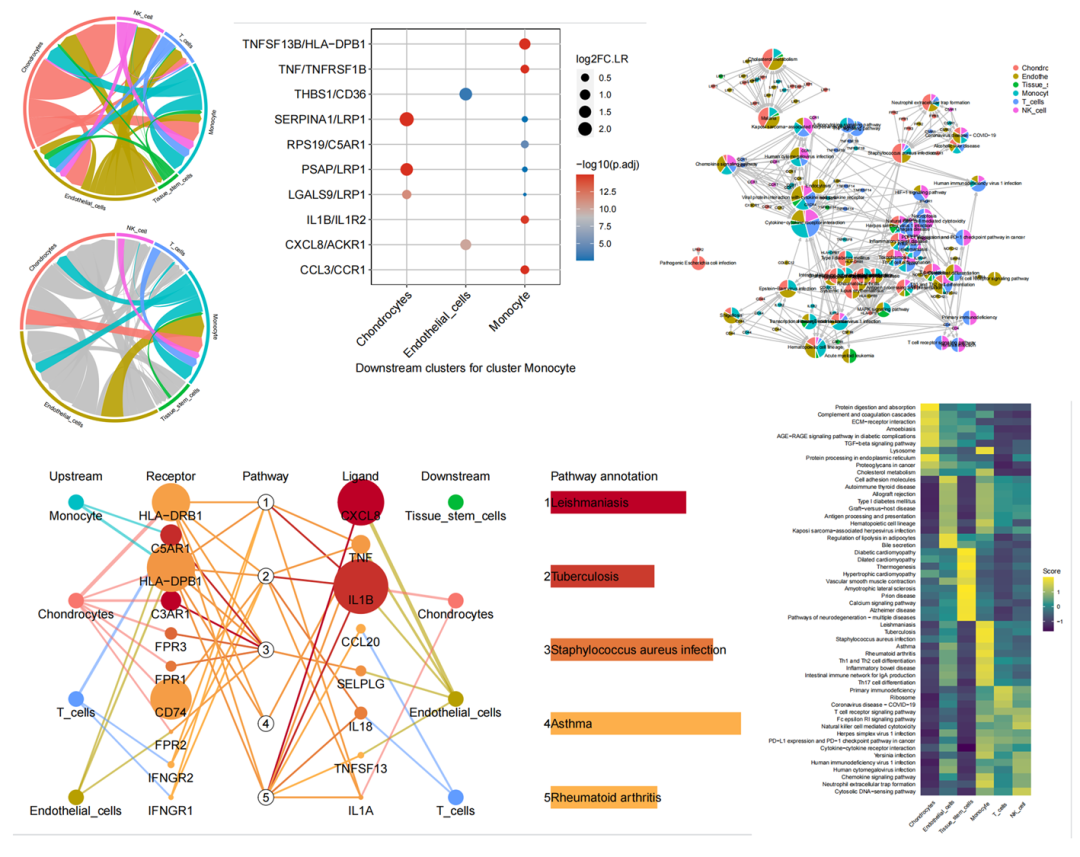
#####对于感兴趣的簇,CommPath 还提供点图来研究其释放特定配体的上游簇及其表达特定受体的下游簇:
# To investigate the upstream clusters which release ligands to the selected cluster
pdf('05.dotPlot.ligand.Monocyte.pdf',height=5,width=10)
dotPlot.LR(object = comm.obj, receptor.ident = select.ident)
dev.off()
# To investigate the downstream clusters which express receptors for the selected cluster
pdf('05.dotPlot.receptor.Monocyte.pdf',height=5,width=10.5)
dotPlot.LR(object = comm.obj, ligand.ident = select.ident)
dev.off()
#########然后 CommPath 提供网络图形工具来可视化路径和相关的功能 LR 交互
# First to integrate the statistics of filtered activated pathways and their associated LR interactions
comm.obj <- pathNet(object = comm.obj, acti.path.filtered.dat = acti.path.filtered.dat)
kup=comm.obj@pathway.net$upstream
kup$type=rep("upstream",length(rownames(kup)))
kdown=comm.obj@pathway.net$downstream
kdown$type=rep("downstream",length(rownames(kdown)))
write.csv(kup,"06.upstream.path.csv")
write.csv(kdown,"06.downstream.path.csv")
# To visualize the pathways and the associated upstream LR interactions in a network plot
pdf('06.pathNet.upstream.Monocyte.1.pdf',width=6,heigh=6)
set.seed(1234)
pathNetPlot(object = comm.obj, select.ident = select.ident, plot = "upstream",
layout = 'layout.davidson.harel',
vert.size.LR = 3, vert.size.path.adj = 10,
LR.label = 'R', vertex.label.cex.LR=0.25, vertex.label.cex.path=0.3)
dev.off()
#在上面的网络图中,饼图表示所选细胞(此处为内皮细胞)中的激活通路
#散点表示 LR 对,其中受体包含在相关通路的基因集中。
#散点的颜色表示释放相应配体的上游簇
#饼图的大小表示它们的总入度,比例表示来自不同上游集群的入度
#该图将提供许多重要和详细的信号通路信息以及通信链上的相关 LR 交互
#为了确保灵活性和可解释性,CommPath 函数提供了多个可选参数
#用于选择和限制要描绘的路径和 LR 对
#To select the top 5 significantly upregulated pathways in Monocyte cells
pdf('06.pathNet.upstream.Monocyte.top5.pdf',width=6,heigh=6)
set.seed(1234)
pathNetPlot(object = comm.obj, select.ident = select.ident, plot = "upstream",
top.n.path=5,
layout = 'layout.davidson.harel',
vert.size.LR = 3, vert.size.path.adj = 10,
LR.label = 'R', vertex.label.cex.LR=0.25, vertex.label.cex.path=0.3)
dev.off()
#To select and show pathways of interest in the diagram by names of pathways directly
pdf('06.pathNet.upstream.Monocyte.selectpathway.pdf',width=6,heigh=6)
set.seed(1234)
pathNetPlot(object = comm.obj, select.ident = select.ident, plot = "upstream",#限定upstream
select.path = c("Cholesterol metabolism", "Herpes simplex virus 1 infection", "Th1 and Th2 cell differentiation", "Th17 cell differentiation", "Neutrophil extracellular trap formation"), #根据upstream.path.csv结果选择
layout = 'layout.davidson.harel',
vert.size.LR = 3, vert.size.path.adj = 10,
LR.label = 'R', vertex.label.cex.LR=0.25, vertex.label.cex.path=0.3)
dev.off()
# Also to visualize the pathways and the associated downstream LR interactions in a network plot
#上述网络图的图例与前面的网络图的图例大体相同,不同之处在于:
#(i)散点表示LR对,其配体包含在相关通路的基因集中;(ii) 散点的颜色表示表达相应受体的下游簇;
#(iii) 饼图的大小表示它们的总出度,比例表示对不同下游集群的出度
pdf('06.pathNet.downstream.Monocyte.pdf',width=6,heigh=6)
set.seed(1234)
pathNetPlot(object = comm.obj, select.ident = select.ident, plot = "downstream", #downstream
layout = 'layout.davidson.harel',
vert.size.LR = 3, vert.size.path.adj = 10,
LR.label = 'L', vertex.label.cex.LR=0.25, vertex.label.cex.path=0.3)
dev.off()
###CommPath 还提供点图来调查所选集群中特定路径中涉及的上游和下游 LR 对
pathway = "Th1 and Th2 cell differentiation"
# To visualize the upstream LR pairs of which the receptors are expressed by Monocyte cells and are included in the pathway
pdf('07.dotPlot.THpathway.upstream.Monocyte.pdf',height=5,width=7.5)
dotPlot.pathway(object = comm.obj, pathway = pathway, acti.path.filtered.dat = acti.path.filtered.dat, receptor.ident = select.ident, top.n.inter = 10)
dev.off()
##########通路介导的细胞间通讯链的鉴定
#########
######
###
##
#通路介导的细胞间通讯链的鉴定
#对于特定的细胞群,此处命名为 B 以进行演示,CommPath 识别上游群 A 向 B 发送信号,下游群 C 从 B 接收信号,以及 B 中显着激活的通路以调解 ABC 通信链。
#更准确地说,通过上述 LR 和通路分析,CommPath 能够识别 A 和 B 之间的 LR 对、B 和 C 之间的 LR 对以及 B 中激活的通路。
#然后 CommPath 筛选 B 中涉及两个受体相互作用的通路与 A 和配体与 C 相互作用。
# To investigate the activated patways and the associated receptors for a specific cluster
select.ident = 'Monocyte'
pdf('08.pathPlot.Monocyte.pdf',height=6,width=10)
pathPlot(object = comm.obj,
select.ident = select.ident,
acti.path.dat = acti.path.filtered.dat)
dev.off()
#在上面的线图中, Upstream cluster 和Receptor之间的线宽代表了Upstream cluster 和 Monocyte cells 通过特定受体的整体相互作用强度;
#受体列中点的大小和颜色代表差异表达测试的平均log2FC和-log10(P),将内皮细胞中的受体表达与所有其他细胞中的受体表达进行比较;
#Pathway 注释列中条形的长度和颜色表示平均差异,-log10(P)形成差异激活检验,将内皮细胞中的通路分数与所有其他细胞中的通路分数进行比较。
# To select self-defind cluster for the central cell population
# And select pathways of interest by names
# Also select the top N receptors by interaction intensity
select.ident = 'Monocyte'
pdf('08.pathPlot.Monocyte.selectpathway.pdf',height=4,width=10)
pathPlot(object = comm.obj,
select.ident = select.ident,
up.ident = c("Monocyte","Chondrocytes","T_cells","Endothelial_cells"),
select.path = c("PI3K-Akt signaling pathway", "MAPK signaling pathway", "Th1 and Th2 cell differentiation", "Th17 cell differentiation", "Neutrophil extracellular trap formation"),
top.n.receptor = 5,
acti.path.dat = acti.path.filtered.dat)
dev.off()
# To investigate the activated patways, the associated receptors and ligands for a specific cluster
pdf('08.pathChainPlot.Monocyte.pdf',height=6,width=14)
pathChainPlot(object = comm.obj,
select.ident = select.ident,
up.ident = c("Monocyte","Chondrocytes","T_cells","Endothelial_cells"),
down.ident = c("Tissue_stem_cells","Chondrocytes","NK_cells","Endothelial_cells","T_cells"),
#select.path = c("JAK-STAT signaling pathway", "MAPK signaling pathway", "Ras signaling pathway", "PI3K-Akt signaling pathway", "AMPK signaling pathway"),
top.n.path = 5,
acti.path.dat = acti.path.filtered.dat)
dev.off()
#两种情况下细胞间通讯的比较
#CommPath 还提供有用的实用程序来比较两种情况(例如疾病和控制)之间的细胞间通信
#见github文档:https://github.com/yingyonghui/CommPath
部分图片汇总
就分享到这了
试试吧


 787
787

 被折叠的 条评论
为什么被折叠?
被折叠的 条评论
为什么被折叠?
 到【灌水乐园】发言


