


 本文介绍了如何将RGB图像的三个通道分别进行DCT变换,通过设置阈值过滤低频信息,然后进行逆DCT并合并,展示了图像处理中的一个重要技术应用。
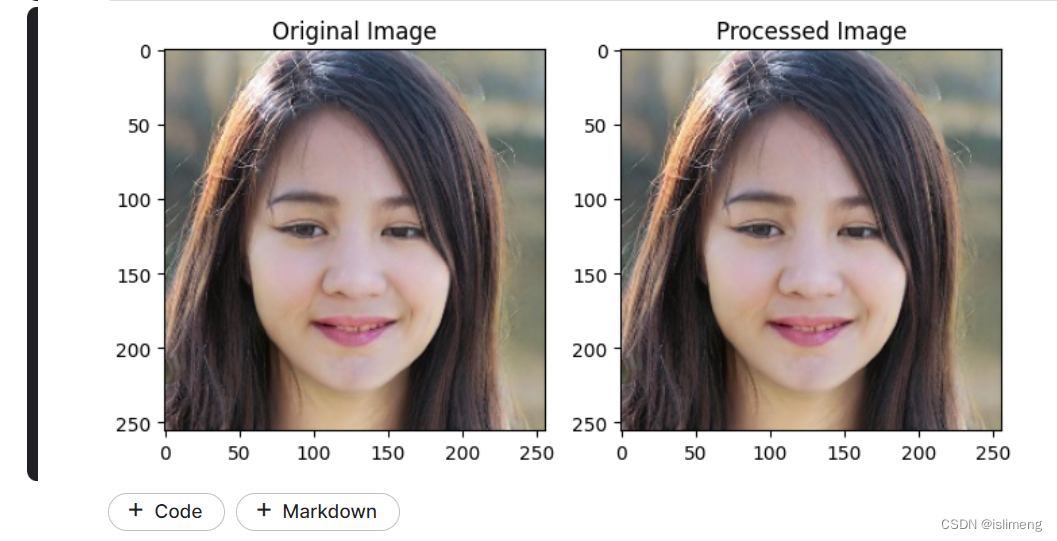
将RGB图像分成三个通道,然后对每个通道进行DCT变换,过滤掉低频信息后再进行逆DCT变换,最后重新合并三个通道以生成处理后的图像。
阈值的选择对于保留哪些频域信息至关重要,它会影响到最终图像的质量和细节!!!
import numpy as np
from scipy.fft import dct, idct
import matplotlib.pyplot as plt
from PIL import Image

# 读取RGB图像
image_path = 'path/to/your/image.jpg'  # 请将路径替换为你自己图像的路径
image = Image.open(image_path)
image_array = np.array(image)

# 将图像转换为浮点数,并分解为RGB三个通道
image_float = image_array.astype(float)
red_channel = image_float[:, :, 0]
green_channel = image_float[:, :, 1]
blue_channel = image_float[:, :, 2]

# 对每个通道进行DCT变换
dct_red = dct(dct(red_channel, axis=0, norm='ortho'), axis=1, norm='ortho')
dct_green = dct(dct(green_channel, axis=0, norm='ortho'), axis=1, norm='ortho')
dct_blue = dct(dct(blue_channel, axis=0, norm='ortho'), axis=1, norm='ortho')

# 设定一个阈值,过滤掉低频信息(这里示例阈值为0.1)
threshold = 0.1
dct_red_filtered = dct_red * (np.abs(dct_red) > threshold)
dct_green_filtered = dct_green * (np.abs(dct_green) > threshold)
dct_blue_filtered = dct_blue * (np.abs(dct_blue) > threshold)

# 对过滤后的DCT系数进行逆DCT变换
idct_red = idct(idct(dct_red_filtered, axis=0, norm='ortho'), axis=1, norm='ortho')
idct_green = idct(idct(dct_green_filtered, axis=0, norm='ortho'), axis=1, norm='ortho')
idct_blue = idct(idct(dct_blue_filtered, axis=0, norm='ortho'), axis=1, norm='ortho')

# 合并三个通道并将浮点数组转换回整数形式
image_result = np.stack((idct_red, idct_green, idct_blue), axis=2).astype(np.uint8)

# 显示原始图像和处理后的图像
plt.figure(figsize=(8, 4))

plt.subplot(1, 2, 1)
plt.title('Original Image')
plt.imshow(image)

plt.subplot(1, 2, 2)
plt.title('Processed Image')
plt.imshow(image_result)
plt.show()


 1770
1770

 被折叠的 条评论
为什么被折叠?
被折叠的 条评论
为什么被折叠?
 到【灌水乐园】发言


