


SingleR是一个用于对单细胞RNA-seq测序(scRNA-seq)数据进行细胞类型自动注释的R包(Aran et al.2019)。依据已知类型标签的细胞样本作为参考数据集,对测试数据集中的细胞进行标记注释。
一 内置数据库
使用SingleR的最简单方法是使用内置参考对细胞进行注释。singleR自带的7个参考数据集,其中5个是人类数据,2个是小鼠的数据:
BlueprintEncodeData Blueprint (Martens and Stunnenberg 2013) and Encode (The ENCODE Project Consortium 2012) (人)
DatabaseImmuneCellExpressionData The Database for Immune Cell Expression(/eQTLs/Epigenomics)(Schmiedel et al. 2018)(人)
HumanPrimaryCellAtlasData the Human Primary Cell Atlas (Mabbott et al. 2013)(人)
MonacoImmuneData, Monaco Immune Cell Data - GSE107011 (Monaco et al. 2019)(人)
NovershternHematopoieticData Novershtern Hematopoietic Cell Data - GSE24759(人)
ImmGenData the murine ImmGen (Heng et al. 2008) (鼠)
MouseRNAseqData a collection of mouse data sets downloaded from GEO (Benayoun et al. 2019).鼠)
二 数据库,R包
2.1 singleR包安装
if(!requireNamespace("BiocManager", quietly =TRUE))
 install.packages("BiocManager")
BiocManager::install("SingleR")
2.2 加载数据集,数据
library(SingleR)
library(celldex)
library(Seurat)
library(pheatmap)
##下载注释数据库
hpca.se <- HumanPrimaryCellAtlasData()
bpe.se<- BlueprintEncodeData()
2.3 查看seurat结果
使用Seurat包pbmc的结果,在Seurat标准流程介绍过。
(1)查看seuret聚类结果
load("pbmc3k_final.rds.RData")
pbmc

meta=pbmc@meta.data #pbmc的meta文件,包含了seurat的聚类结果
head(meta)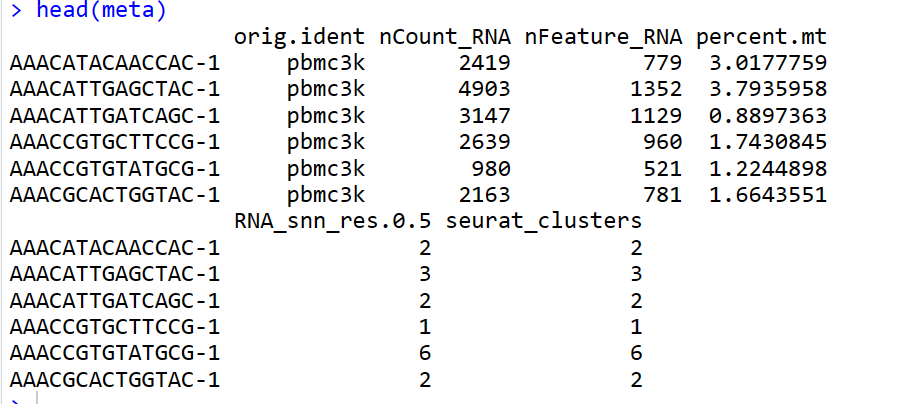
(2)查看umap和tsne图
plot1 <- DimPlot(pbmc, reduction = "umap", label = TRUE)

plot2<-DimPlot(pbmc, reduction = "tsne",
               label = TRUE)
plot1 + plot2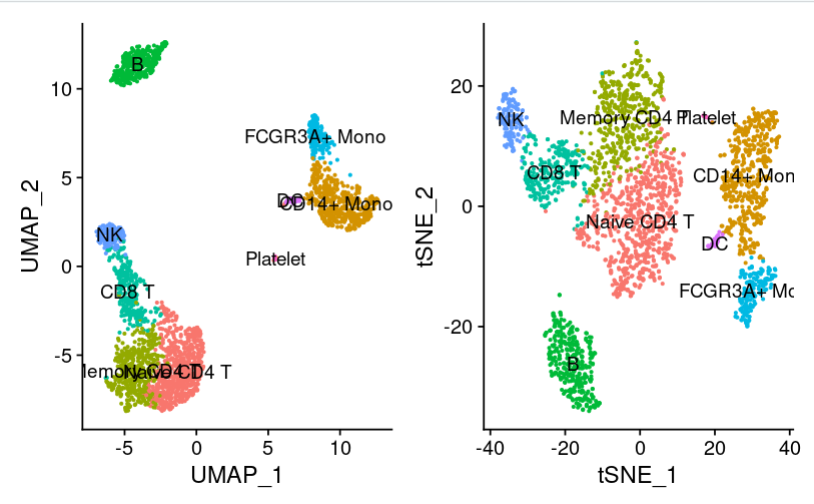
三 singleR注释
3.1 singleR使用内置数据集注释
#进行singleR注释
pbmc_for_SingleR <- GetAssayData(pbmc, slot="data") ##获取标准化矩阵
pbmc.hesc <- SingleR(test = pbmc_for_SingleR, ref = hpca.se, labels = hpca.se$label.main) #
pbmc.hesc
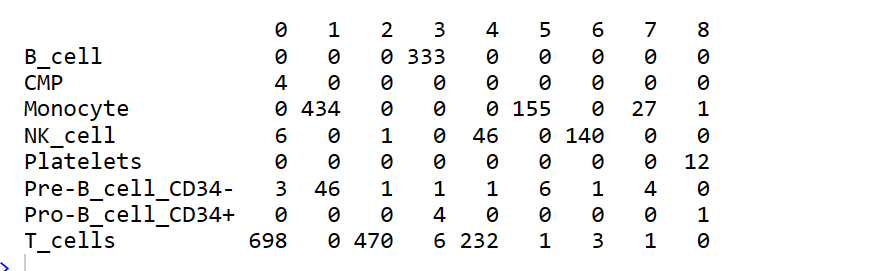
#seurat 和 singleR的table表
table(pbmc.hesc$labels,meta$seurat_clusters)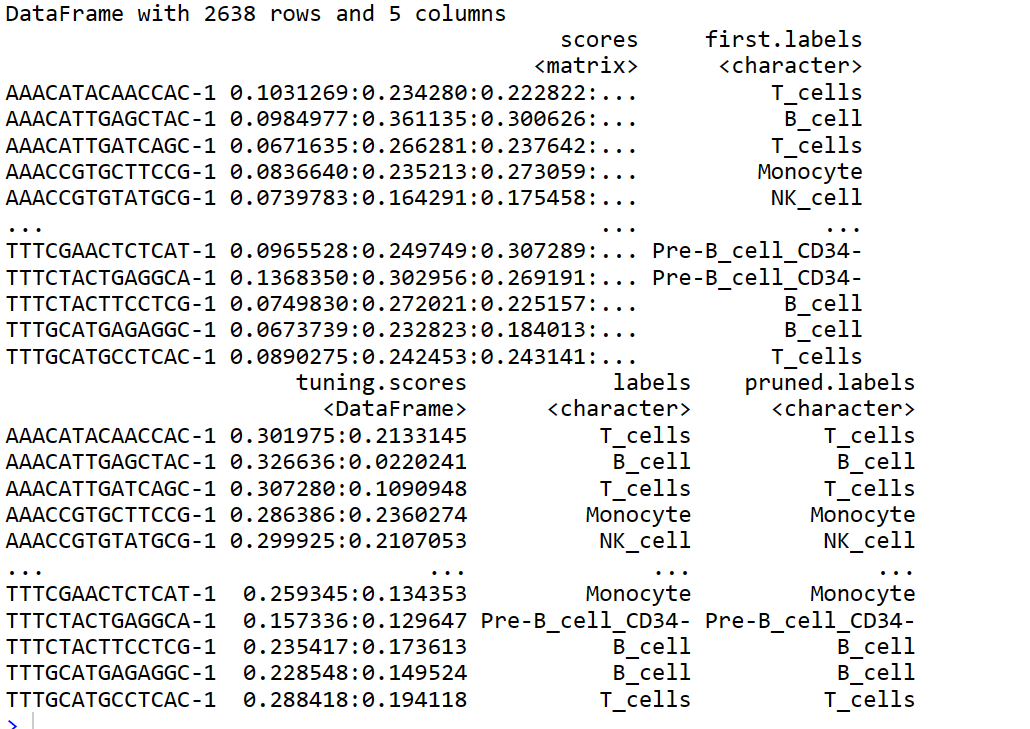
3.2 绘制umap/tsne图
pbmc@meta.data$labels <-pbmc.hesc$labels

print(DimPlot(pbmc, group.by = c("seurat_clusters", "labels"),reduction = "umap"))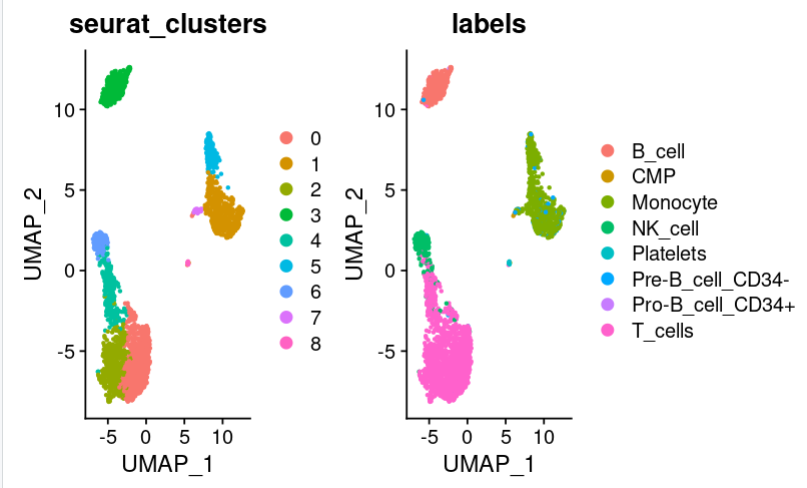
3.3 使用多个数据库注释
使用BP和HPCA两个数据库综合注释,使用list函数读入多个数据库
pbmc3 <- pbmc
pbmc3.hesc <- SingleR(test = pbmc_for_SingleR, ref = list(BP=bpe.se, HPCA=hpca.se), labels = list(bpe.se$label.main, hpca.se$label.main))
table(pbmc3.hesc$labels,meta$seurat_clusters)
pbmc3@meta.data$labels <-pbmc3.hesc$labels
print(DimPlot(pbmc3, group.by = c("seurat_clusters", "labels"),reduction = "umap"))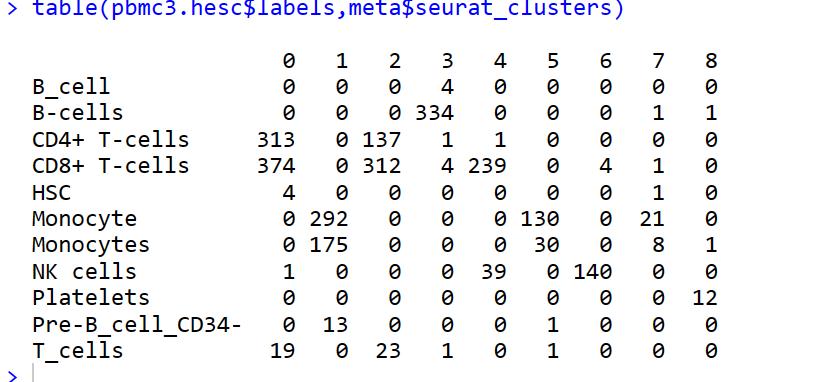
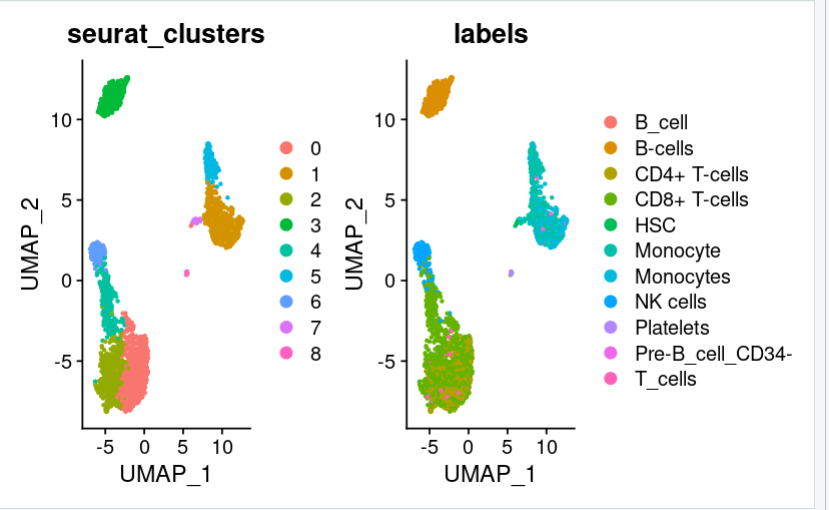
可以看到多了一些hpca没有注视到的细胞类型。
四 注释结果诊断
4.1 基于scores within cells
print(plotScoreHeatmap(pbmc.hesc))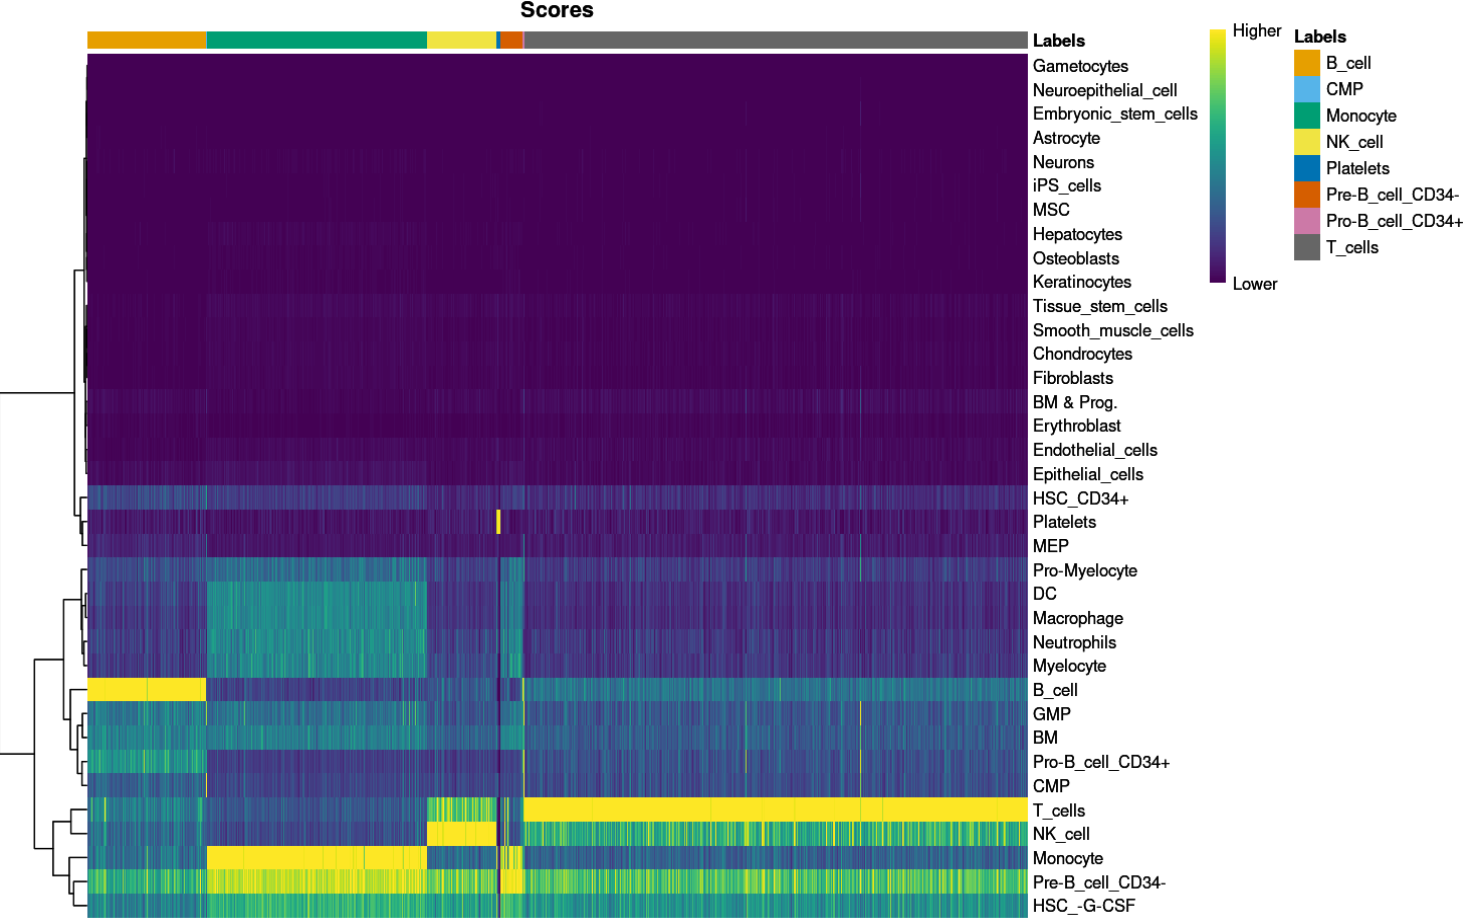
细胞在一个标签的得分很显著的高于其他标签得分,注释结果比较清晰。
4.2 基于 per-cell “deltas”诊断
plotDeltaDistribution(pbmc.hesc, ncol = 3)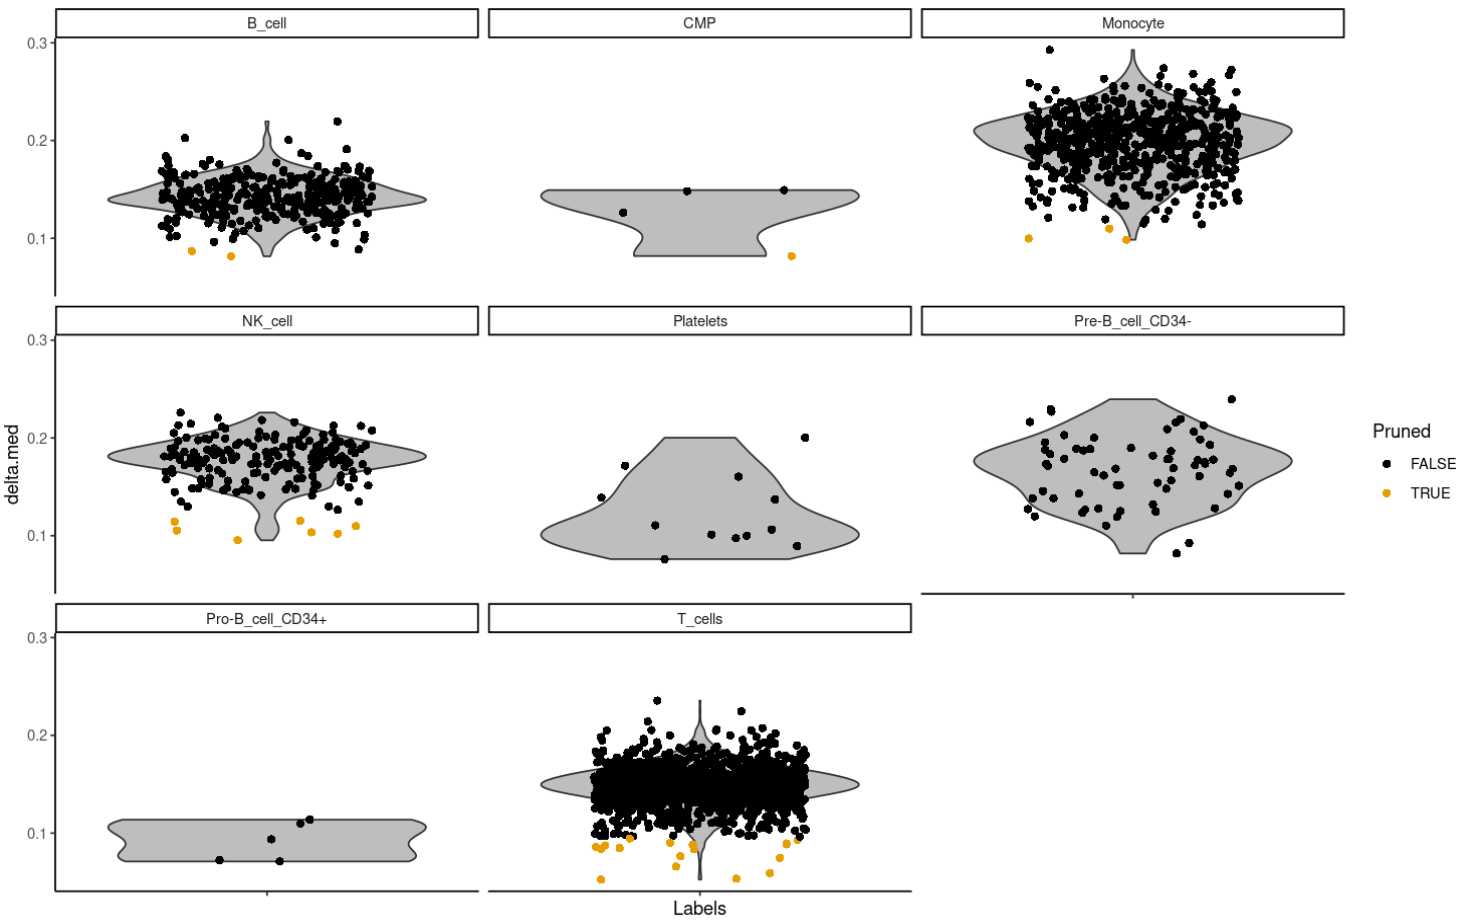
Delta值低,说明注释结果不是很明确。
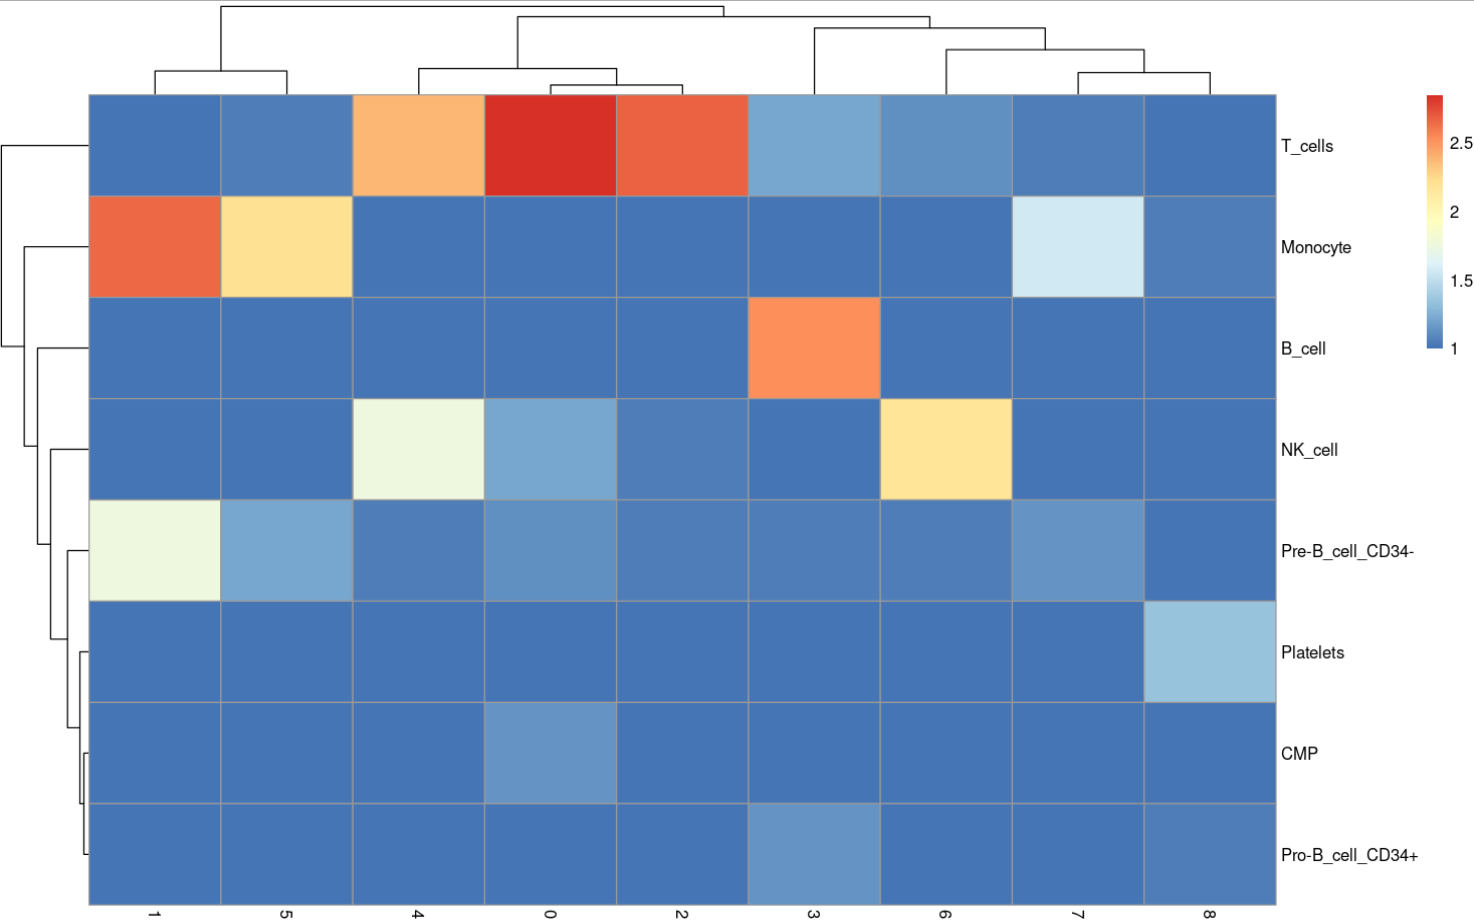
4.3 与cluster结果比较
tab <- table(label = pbmc.hesc$labels,
             cluster = meta$seurat_clusters)

pheatmap(log10(tab + 10))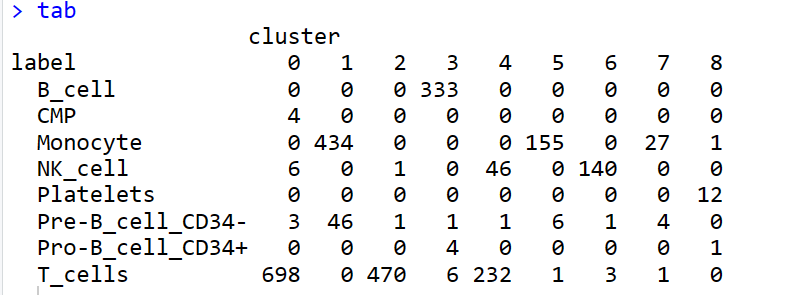


 650
650

 被折叠的 条评论
为什么被折叠?
被折叠的 条评论
为什么被折叠?
 到【灌水乐园】发言


