


1.假如已将数据集进行词频统计保存咋txt文件中。如下形式:
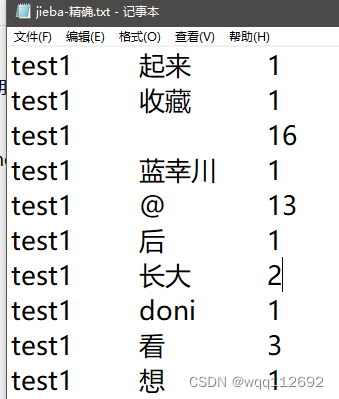
2.将txt文件中的数据按照第一例的不同名字分成不同的CSV文件。
#import jieba
import csv

def split_txt_to_csv(txt_file):
    with open(txt_file, 'r', encoding='utf-8') as file:
        lines = file.readlines()

    data = {}
    for line in lines:
        line = line.strip()
        if line:
            values = line.split('\t')
            key = values[0]

            if key not in data:
                data[key] = []

            data[key].append(values)

    for key, values in data.items():
        csv_file = key + '.csv'
        with open(csv_file, 'w', newline='', encoding='utf-8') as file:
            writer = csv.writer(file)
            writer.writerows(values)

        print(f"{csv_file} created.")

# Example usage
txt_file = 'jieba-精确.txt'
split_txt_to_csv(txt_file)

运行结果如下图所示:
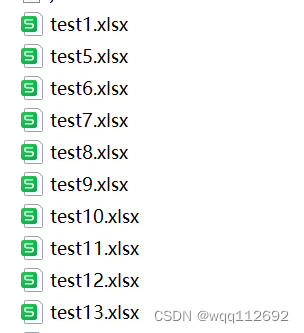
3.将txt文件中的数据按照第一例的不同名字分成不同的xlsx文件。
import pandas as pd

# 读取txt文件并将其转换为DataFrame格式
df = pd.read_csv('jieba-精确.txt', sep='\t', header=None, names=['name','word', 'frequency'])

# 根据第一列的不同将数据分组
grouped = df.groupby('name')

# 将分组后的数据写入不同的Excel文件中
for name, group in grouped:
    group.drop('name', axis=1, inplace=True)  # 删除第一列
    group.to_excel('{}.xlsx'.format(name), index=False, header=['word', 'frequency'])
结果如下图:
4.最后进行词云可视化
file = 'test1.xlsx'
# 将词频Excel文件读取为字典
wb = load_workbook(file)
ws = wb.active
wordFreq = {}
for i in range(2, ws.max_row + 1):
    word = ws["A" + str(i)].value
    freq = ws["B" + str(i)].value
    wordFreq[word] = freq

# 定义词云样式
wc = wordcloud.WordCloud(
    font_path='C:/Windows/Fonts/simhei.ttf',  # 设置字体
    #mask=maskImage,  # 设置背景图
    max_words=500,  # 最多显示词数
    max_font_size=100)  # 字号最大值

# 生成词云图
wc.generate_from_frequencies(wordFreq)  # 从字典生成词云
# 保存图片到指定文件夹
#wc.to_file("D:\program files (x86)\degree-thing\课程学习\研一上")
# 在notebook中显示词云图
plt.imshow(wc)  # 显示词云
plt.axis('off')  # 关闭坐标轴
plt.show()  # 显示图像
结果如下:

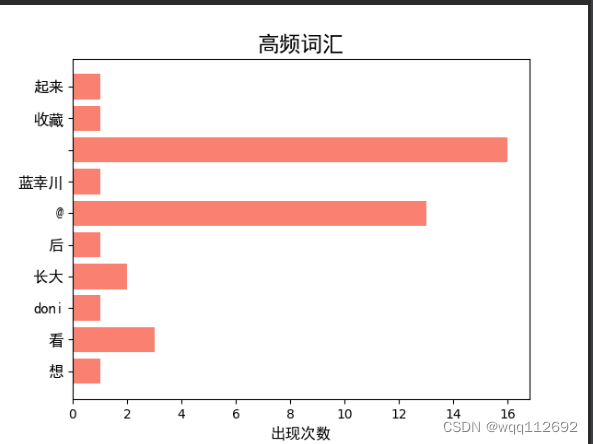
5.利用matplotlib库将钱10个高频词汇以及出现的次数进行条形统计图的可视化。
import matplotlib.pyplot as plt
from matplotlib.font_manager import *
import openpyxl

fig, ax = plt.subplots()
myfont = FontProperties(fname=r'C:\Windows\Fonts\simhei.ttf',size=12)
N = 10
workbook = openpyxl.load_workbook('test1.xlsx')
sheet = workbook.active
words = []
counts = []
for row in sheet.iter_rows(min_row=2,values_only=True):
    words.append(row[0])
    counts.append(int(row[1]))

colors = ['#FA8072']

#绘制前十条数据(N=10)
rects = ax.barh(words[:N], counts[:N], align='center', color=colors)
ax.set_yticklabels(words[:N],fontproperties=myfont)
ax.invert_yaxis()
ax.set_title('高频词汇',fontproperties=myfont, fontsize=17)
ax.set_xlabel(u"出现次数",fontproperties=myfont)
plt.show()
结果如下:
注意1:
若在运行代码过程中,出现某一个包未安装,可直接pycharm的Terminal控制台中输入命令:
pip install (包名)
即可安装任何缺失的第三方包护着库。
注意2:
若在使用pip 进行第三方包安装过程中出现pip版本太低,需要更新的问题。可以使用命令:
python -m pip install --upgrade pip -i https://pypi.douban.com/simple
进行pip版本升级,后面的https://pypi.douban.com/simple是镜像下载链接,使用将向下载和升级,速度会更快。


 4521
4521

 被折叠的 条评论
为什么被折叠?
被折叠的 条评论
为什么被折叠?
 到【灌水乐园】发言


