


ChIP-seq
What is ChIP-Seq? Chromatin Immunoprecipitation coupled with tiling microarrays or Next-Generation Sequencing NGS. Main goal is to understand genome-wide protein-DNA interaction. Determine location of proteins bound to DNA. ChIP-seq is useful for detecting transcription factor binding sites and histone modification patterns. Common questions we have are which genes is this TF regulating and how do histone modifications affect expression.
ChIP-seq workflow:
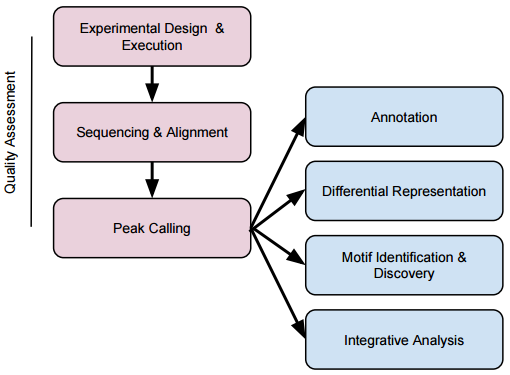
sequencing & alignment:
Sequencing depth rules of thumb: > 10M reads for narrow peaks, > 20M for broad peaks
Long & paired end useful but not essential – alignment in ambiguous regions
Basic aligners generally adequate, e.g., no need to align splice junctions
peak calling:
Very large number of peak calling programs; some specialized for e.g., narrow vs. broad peaks. Commmonly used: MACS, PeakSeq, CisGenome, …
Model based analysis of ChIP-Seq (MACS) is a ‘peak calling’ method for identifying genomic binding sites from read count data. It was developed in X. Shirley Liu’s lab at Dana Farber Cancer Institute. It uses condent peaks to model shift size. Dynamic Poisson distribution to model the tag distribution along the genome. There are several features available in MACS to conduct ChIP-Seq analysis:
- call peak: Call peaks from alignment results.
- bdgpeakcall: Call peaks from bedGraph output.
- bdgbroadcall: Call broad peaks from bedGraph output.
- bdgcmp: Deduct noise by comparing two signal tracks in bedGraph.
- bdgdi : Dierential peak detection based on paired four bed graph les.
- flterdup : Remove duplicate reads at the same position then convert acceptable format to BED format.
- predicted: Predict d or fragment size from alignment results.
- pileup: Pileup aligned reads with a given extension size fragment size or d in MACS language.
- randsample: Randomly sample number/percentage of total reads.
- refine peak : Experimental Take raw reads alignment rene peak summits and give scores measuring balance of forward- backward tags. Inspired by SPP.
An example of using MACS for ChIP-Seq Data ChIP-Seq data from an experiment investigating the circadian recruitment of histone deacetylase 3 HDAC3 and its eect on liver metabolism.
- Filter duplicates: remove duplicates to mitigate amplication bias:
srun -n 1 --pty -p interact --mem2000 macs2 filterdup -i /n/stat115/labs/6/HDAC3.bam -g mm --keep-dup 1 -o HDAC3.bed
srun -n 1 --pty -p interact --mem2000 macs2 filterdup -i /n/stat115/labs/6/control.bam-g mm --keep-dup 1 -o control.bed  #control
-i Intput file
-g Genome size
--keep-dup Duplicates to keep
-o Output file.- Sample down: Imbalance in read counts between treatment and control can bias results. To sample down the condition that has more reads:
srun -n 1 --pty -p interact --mem2000 macs2 randsample -t control.bed -n 8757629 -o controlsamp.bed

-t Intput file
-n Number to sample
-o Output file
Installing Loading MACS
1. Look at install page from Tao Liu’s GitHub page
2. You can import it as a regular python package OR load it in a cluster environment.
Example Cont’d Call peaks:
srun -n 1 -t 60 --pty -p interact --mem2000 macs2 callpeak -t HDAC3.bed -c controlsamp.bed -f BED -g mm -n HDAC3peaks

-t Treatment file
-c Control file
-f File format
-n Output prefix
Quality Assessment: ChIPQC
Inputs: BAM files (raw data) and BED files (called peaks)
experiment <- ChIPQC(samples)
ChIPQCreport(experiment)
Output: HTML report
Downstream Analysis:
- Annotation: what genes are my peaks near?
- Differential representation: which peaks are over- or under-represented in treatment 1, compared to treatment 2?
- Motif identification (peaks over known motifs?) and discovery
- Integrative analysis, e.g., assoication of regulatory elements and expression
Annotation: ChIPpeakAnno:
Inputs I
Peaks: RangedData (GRanges-like) peaks, e.g., from rtracklayer::import() BED files
Annotation: RangedData representing gene boundaries, or query to biomaRt library(ChIPpeakAnno)
annotated <- annotatePeakInBatch(peaks, AnnotationData=annotation) Output: RangedData with annotations about near-by peaks.
Differential Representation: DiffBind
Inputs: called peaks and raw BED or BAM files
library(DiffBind)
tamoxifen = dba(sampleSheet="tamoxifen.csv")
tamoxifen = dba.count(tamoxifen)
tamoxifen = dba.contrast(tamoxifen, categories=DBA_CONDITION)
tamoxifen = dba.analyze(tamoxifen) tamoxifen.DB = dba.report(tamoxifen)
Outputs: diagnositics, visiualizations, and ‘top table’ of differentially expressed regions.
ChIP-seq in Bioconductor: packages
- Quality assessment – ChIPQC;
- (Peak calling) – chipseq, PICS, triform, ChIPseqR, iSeq, …
- Single sample summary / exploration – ChIPpeekAnno, chIPseeker
- Differential representation – DiffBind, MMDiff , …
- Motifs – MotifDb, TFBSTools (matching known motifs), motifRG, - MotIV, rGADEM BCRANK (motif discovery)
- Integration with expression data – Rcade, epigenomix


 4184
4184

 被折叠的 条评论
为什么被折叠?
被折叠的 条评论
为什么被折叠?
 到【灌水乐园】发言


