### 使用YOLOv8实现视频内指定区域的物体检测与数量统计
要实现在视频中特定区域的目标检测与数量统计,可以通过以下方法完成:
#### 1. 环境准备
为了运行YOLOv8模型并处理视频数据,需先安装必要的依赖库。以下是环境配置的相关命令[^1]:
```bash
pip install ultralytics
pip install numpy opencv-python-headless matplotlib
```
#### 2. 加载预训练模型
加载YOLOv8的预训练权重文件用于目标检测任务。可以选择官方提供的不同版本(如`yolov8n.pt`, `yolov8s.pt`等),具体代码如下所示:
```python
from ultralytics import YOLO
model = YOLO('yolov8n.pt') # 加载YOLOv8 nano模型
```
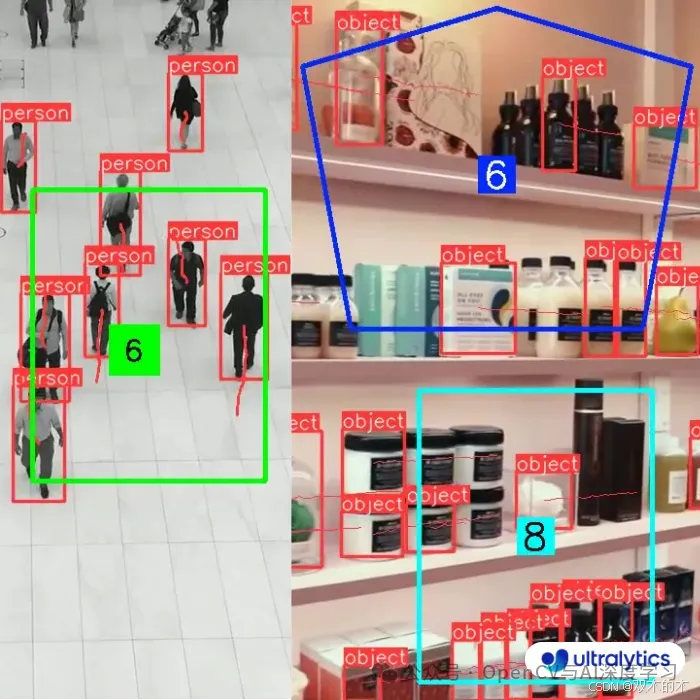
#### 3. 定义划定区域
通过定义多边形或多点坐标来设置感兴趣的区域(Region of Interest, ROI)。这些坐标表示视频帧上的特定范围,在后续步骤中仅对该范围内检测到的对象进行计数。
```python
import cv2
import numpy as np
def define_roi(frame_shape):
height, width = frame_shape[:2]
roi_points = np.array([
[(width * 0.25, height * 0.7), (width * 0.75, height * 0.7),
(width * 0.75, height * 0.95), (width * 0.25, height * 0.95)]
], dtype=np.int32)
return roi_points
```
上述函数创建了一个矩形ROI作为示例。
#### 4. 处理视频流
读取视频文件并对每一帧执行目标检测操作。对于每帧的结果,筛选出落在感兴趣区域内的目标,并对其进行分类和计数。
```python
cap = cv2.VideoCapture('input_video.mp4')
roi_points = None
while cap.isOpened():
ret, frame = cap.read()
if not ret:
break
if roi_points is None:
roi_points = define_roi(frame.shape)
results = model.predict(source=frame, conf=0.5)[0]
object_count = {}
for result in results.boxes.data.tolist():
x1, y1, x2, y2, score, class_id = map(int, result)
center_x = int((x1 + x2) / 2)
center_y = int((y1 + y2) / 2)
inside_roi = cv2.pointPolygonTest(roi_points[0], (center_x, center_y), False) >= 0
if inside_roi:
class_name = model.names[class_id]
if class_name not in object_count:
object_count[class_name] = 0
object_count[class_name] += 1
cv2.rectangle(frame, (x1, y1), (x2, y2), (0, 255, 0), 2)
cv2.putText(frame, f'{class_name}', (x1, y1 - 10), cv2.FONT_HERSHEY_SIMPLEX, 0.9, (0, 255, 0), 2)
cv2.polylines(frame, [roi_points], True, (255, 0, 0), thickness=2)
text_position = (10, 30)
for idx, (object_type, count) in enumerate(object_count.items()):
display_text = f"{object_type}: {count}"
cv2.putText(frame, display_text, (text_position[0], text_position[1] + idx*30), cv2.FONT_HERSHEY_SIMPLEX, 1, (0, 0, 255), 2)
cv2.imshow('Frame', frame)
if cv2.waitKey(1) & 0xFF == ord('q'):
break
cap.release()
cv2.destroyAllWindows()
```
这段代码实现了对视频逐帧分析的功能,同时绘制了边界框、类别标签以及总数量显示在屏幕上[^2]。
#### 5. 可视化增强
如果希望更直观地了解目标物的空间分布情况,则可以引入密度热力图技术。这一步骤有助于观察哪些位置聚集较多目标物,从而辅助决策制定过程[^4]。
```python
import seaborn as sns
heatmap_data = np.zeros((height, width))
for result in results.boxes.data.tolist():
x1, y1, x2, y2, _, _ = map(int, result)
heatmap_data[y1:y2, x1:x2] += 1
sns.heatmap(heatmap_data, cmap="viridis", alpha=0.6)
plt.axis('off')
plt.show()
```
以上部分展示了如何生成简单的热度映射图表。
---
### 总结
综上所述,借助YOLOv8框架能够高效达成视频片段里限定领域里的实体探测同数目汇总的任务需求[^3]。


 最低0.47元/天 解锁文章


 1183
1183

 被折叠的 条评论
为什么被折叠?
被折叠的 条评论
为什么被折叠?
 到【灌水乐园】发言


