


 本文介绍了使用Python实现的两种简单车道线检测方法,包括基于颜色阈值和区域掩模,以及如何结合使用来提高精度。着重强调了这种方法的局限性,指出成熟的自动驾驶系统需要更科学和鲁棒的算法。
描述
python实现简单的车道线检测,本文章将介绍两种简单的方法
- 颜色阈值+区域掩模
- canny边缘检测+霍夫变换
这两种方法都能实现简单的车道线检测demo,注意仅仅是demo
下面的图片是用到的测试图片

方法1:颜色阈值(Color Selection)+ 区域掩模(Region Masking)
- 我们可以仅仅通过设置一些RGB通道阈值,来提取车道线。
以下的代码设置了RGB通道阈值为220,大于220的像素将设置为黑色,这样可以将测试图片中的车道线提取出来
效果如下
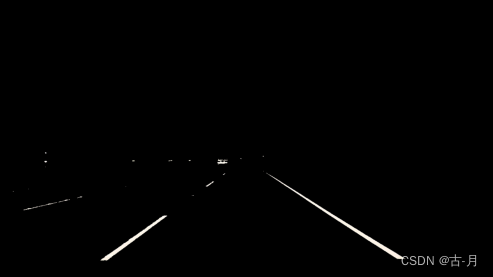
我们发现符合阈值的像素既包括了车道线,也包含了其他非车道线部分。
显然,一个成熟的自动驾驶感知算法,是不可能使用这种方法的。仅仅依靠颜色,既不科学也不鲁棒。
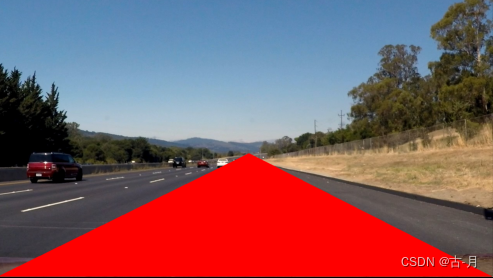
- 有一种改进思路是利用图像掩模的方法
假设拍摄图像的前置摄像头安装在汽车上的固定位置,这样车道线将始终出现在图像的相同区域中。我们将设置了一个区域,认为车道线处于该区域内。我们设置了一个三角形的区域,原则上你可以使用其他形状
- 如果两个方法结合一下,我们就可以得到这样的效果
python代码如下
import matplotlib.pyplot as pltimport matplotlib.image as mpimgimport numpy as np# Read in the imageimage = mpimg.imread('test.jpg')# Grab the x and y sizes and make two copies of the image# With one copy we'll extract only the pixels that meet our selection,# then we'll paint those pixels red in the original image to see our selection# overlaid on the original.ysize = image.shape[0]xsize = image.shape[1]color_select= np.copy(image)line_image = np.copy(image)# Define our color criteriared_threshold = 220green_threshold = 220blue_threshold = 220rgb_threshold = [red_threshold, green_threshold, blue_threshold]# Define a triangle region of interest (Note: if you run this code,left_bottom = [0, ysize-1]right_bottom = [xsize-1, ysize-1]apex = [650, 400]fit_left = np.polyfit((left_bottom[0], apex[0]), (left_bottom[1], apex[1]), 1)fit_right = np.polyfit((right_bottom[0], apex[0]), (right_bottom[1], apex[1]), 1)fit_bottom = np.polyfit((left_bottom[0], right_bottom[0]), (left_bottom[1], right_bottom[1]), 1)# Mask pixels below the thresholdcolor_thresholds = (image[:,:,0] < rgb_threshold[0]) | \ (image[:,:,1] < rgb_threshold[1]) | \ (image[:,:,2] < rgb_threshold[2])# Find the region inside the linesXX, YY = np.meshgrid(np.arange(0, xsize), np.arange(0, ysize))region_thresholds = (YY > (XX*fit_left[0] + fit_left[1])) & \ (YY > (XX*fit_right[0] + fit_right[1])) & \ (YY < (XX*fit_bottom[0] + fit_bottom[1]))# Mask color selectioncolor_select[color_thresholds] = [0,0,0]# Find where image is both colored right and in the regionline_image[~color_thresholds & region_thresholds] = [255,0,0]# Display our two output imagesplt.imshow(color_select)plt.imshow(line_image)# uncomment if plot does not displayplt.show()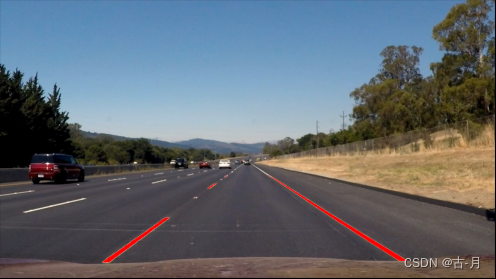
点击python实现简单的车道线检测 - 古月居 可查看全文


 489
489

 被折叠的 条评论
为什么被折叠?
被折叠的 条评论
为什么被折叠?
 到【灌水乐园】发言


