 nuScenes数据集介绍与点云可视化


文章目录
1. nuScenes数据集
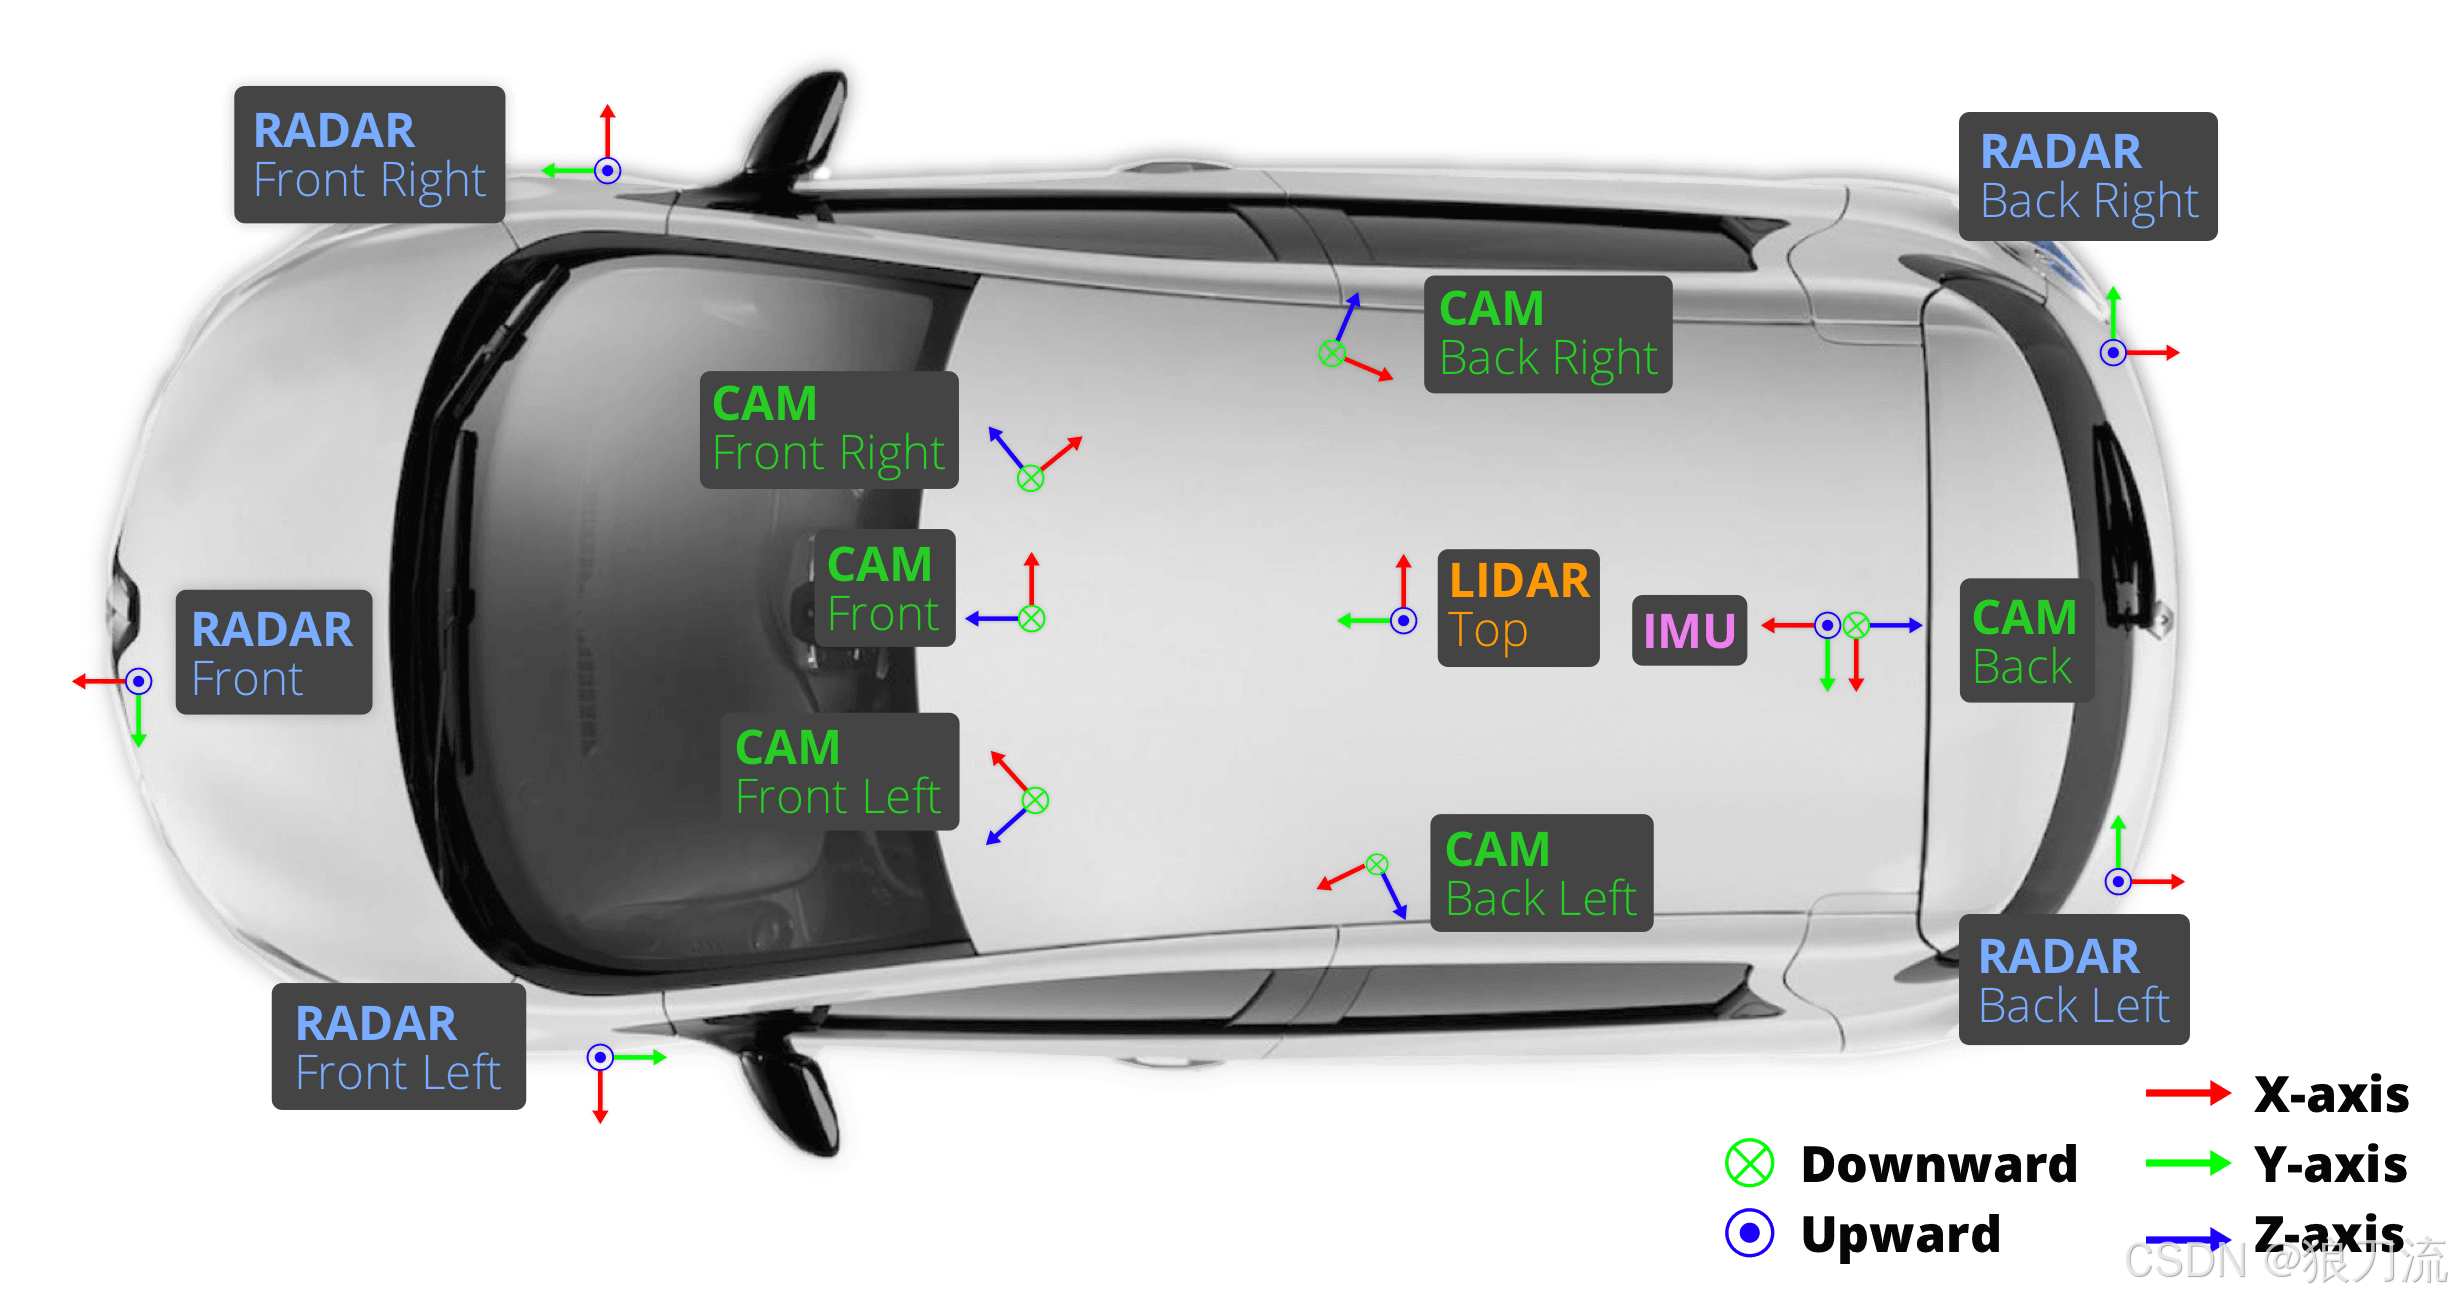
nuScenes 数据集是一种用于自动驾驶研究的大规模开放式数据集,其中包含了从多个传感器收集的高清三维激光雷达数据、高清摄像头数据、GPS 和 IMU 数据以及其它传感器等多种数据类型,总数据量达到了超过 1000 小时的行驶数据。各个传感器在车辆的具体位置可参考上图
nuScenes 数据集由 nuTonomy 公司于 2019 年发布,后被 Aptiv 收购并维护。数据集中包含了超过 1000 个行驶场景,每个场景长度约为 20 秒,包括了各种驾驶情况,如城市、高速公路和居住区等场景
nuScenes 数据集中的传感器数据可以用于多种自动驾驶研究任务,如目标检测、语义分割、行为预测等。
nuScenes 官网:nuScenes 官网
nuScenes 教程:nuScenes 教程
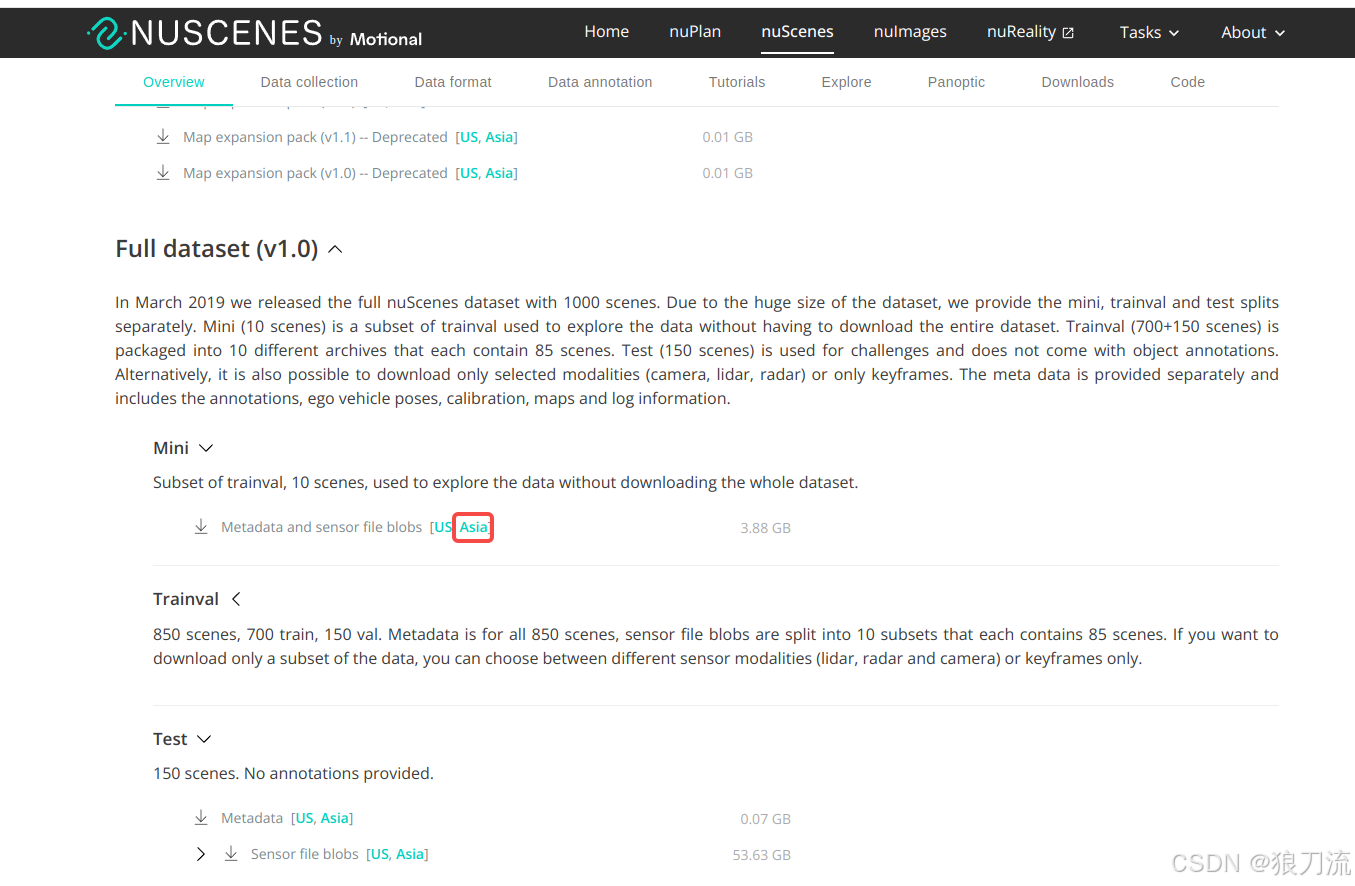
nuScenes mini 数据集下载:下载
2. nuScenes数据格式
例如:
在语言模型中,编码器和解码器都是由一个个的 Transformer 组件拼接在一起形成的。
1.maps
包含有关城市街道的地图数据,包括道路、车道、交叉口、建筑物和树木等信息
2.samples
包含有关车辆传感器数据的信息,如激光雷达、相机和毫米波雷达等一些样本数据
相机数据是以图片的格式存储的,LiDAR 数据是以二进制的格式存储的,Radar 数据则是以 PCD 的格式进行存储的
PCD 全称 Point Cloud Data,是一种用于存储三维点云数据的文件格式。每个 .pcd 文件包含了 x、y、z 的三维坐标以及反射强度等信息
后续点云数据的可视化是读取的 LiDAR_TOP 中的某一个二进制文件
3.sweeps
包含了一系列车辆传感器数据的信息
4.v1.0-mini
包含有关数据集中每个样本的元数据信息,如时间戳、旋转矩阵等。元数据以 JSON 格式存储
5.v1.0-mini.txt
说明文档
3. 点云可视化
其点云数据格式是一个二进制文件,其 shape 为 [n,5]
- n 代表点云的数量
- 5 分别代表 x、y、z、intensity、ring index
- x、y、z 代表基于激光雷达的 3D 坐标
- intensity 是反射强度,指的是激光接收器接受的反射次数,通常用于区分物体或地面
- ring index:点所在激光雷达扫描线的编号,比如 32 线激光雷达,其值就为 1-32
3.1 opencv可视化
import numpy as np
import cv2

file = "/media/xx/workspace/workspace/nuScenes-mini/samples/LIDAR_TOP/n008-2018-08-01-15-16-36-0400__LIDAR_TOP__1533151605548192.pcd.bin"

# [x, y, z, intensity, ring index]
pc = np.frombuffer(open(file, "rb").read(), dtype=np.float32)
pc = pc.reshape(-1, 5)[:
最低0.47元/天 解锁文章


 1万+
1万+

 被折叠的 条评论
为什么被折叠?
被折叠的 条评论
为什么被折叠?
 到【灌水乐园】发言


