


一、拟合直线
clc;clear all;close all;

%%%二维直线拟合
%%%生成随机数据
%内点
mu=[0 0];  %均值
S=[1 2.5;2.5 8];  %协方差
data1=mvnrnd(mu,S,200);   %产生200个高斯分布数据
%外点
mu=[2 2];
S=[8 0;0 8];
data2=mvnrnd(mu,S,100);     %产生100个噪声数据
%合并数据
data=[data1',data2'];
iter = 100;

 %%% 绘制数据点
 figure;plot(data(1,:),data(2,:),'o');hold on; % 显示数据点
 number = size(data,2); % 总点数
 bestParameter1=0; bestParameter2=0; % 最佳匹配的参数
 sigma = 1;
 pretotal=0;     %符合拟合模型的数据的个数

 for i=1:iter
 %%% 随机选择两个点
     idx = randperm(number,2);
     sample = data(:,idx);

     %%%拟合直线方程 y=kx+b
     line = zeros(1,3);
     x = sample(:, 1);
     y = sample(:, 2);

     %k=(y(1)-y(2))/(x(1)-x(2));      %直线斜率
     %b = y(1) - k*x(1);
     k=(y(2)-x(2))/(y(1)-x(1));
     b= x(2)-k*x(1);
     line = [k -1 b]

     mask=abs(line*[data; ones(1,size(data,2))]);    %求每个数据到拟合直线的距离
     total=sum(mask<sigma);              %计算数据距离直线小于一定阈值的数据的个数

     if total>pretotal            %找到符合拟合直线数据最多的拟合直线
         pretotal=total;
         bestline=line;          %找到最好的拟合直线
    end
 end
 %显示符合最佳拟合的数据
mask=abs(bestline*[data; ones(1,size(data,2))])<sigma;
hold on;
k=1;
for i=1:length(mask)
    if mask(i)
        inliers(1,k) = data(1,i);
        k=k+1;
        plot(data(1,i),data(2,i),'+');
    end
end

 %%% 绘制最佳匹配曲线
 bestParameter1 = -bestline(1)/bestline(2);
 bestParameter2 = -bestline(3)/bestline(2);
 xAxis = min(inliers(1,:)):max(inliers(1,:));
 yAxis = bestParameter1*xAxis + bestParameter2;
 plot(xAxis,yAxis,'r-','LineWidth',2);
%  title(['bestLine:  y =  ',num2str(bestParameter1),'x + ',num2str(bestParameter2)]);
二、拟合平面
clc;clear all;close all;

%%%三维平面拟合
%%%生成随机数据
%内点
mu=[0 0 0];  %均值
S=[2 0 4;0 4 0;4 0 8];  %协方差
data1=mvnrnd(mu,S,300);   %产生200个高斯分布数据
%外点
mu=[2 2 2];
S=[8 1 4;1 8 2;4 2 8];  %协方差
data2=mvnrnd(mu,S,100);     %产生100个噪声数据
%合并数据
data=[data1',data2'];
iter = 1000;

%%% 绘制数据点
 figure;plot3(data(1,:),data(2,:),data(3,:),'o');hold on; % 显示数据点
 number = size(data,2); % 总点数
 bestParameter1=0; bestParameter2=0; bestParameter3=0; % 最佳匹配的参数
 sigma = 1;
 pretotal=0;     %符合拟合模型的数据的个数

for i=1:iter
 %%% 随机选择三个点
     idx = randperm(number,3);
     sample = data(:,idx);

     %%%拟合直线方程 z=ax+by+c
     plane = zeros(1,3);
     x = sample(:, 1);
     y = sample(:, 2);
     z = sample(:, 3);

     %a = ((z(1)-z(2))*(y(1)-y(3)) - (z(1)-z(3))*(y(1)-y(2)))/((x(1)-x(2))*(y(1)-y(3)) - (x(1)-x(3))*(y(1)-y(2)));
     %b = ((z(1) - z(3)) - a * (x(1) - x(3)))/(y(1)-y(3));
     %c = z(1) - a * x(1) - b * y(1);
     a = (x(3)*(y(2)-z(2))-y(3)*(x(2)-z(2))-(y(2)-z(2))*z(3)+(x(2)-z(2))*z(3))/((x(1)-z(1))*(y(2)-z(2))-(y(1)-z(1))*(x(2)-z(2)));
     b = (x(3)-(x(1)-z(1))*a-z(3))/(x(2)-z(2));
     c=z(3)-a*z(1)-b*z(2);

     plane = [a b -1 c]

     mask=abs(plane*[data; ones(1,size(data,2))]);    %求每个数据到拟合平面的距离
     total=sum(mask<sigma);              %计算数据距离平面小于一定阈值的数据的个数

     if total>pretotal            %找到符合拟合平面数据最多的拟合平面
         pretotal=total;
         bestplane=plane;          %找到最好的拟合平面
    end
 end
 %显示符合最佳拟合的数据
mask=abs(bestplane*[data; ones(1,size(data,2))])<sigma;
hold on;
k = 1;
for i=1:length(mask)
    if mask(i)
        inliers(1,k) = data(1,i);
        inliers(2,k) = data(2,i);
        plot3(data(1,i),data(2,i),data(3,i),'r+');
        k = k+1;
    end
end

 %%% 绘制最佳匹配平面
 bestParameter1 = bestplane(1);
 bestParameter2 = bestplane(2);
 bestParameter3 = bestplane(4);
 xAxis = min(inliers(1,:)):max(inliers(1,:));
 yAxis = min(inliers(2,:)):max(inliers(2,:));
 [x,y] = meshgrid(xAxis, yAxis);
 z = bestParameter1 * x + bestParameter2 * y + bestParameter3;
 surf(x, y, z);
 title(['bestPlane:  z =  ',num2str(bestParameter1),'x + ',num2str(bestParameter2),'y + ',num2str(bestParameter3)]);
三、RANSAC点云多平面拟合分割
三维平面拟合(最小二乘法)
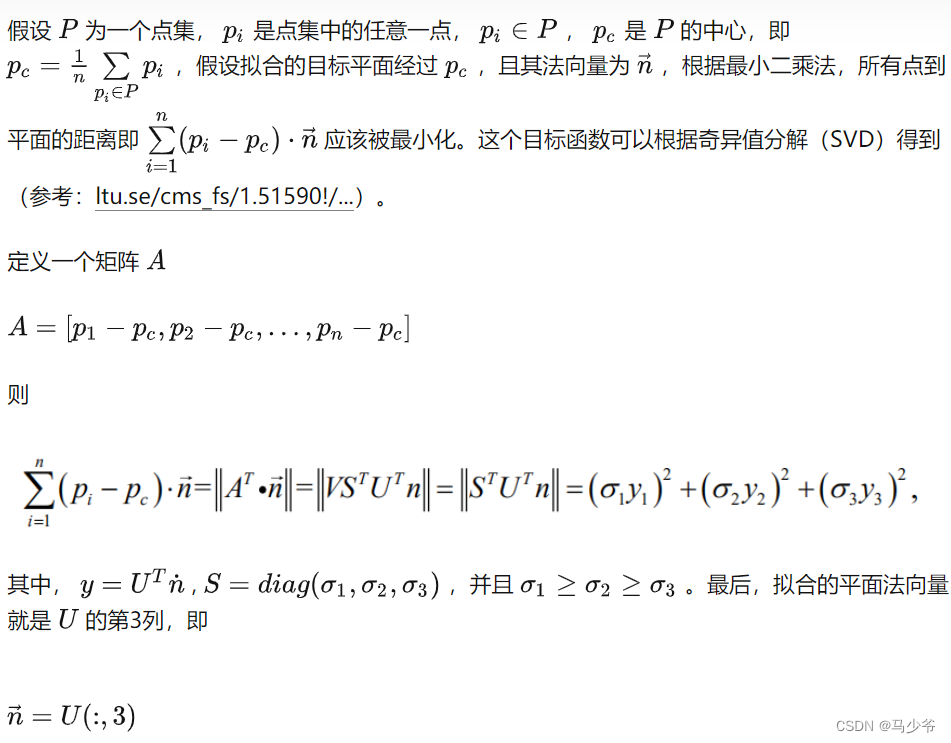
具体实现见下面代码:
def SVD(points):
    # 二维,三维均适用
    # 二维直线,三维平面
    pts = points.copy()
    # 奇异值分解
    c = np.mean(pts, axis=0)
    A = pts - c # shift the points
    A = A.T #3*n
    u, s, vh = np.linalg.svd(A, full_matrices=False, compute_uv=True) # A=u*s*vh
    normal = u[:,-1]

    # 法向量归一化
    nlen = np.sqrt(np.dot(normal,normal))
    normal = normal / nlen
    # normal 是主方向的方向向量 与PCA最小特征值对应的特征向量是垂直关系
    # u 每一列是一个方向
    # s 是对应的特征值
    # c >>> 点的中心
    # normal >>> 拟合的方向向量
    return u,s,c,normal


class plane_model(object):
    def __init__(self):
        平面模型参数(平面上任意一点 cx, cy, cx) + (平面法向量 nx, ny, nz)
        self.parameters = None

    def calc_inliers(self,points,dst_threshold):
        # 根据点到平面的距离计算内点和外点
        c = self.parameters[0:3]
        n = self.parameters[3:6]
        dst = abs(np.dot(points-c,n))
        ind = dst<dst_threshold
        return ind

    def estimate_parameters(self,pts):
        # 最小二乘法估算平面模型
        # 只有三个点时,可以直接计算
        num = pts.shape[0]
        if num == 3:
            c = np.mean(pts,axis=0)
            l1 = pts[1]-pts[0]
            l2 = pts[2]-pts[0]
            n = np.cross(l1,l2)
            scale = [n[i]**2 for i in range(n.shape[0])]
            #print(scale)
            n = n/np.sqrt(np.sum(scale))
        else:
            _,_,c,n = SVD(pts)

        params = np.hstack((c.reshape(1,-1),n.reshape(1,-1)))[0,:]
        self.parameters = params
        return params

    def set_parameters(self,parameters):
        self.parameters = parameters
RANSAC算法
RANSAC是一种算法,一种思想,不仅仅可以用于拟合平面,实际上还有很多用处。
这里的算法如下算法
随机挑选3个点,并计算3点形成的采样平面、
根据采样平面计算所有点到平面的距离,并根据参数(距离的阈值)将点分为内点和外点
统计内点,外点数量,更新最大迭代次数 ( )
重复以上过程直到达到停止条件(最大迭代次数,内点比例等)
# 注意这里并没有根据内点比例和模型可靠的概率动态调整最大迭代次数
def ransac_planefit(points, ransac_n, max_dst, max_trials=1000, stop_inliers_ratio=1.0, initial_inliers=None):
    # RANSAC 平面拟合
    pts = points.copy()
    num = pts.shape[0]
    cc = np.mean(pts,axis=0)
    iter_max = max_trials
    best_inliers_ratio = 0 #符合拟合模型的数据的比例
    best_plane_params = None
    best_inliers = None
    best_remains = None
    for i in range(iter_max):
        sample_index = random.sample(range(num),ransac_n)
        sample_points = pts[sample_index,:]
        plane = plane_model()
        plane_params = plane.estimate_parameters(sample_points)
        #  计算内点 外点
        index = plane.calc_inliers(points,max_dst)
        inliers_ratio = pts[index].shape[0]/num

        if inliers_ratio > best_inliers_ratio:
            best_inliers_ratio = inliers_ratio
            best_plane_params = plane_params
            bset_inliers = pts[index]
            bset_remains = pts[index==False]

        if best_inliers_ratio > stop_inliers_ratio:
            # 检查是否达到最大的比例
            print("iter: %d\n" % i)
            print("best_inliers_ratio: %f\n" % best_inliers_ratio)
            break

    return best_plane_params,bset_inliers,bset_remains
多平面拟合
针对一个三维点云,进行多平面拟合的基本思想是:首先使用RANSAC平面拟合算法从点云中提取出一个平面,对于剩下的外点,继续循环RANSAC平面拟合算法提取平面,直到提取出所有的平面,循环时注意循环停止条件的设置
具体实现见下面代码:
def ransac_plane_detection(points, ransac_n, max_dst, max_trials=1000, stop_inliers_ratio=1.0, initial_inliers=None, out_layer_inliers_threshold=230, out_layer_remains_threshold=230):
    # out_layer_inliers_threshold --> 每一次RANSAC提取出来的平面最少含有的内点数量
    # out_layer_remains_threshold --> 每一次RANSAC提取平面后剩余外点的最少数量,少于这个值,则停止循环
    inliers_num = out_layer_inliers_threshold + 1
    remains_num = out_layer_remains_threshold + 1

    plane_set = []
    plane_inliers_set = []
    plane_inliers_num_set = []

    data_remains = np.copy(points)

    i = 0

    while inliers_num>out_layer_inliers_threshold and remains_num>out_layer_remains_threshold:
        # robustly fit line only using inlier data with RANSAC algorithm
        best_plane_params,pts_inliers,pts_outliers = ransac_planefit(data_remains, ransac_n, max_dst, max_trials=max_trials, stop_inliers_ratio=stop_inliers_ratio)

        inliers_num = pts_inliers.shape[0]
        remains_num = pts_outliers.shape[0]

        if inliers_num>out_layer_inliers_threshold:
            plane_set.append(best_plane_params)
            plane_inliers_set.append(pts_inliers)
            plane_inliers_num_set.append(inliers_num)
            i = i+1
            print('------------> %d <--------------' % i)
            print(best_plane_params)

        data_remains = pts_outliers

    # sorting
    plane_set = [x for _, x in sorted(zip(plane_inliers_num_set,plane_set), key=lambda s: s[0], reverse=True)]
    plane_inliers_set = [x for _, x in sorted(zip(plane_inliers_num_set,plane_inliers_set), key=lambda s: s[0], reverse=True)]

    return plane_set, plane_inliers_set, data_remains
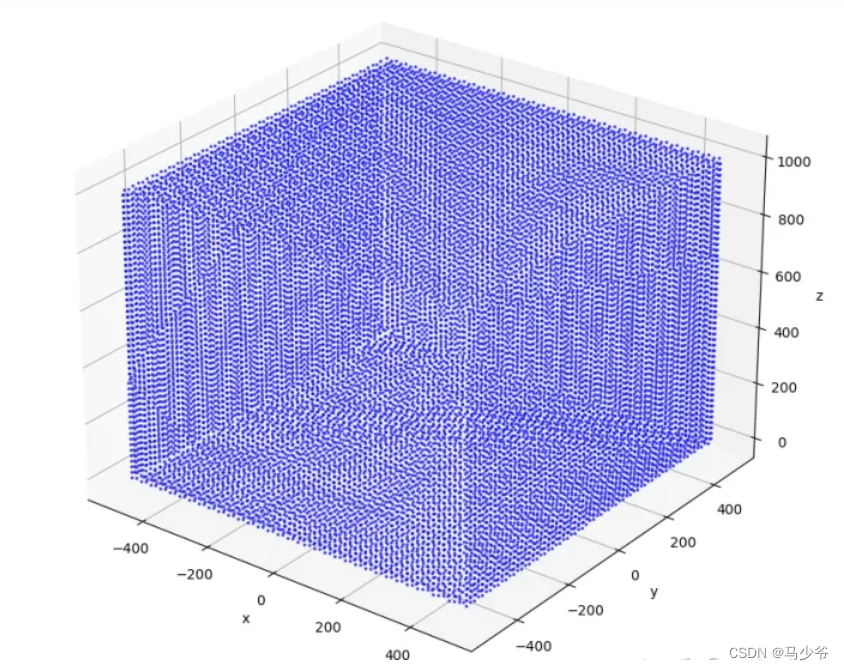
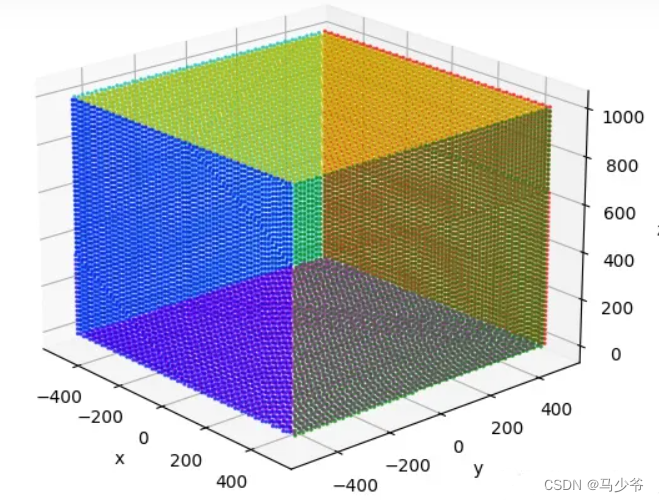
这里给出一个立方体的三维点云,如下图所示
全部代码
包含一些读取txt和绘制三维点的代码,如下:
import os
import numpy as np
import matplotlib.pyplot as plt
from mpl_toolkits.mplot3d import Axes3D
import math
import random
def strlist2num(dl):
#将字符串列表转化为浮点型列表
data = []
for i in range(len(dl)):
if dl[i]=='nan'or dl[i]=='NaN':
raise ValueError('data is nan')
data.append(float(dl[i]))
return np.array(data)
def read_txt(path,row_skip=0,split_char=',',num_range=None, verbose=False):
"""
read txt file into a np.ndarray.
Input:
------
path: file path
row_skip: skip the first rows to read data
split_char: spliting character
num_range: data range of each number
Output:
------
data: data read. data is np.array([]) when reading error happened
data is np.array([]) when nan or NaN appears
data is np.array([]) when any number is out of range
"""
try:
f = open(path,'r',encoding='utf-8')
line_list = f.readlines()
read_lines_num = len(line_list)
for i in range(read_lines_num):
line_list[i] = line_list[i].rstrip()
i = row_skip # 从第三行开始读取
data = []
while i <= read_lines_num-1:
data_str = line_list[i].split(split_char)
data.append(strlist2num(data_str))
i = i + 1
f.close()
except:
if verbose:
print("type data of [{}] is wrong...".format(path))
data = np.array([])
f.close()
data = np.array(data)
if num_range is not None:
if np.any(data<num_range[0]) or np.any(data>num_range[1]):
data = np.array([])
if verbose:
print("data of [{}] is out of range...".format(path))
return data
def SVD(points):
# 二维,三维均适用
# 二维直线,三维平面
pts = points.copy()
# 奇异值分解
c = np.mean(pts, axis=0)
A = pts - c # shift the points
A = A.T #3*n
u, s, vh = np.linalg.svd(A, full_matrices=False, compute_uv=True) # A=u*s*vh
normal = u[:,-1]
# 法向量归一化
nlen = np.sqrt(np.dot(normal,normal))
normal = normal / nlen
# normal 是主方向的方向向量 与PCA最小特征值对应的特征向量是垂直关系
# u 每一列是一个方向
# s 是对应的特征值
# c >>> 点的中心
# normal >>> 拟合的方向向量
return u,s,c,normal
class plane_model(object):
def __init__(self):
self.parameters = None
def calc_inliers(self,points,dst_threshold):
c = self.parameters[0:3]
n = self.parameters[3:6]
dst = abs(np.dot(points-c,n))
ind = dst<dst_threshold
return ind
def estimate_parameters(self,pts):
num = pts.shape[0]
if num == 3:
c = np.mean(pts,axis=0)
l1 = pts[1]-pts[0]
l2 = pts[2]-pts[0]
n = np.cross(l1,l2)
scale = [n[i]**2 for i in range(n.shape[0])]
#print(scale)
n = n/np.sqrt(np.sum(scale))
else:
_,_,c,n = SVD(pts)
params = np.hstack((c.reshape(1,-1),n.reshape(1,-1)))[0,:]
self.parameters = params
return params
def set_parameters(self,parameters):
self.parameters = parameters
def ransac_planefit(points, ransac_n, max_dst, max_trials=1000, stop_inliers_ratio=1.0, initial_inliers=None):
# RANSAC 平面拟合
pts = points.copy()
num = pts.shape[0]
cc = np.mean(pts,axis=0)
iter_max = max_trials
best_inliers_ratio = 0 #符合拟合模型的数据的比例
best_plane_params = None
best_inliers = None
best_remains = None
for i in range(iter_max):
sample_index = random.sample(range(num),ransac_n)
sample_points = pts[sample_index,:]
plane = plane_model()
plane_params = plane.estimate_parameters(sample_points)
# 计算内点 外点
index = plane.calc_inliers(points,max_dst)
inliers_ratio = pts[index].shape[0]/num
if inliers_ratio > best_inliers_ratio:
best_inliers_ratio = inliers_ratio
best_plane_params = plane_params
bset_inliers = pts[index]
bset_remains = pts[index==False]
if best_inliers_ratio > stop_inliers_ratio:
# 检查是否达到最大的比例
print("iter: %d\n" % i)
print("best_inliers_ratio: %f\n" % best_inliers_ratio)
break
return best_plane_params,bset_inliers,bset_remains
def ransac_plane_detection(points, ransac_n, max_dst, max_trials=1000, stop_inliers_ratio=1.0, initial_inliers=None, out_layer_inliers_threshold=230, out_layer_remains_threshold=230):
inliers_num = out_layer_inliers_threshold + 1
remains_num = out_layer_remains_threshold + 1
plane_set = []
plane_inliers_set = []
plane_inliers_num_set = []
data_remains = np.copy(points)
i = 0
while inliers_num>out_layer_inliers_threshold and remains_num>out_layer_remains_threshold:
# robustly fit line only using inlier data with RANSAC algorithm
best_plane_params,pts_inliers,pts_outliers = ransac_planefit(data_remains, ransac_n, max_dst, max_trials=max_trials, stop_inliers_ratio=stop_inliers_ratio)
inliers_num = pts_inliers.shape[0]
remains_num = pts_outliers.shape[0]
if inliers_num>out_layer_inliers_threshold:
plane_set.append(best_plane_params)
plane_inliers_set.append(pts_inliers)
plane_inliers_num_set.append(inliers_num)
i = i+1
print('------------> %d <--------------' % i)
print(best_plane_params)
data_remains = pts_outliers
# sorting
plane_set = [x for _, x in sorted(zip(plane_inliers_num_set,plane_set), key=lambda s: s[0], reverse=True)]
plane_inliers_set = [x for _, x in sorted(zip(plane_inliers_num_set,plane_inliers_set), key=lambda s: s[0], reverse=True)]
return plane_set, plane_inliers_set, data_remains
def show_3dpoints(pointcluster,s=None,colors=None,quiver=None,q_length=10,tri_face_index=None):
# pointcluster should be a list of numpy ndarray
# This functions would show a list of pint cloud in different colors
n = len(pointcluster)
if colors is None:
colors = ['r','g','b','c','m','y','k','tomato','gold']
if n < 10:
colors = np.array(colors[0:n])
else:
colors = np.random.rand(n,3)
fig = plt.figure()
ax = fig.add_subplot(projection='3d')
if s is None:
s = np.ones(n)*2
for i in range(n):
ax.scatter(pointcluster[i][:,0],pointcluster[i][:,1],pointcluster[i][:,2],s=s[i],c=[colors[i]],alpha=0.6)
if not (quiver is None):
c1 = [random.random() for _ in range(len(quiver))]
c2 = [random.random() for _ in range(len(quiver))]
c3 = [random.random() for _ in range(len(quiver))]
c = []
for i in range(len(quiver)):
c.append((c1[i],c2[i],c3[i]))
cp = []
for i in range(len(quiver)):
cp.append(c[i])
cp.append(c[i])
c = c + cp
ax.quiver(quiver[:,0],quiver[:,1],quiver[:,2],quiver[:,3],quiver[:,4],quiver[:,5],length=q_length,arrow_length_ratio=.2,pivot='tail',normalize=False,color=c)
if not (tri_face_index is None):
for i in range(len(tri_face_index)):
for j in range(tri_face_index[i].shape[0]):
index = tri_face_index[i][j].tolist()
index = index + [index[0]]
ax.plot(*zip(*pointcluster[i][index]))
ax.set_xlabel('x')
ax.set_ylabel('y')
ax.set_zlabel('z')
#ax.set_ylim([-20,60])
plt.show()
return 0
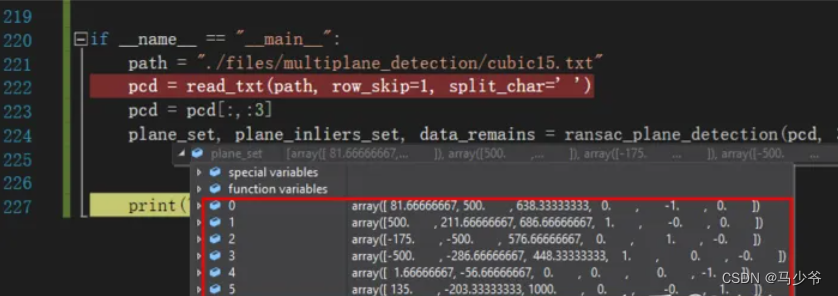
if __name__ == "__main__":
path = "./files/multiplane_detection/cubic15.txt"
pcd = read_txt(path, row_skip=1, split_char=' ')
pcd = pcd[:,:3]
plane_set, plane_inliers_set, data_remains = ransac_plane_detection(pcd, 3, 5, max_trials=1000, stop_inliers_ratio=1.0, initial_inliers=None,
out_layer_inliers_threshold=230, out_layer_remains_threshold=230)
plane_set = np.array(plane_set)
print("================= 平面参数 ====================")
print(plane_set)
# 绘图
show_3dpoints(plane_inliers_set)
print("over!!!")
6个平面
红色边框是6个平面的参数,即 (cx,cy,cz,nx,ny,nz)
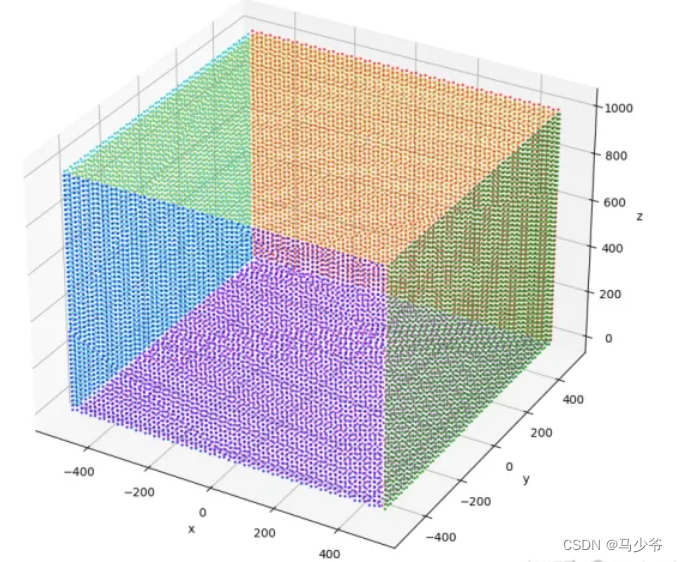
绘图显示
不同颜色代表不同的平面
参考文献:RANSAC拟合平面


 1万+
1万+


 被折叠的 条评论
为什么被折叠?
被折叠的 条评论
为什么被折叠?
 到【灌水乐园】发言


