目录
希腊值公式
q为资产的股息收益率,对于无股息收益率的资产,令q=0可得对应希腊值公式。
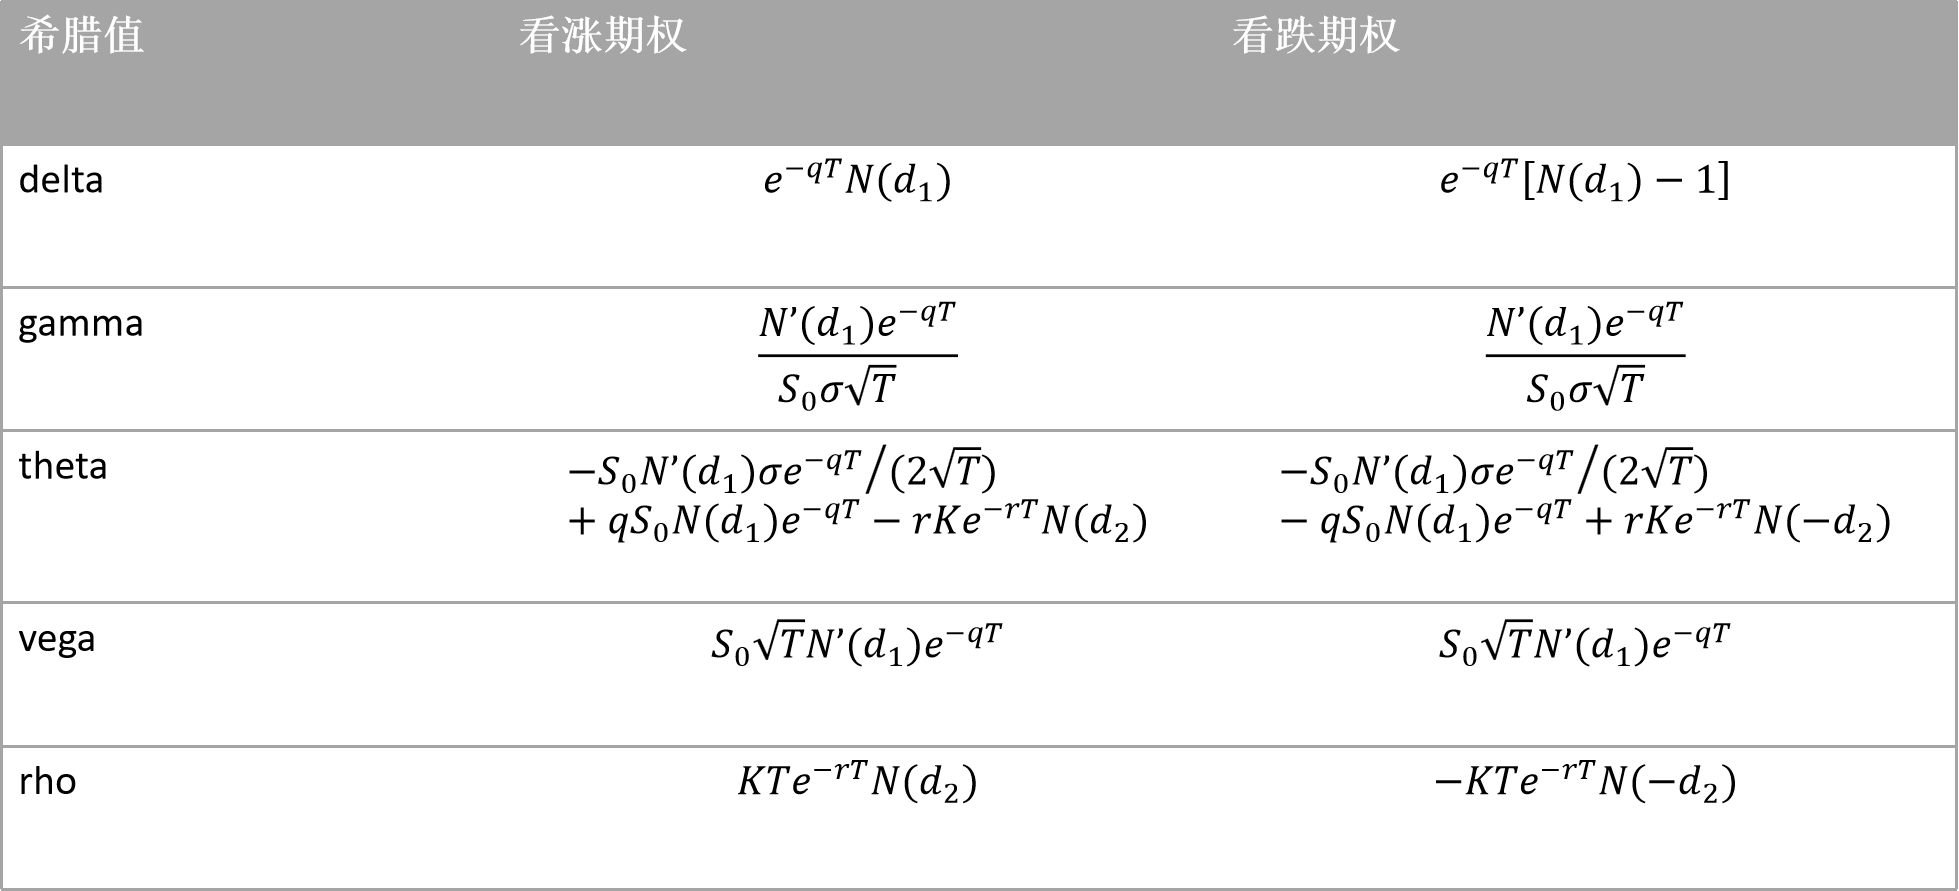
参考材料:“第19章 希腊值” -《期权、期货及其他衍生产品》(原书第10版)
Python计算希腊值
若已知S, K, r, q, T, sigma及期权类型,结合希腊值公式,根据以下Python代码计算希腊值
import numpy as np
from scipy import stats

"""
S         stock price
K         strike price
r         discount rate
q         dividend rate
T         maturity
sigma     volatility
"""

def d(S, K, r, q, T, sigma):
    d1 = (np.log(S/K) + (r - q + 0.5 * sigma ** 2) * T) / (sigma * np.sqrt(T))
    d2 = d1 - sigma  * np.sqrt(T)
    return (d1, d2)

def delta(S, K, r, q, T, sigma, isCall):
    d1 = d(S, K, r, q, T, sigma)[0]
    if(isCall):
        delta = np.exp(-1 * q * T) * stats.norm.cdf(d1)
    else:
        delta = np.exp(-1 * q * T) * (stats.norm.cdf(d1) - 1)
    return delta

def gamma(S, K, r, q, T, sigma, isCall):
    d1 = d(S, K, r, q, T, sigma)[0]
    gamma = stats.norm.pdf(d1) * np.exp(-1 * q * T) / (S * sigma * np.sqrt(T))
    return gamma

def theta(S, K, r, q, T, sigma, isCall):
    (d1,d2) = d(S, K, r, q, T, sigma)
    if(isCall):
        theta = -1 * S * stats.norm.pdf(d1) * sigma * np.exp(-1 * q * T) / (2 * np.sqrt(T)) + q * S * stats.norm.cdf(d1) * np.exp(-1 * q * T) - r * K * np.exp(-1 * r * T) * stats.norm.cdf(d2)
    else:
        theta = -1 * S * stats.norm.pdf(d1) * sigma * np.exp(-1 * q * T) / (2 * np.sqrt(T)) - q * S * stats.norm.cdf(-1 * d1) * np.exp(-1 * q * T) + r * K * np.exp(-1 * r * T) * stats.norm.cdf(-1 * d2)
    return theta

def vega(S, K, r, q, T, sigma, isCall):
    d1 = d(S, K, r, q, T, sigma)[0]
    vega = S * np.sqrt(T) * stats.norm.pdf(d1) * np.exp(-1 * q * T)
    return vega

def rho(S, K, r, q, T, sigma, isCall):
    d2 = d(S, K, r, q, T, sigma)[1]
    if(isCall):
        rho = K * T * np.exp(-1 * r * T) * stats.norm.cdf(d2)
    else:
        rho = -1 * K * T * np.exp(-1 * r * T) * stats.norm.cdf(-1 * d2)
    return rho
Delta
定义
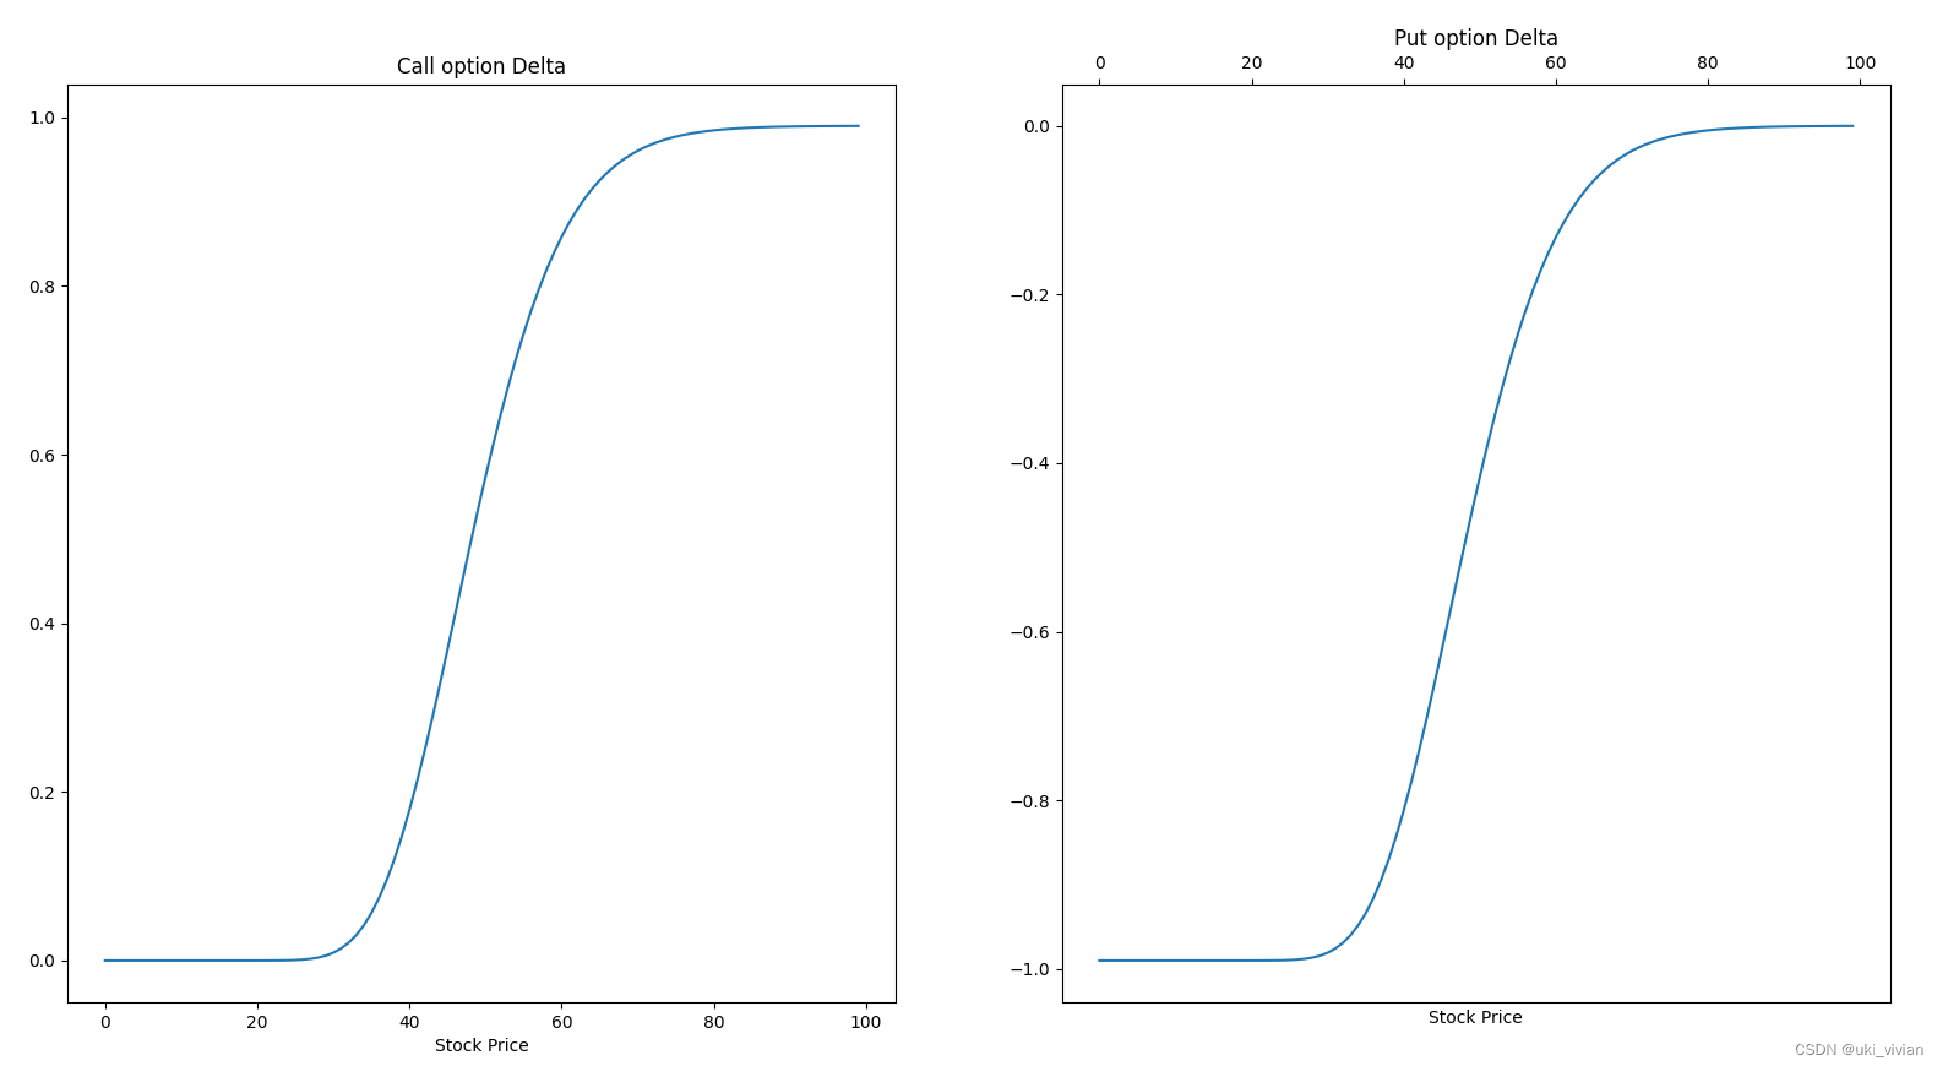
Delta是用来衡量期权价格相对于标的价格变动的敏感度,也可认为是期权价格对于标的价格的一阶导数。
看涨期权Delta>0,即1) 标的价格上涨,看涨期权价格上涨。2) 标的价格下降,看涨期权价格下降。
看跌期权Delta<0,即1) 标的价格上涨,看跌期权价格下降。2) 标的价格下降,看跌期权价格上涨。
图形
看涨期权Delta>0, 取值范围: [0, 1]。
看跌期权Delta<0, 取值范围:[-1,0]。
import numpy as np
import matplotlib.pyplot as plt

S0=50
K=50
r=0.03
q=0.01
T=1
sigma=0.2

##### Call Option Delta / 看涨期权Delta #####
Sx = np.arange(0.01, 100, 0.1)
Delta_Sx = delta(Sx, K, r, q, T, sigma, True)

fig = plt.figure()
ax1 = fig.add_subplot(121)
ax1.plot(Sx, Delta_Sx)
ax1.set_xlabel('Stock Price')
ax1.set_title('Call option Delta')

##### Put Option Delta / 看跌期权Delta #####
Sx = np.arange(0.01, 100, 0.1)
Delta_Sx = delta(Sx, K, r, q, T, sigma, False)

ax2 = fig.add_subplot(122)
ax2.tick_params(top=True, labeltop=True, bottom=False, labelbottom=False)
ax2.plot(Sx, Delta_Sx)
ax2.set_xlabel('Stock Price')
ax2.set_title('Put option Delta')
plt.show()

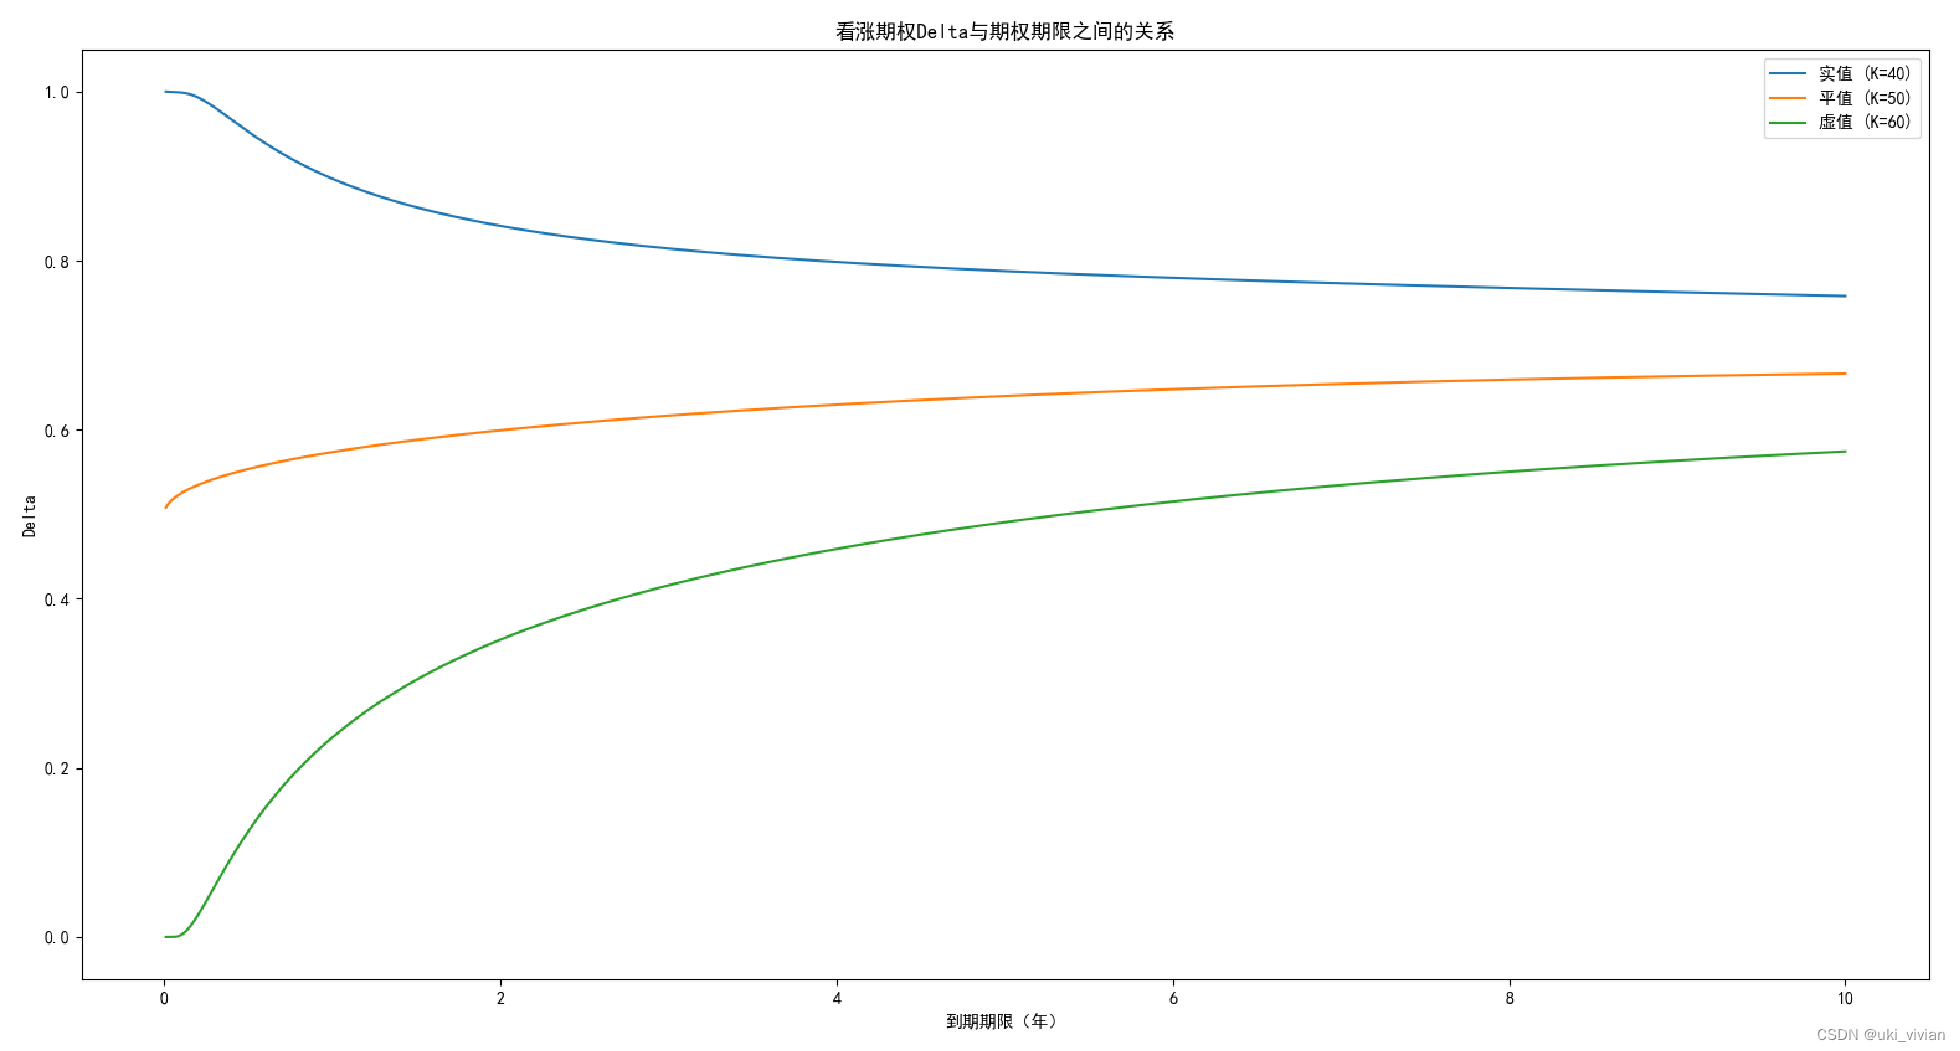
##### 看涨期权Delta & 期权期限 #####
ITM = 40
ATM = 50
OTM = 60
Tx = np.arange(0.01, 10, 0.001)
Delta_Tx_ITM = delta(S0, ITM, r, q, Tx, sigma, True)
Delta_Tx_ATM = delta(S0, ATM, r, q, Tx, sigma, True)
Delta_Tx_OTM = delta(S0, OTM, r, q, Tx, sigma, True)

plt.rcParams['font.sans-serif']=['SimHei']
plt.plot(Tx, Delta_Tx_ITM, label='实值 (K=40)')
plt.plot(Tx, Delta_Tx_ATM, label='平值 (K=50)')
plt.plot(Tx, Delta_Tx_OTM, label='虚值 (K=60)')
# plt.axis([0, 10, 0, 1])
plt.xlabel('到期期限(年)')
plt.ylabel('Delta')
plt.title('看涨期权Delta与期权期限之间的关系')
plt.legend()
plt.show()
Gamma
定义
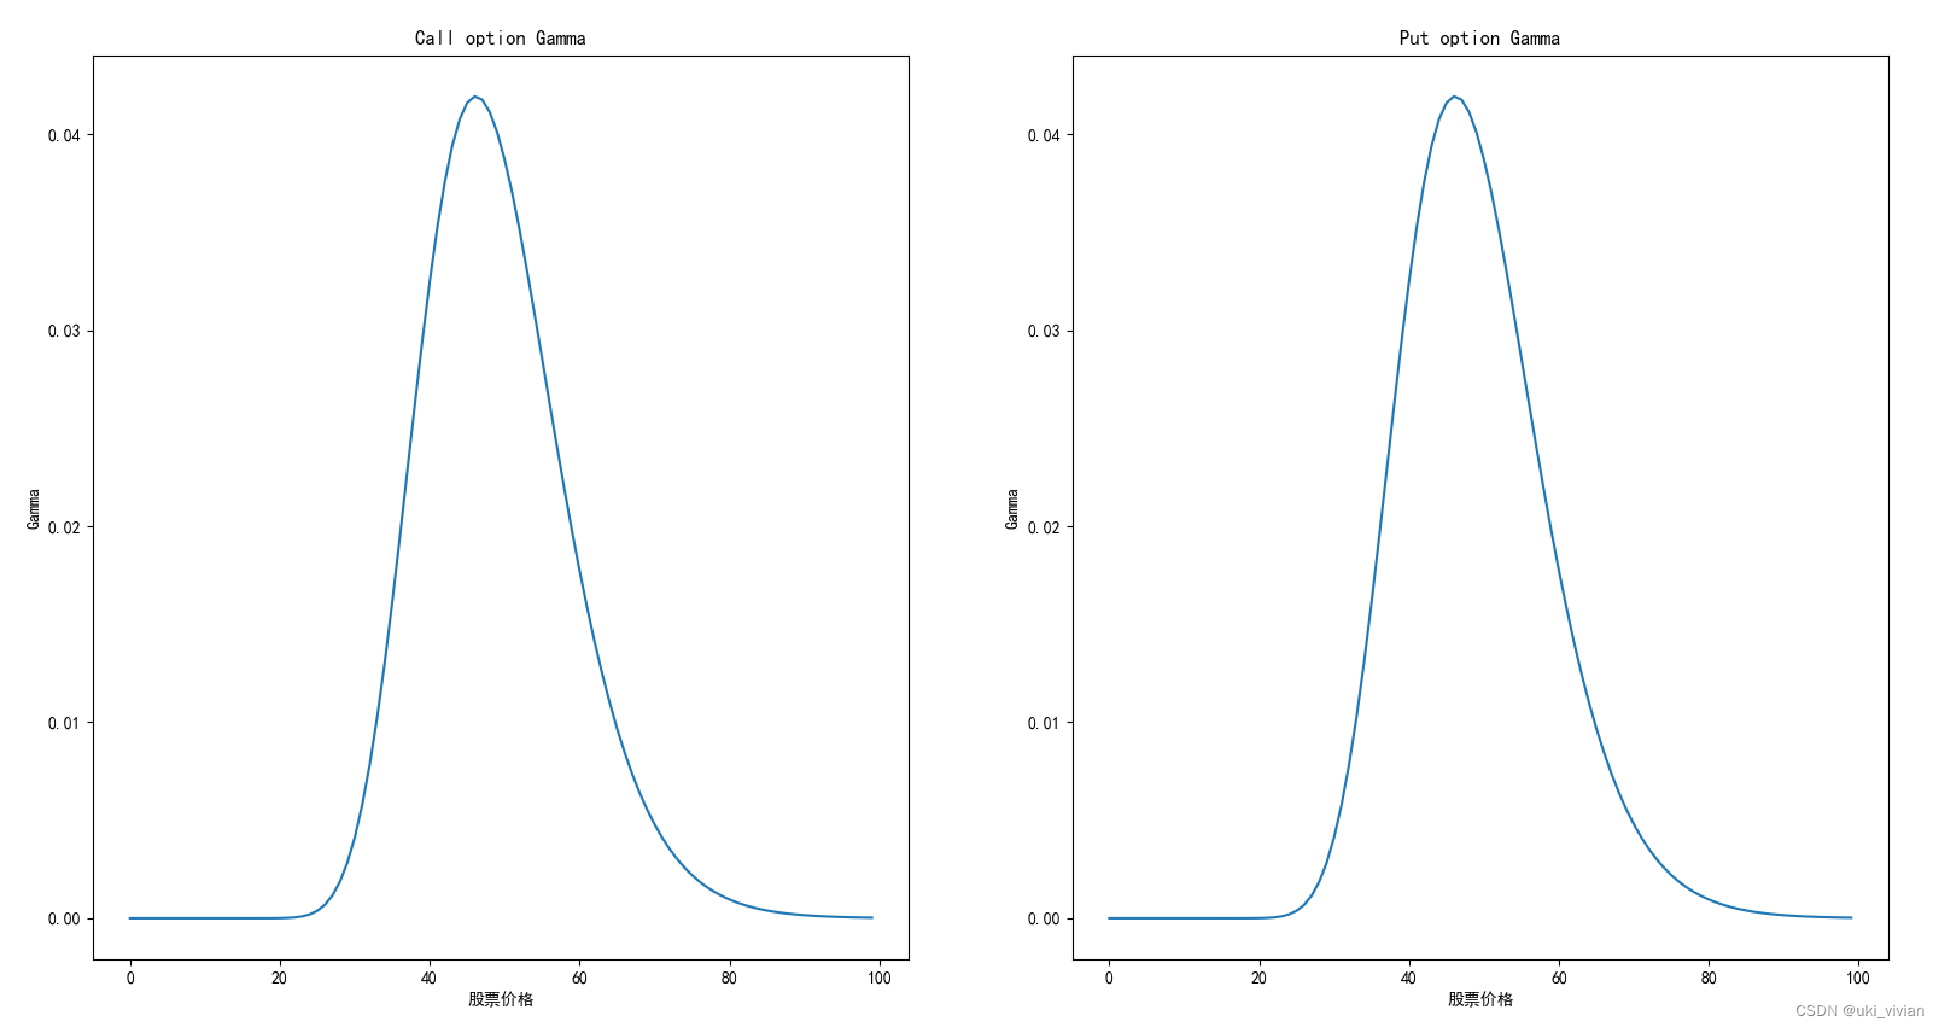
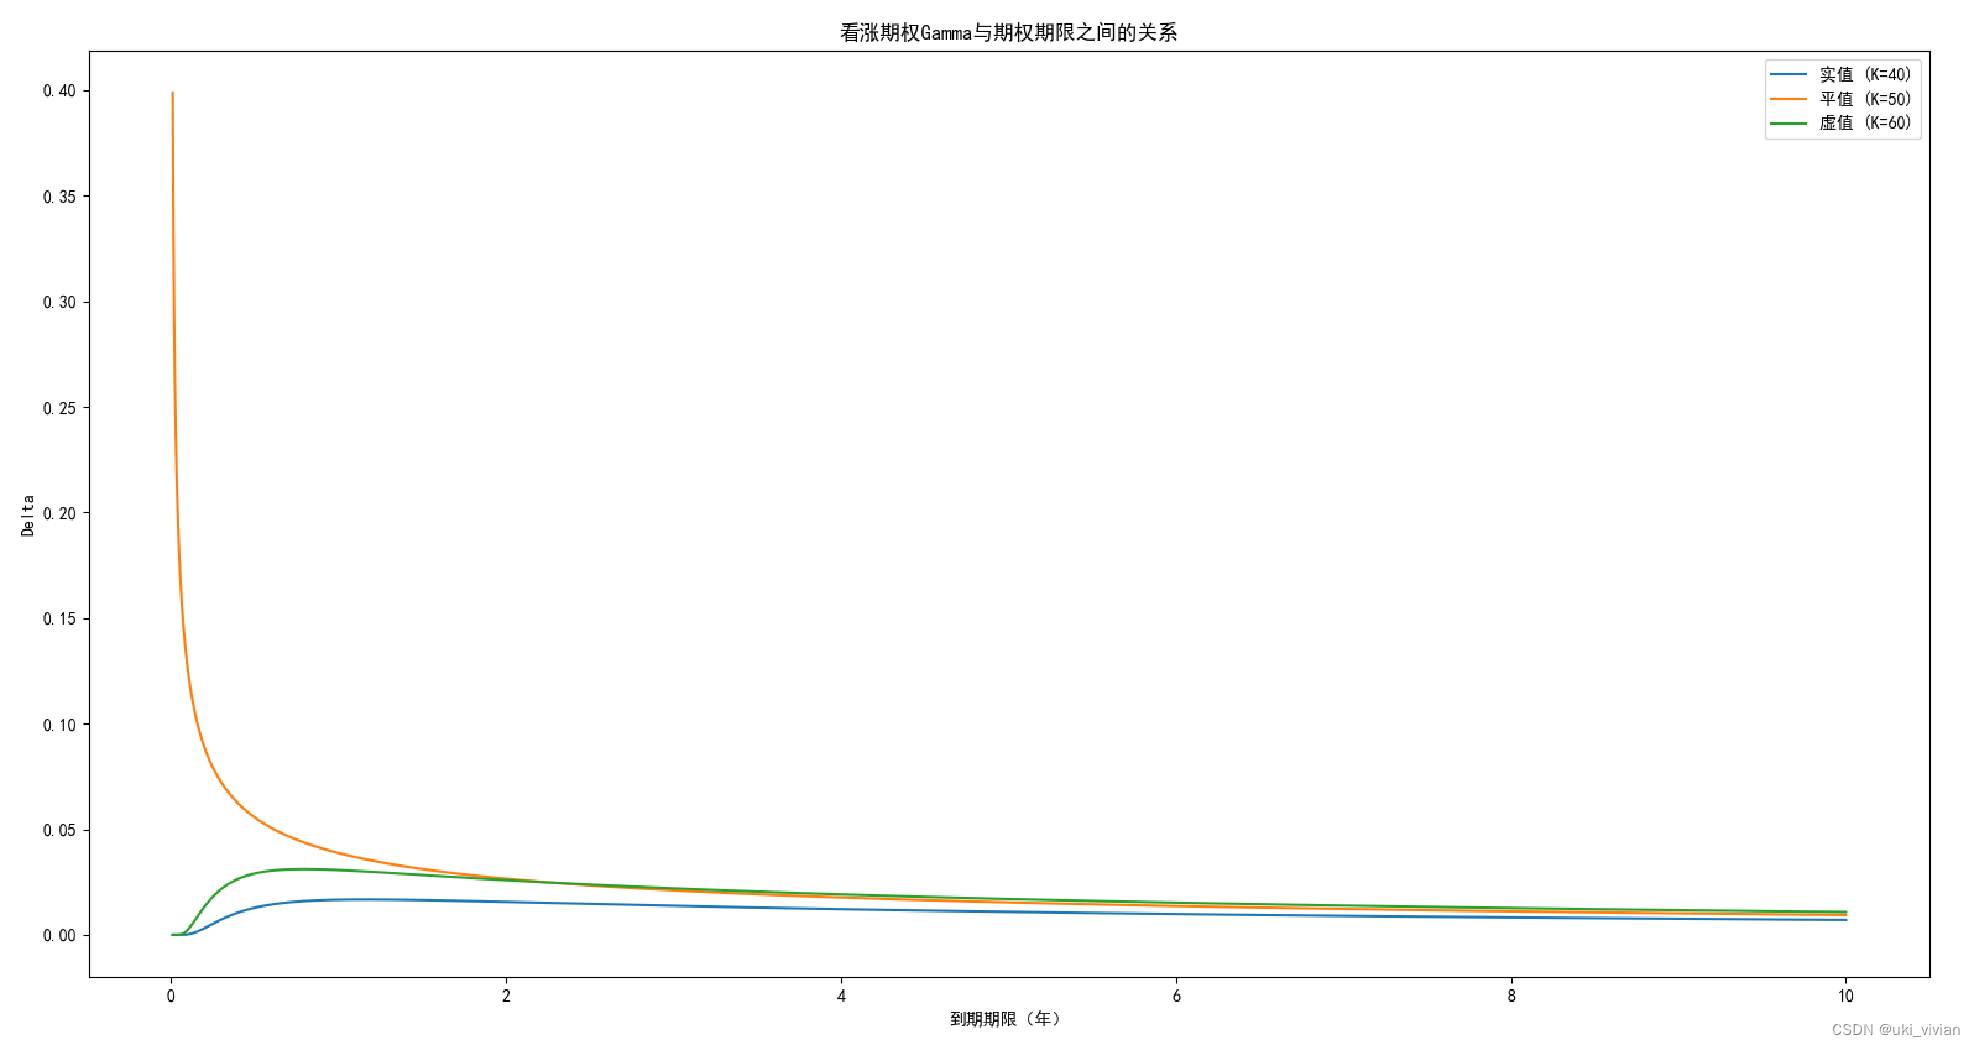
Gamma是衡量期权合约Delta相对于标的价格变动的敏感度,也可理解为期权价格对标的价格的二阶导数。
看涨期权Gamma>0, 1) 标的价格上涨,看涨期权Delta上涨; 2) 标的价格下降,看涨期权Delta下降。
看跌期权Gamma>0, 1) 标的价格上涨,看跌期权Delta上涨; 2) 标的价格下降,看跌期权Delta下降。
图形
import numpy as np
import matplotlib.pyplot as plt

S0=50
K=50
r=0.03
q=0.01
T=1
sigma=0.2

##### Call Option Gamma #####
Sx = np.arange(0.01, 100, 1)
Gamma_Sx = gamma(Sx, K, r, q, T, sigma, True)

plt.rcParams['font.sans-serif']=['SimHei']
plt.subplot(1, 2, 1)
plt.plot(Sx, Gamma_Sx)
plt.xlabel('股票价格')
plt.ylabel('Gamma')
plt.title('Call option Gamma')


##### Put Option Gamma #####
Sx = np.arange(0.01, 100, 1)
Gamma_Sx = gamma(Sx, K, r, q, T, sigma, False)

plt.subplot(1, 2, 2)
plt.plot(Sx, Gamma_Sx)
plt.xlabel('股票价格')
plt.ylabel('Gamma')
plt.title('Put option Gamma')
plt.show()


##### 看涨期权Gamma & 期权期限 #####
ITM = 40
ATM = 50
OTM = 60
Tx = np.arange(0.01, 10, 0.001)
Gamma_Tx_ITM = gamma(S0, ITM, r, q, Tx, sigma, True)
Gamma_Tx_ATM = gamma(S0, ATM, r, q, Tx, sigma, True)
Gamma_Tx_OTM = gamma(S0, OTM, r, q, Tx, sigma, True)

plt.rcParams['font.sans-serif']=['SimHei']
plt.plot(Tx, Gamma_Tx_ITM, label='实值 (K=40)')
plt.plot(Tx, Gamma_Tx_ATM, label='平值 (K=50)')
plt.plot(Tx, Gamma_Tx_OTM, label='虚值 (K=60)')
# plt.axis([0, 10, 0, 1])
plt.xlabel('到期期限(年)')
plt.ylabel('Delta')
plt.title('看涨期权Gamma与期权期限之间的关系')
plt.legend()
plt.show()
Theta
定义
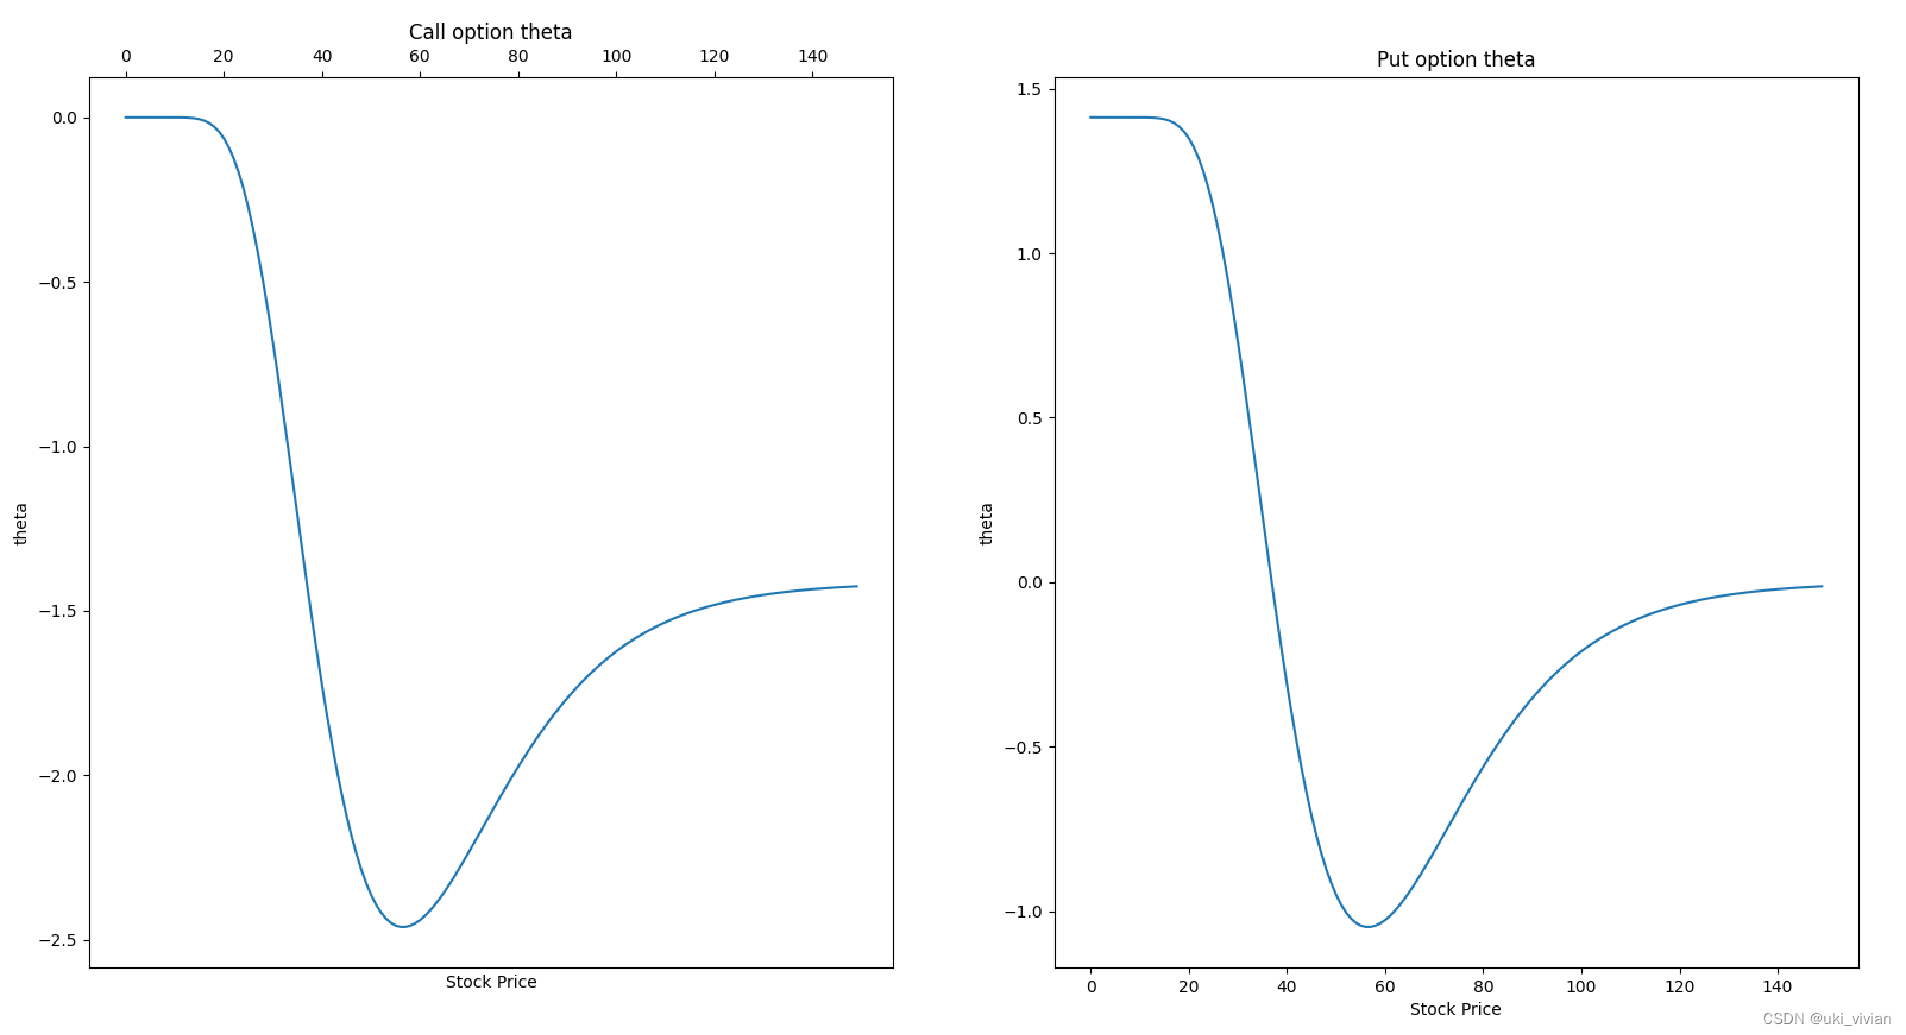
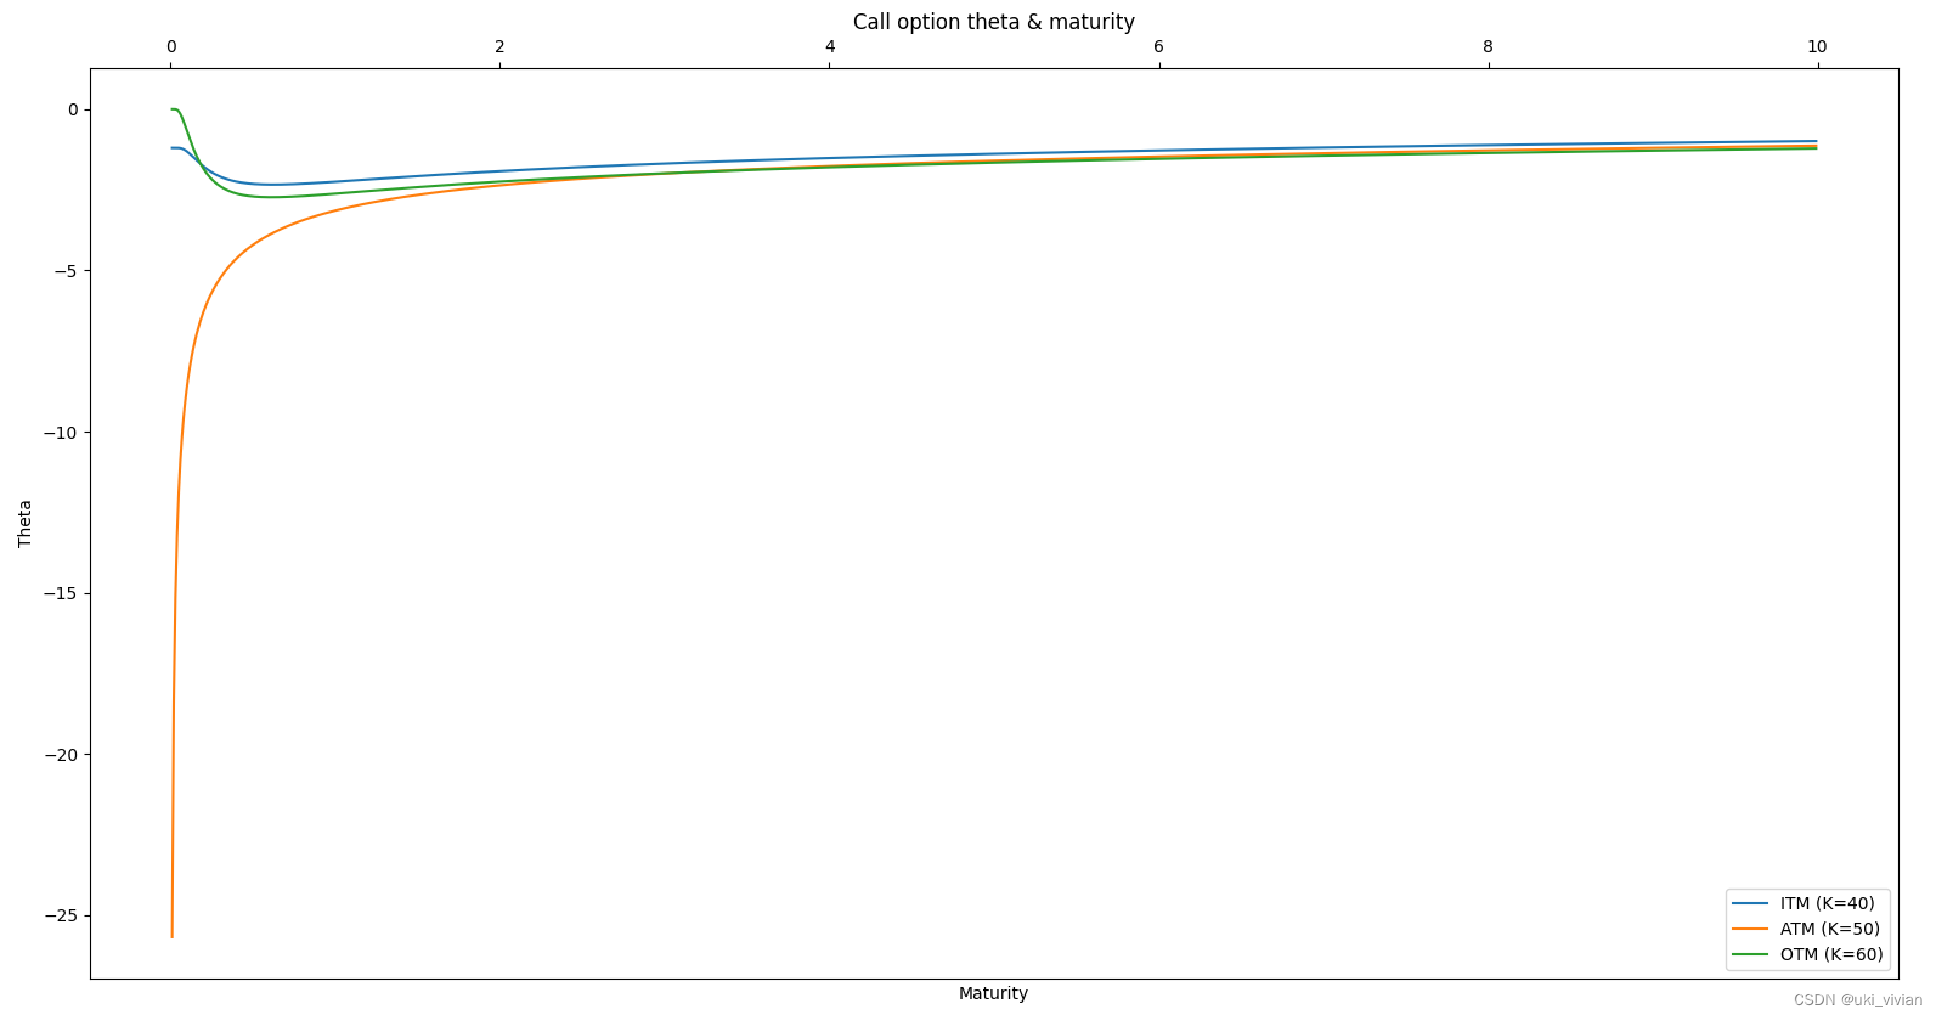
Theta指期权价格对于时间流逝的敏感度,即期权价格对于时间的一阶导数。
图形
期权Theta一般是负的(反例包括无股息股票上实值看跌期权),因为在其他条件不变的情况下,随着期限的减小,期权的价格会降低。
import numpy as np
import matplotlib.pyplot as plt

S0=50
K=50
r=0.03
q=0
T=2
sigma=0.25

Sx = np.arange(0.01, 150, 1)
fig = plt.figure()

##### Call Option Theta #####
Theta_Sx_1 = theta(Sx, K, r, q, T, sigma, True)

ax1 = fig.add_subplot(121)
ax1.tick_params(top=True, labeltop=True, bottom=False, labelbottom=False)
ax1.plot(Sx, Theta_Sx_1)
ax1.set_xlabel('Stock Price')
ax1.set_ylabel('theta')
ax1.set_title('Call option theta')


##### Put Option Theta #####
Theta_Sx_2 = theta(Sx, K, r, q, T, sigma, False)

ax2 = fig.add_subplot(122)
# ax2.tick_params(top=True, labeltop=True, bottom=False, labelbottom=False)
ax2.plot(Sx, Theta_Sx_2)
ax2.set_xlabel('Stock Price')
ax2.set_ylabel('theta')
ax2.set_title('Put option theta')
plt.show()


##### Call option Theta & Maturity #####
ITM = 40
ATM = 50
OTM = 60
Tx = np.arange(0.01, 10, 0.01)
Theta_Tx_ITM = theta(S0, ITM, r, q, Tx, sigma, True)
Theta_Tx_ATM = theta(S0, ATM, r, q, Tx, sigma, True)
Theta_Tx_OTM = theta(S0, OTM, r, q, Tx, sigma, True)

fig2 = plt.figure()
ax3 = fig2.add_subplot(111)
ax3.tick_params(top=True, labeltop=True, bottom=False, labelbottom=False)
ax3.plot(Tx, Theta_Tx_ITM, label='ITM (K=40)')
ax3.plot(Tx, Theta_Tx_ATM, label='ATM (K=50)')
ax3.plot(Tx, Theta_Tx_OTM, label='OTM (K=60)')
ax3.set_xlabel('Maturity')
ax3.set_ylabel('Theta')
ax3.set_title('Call option theta & maturity')

plt.legend()
plt.show()
Vega
定义
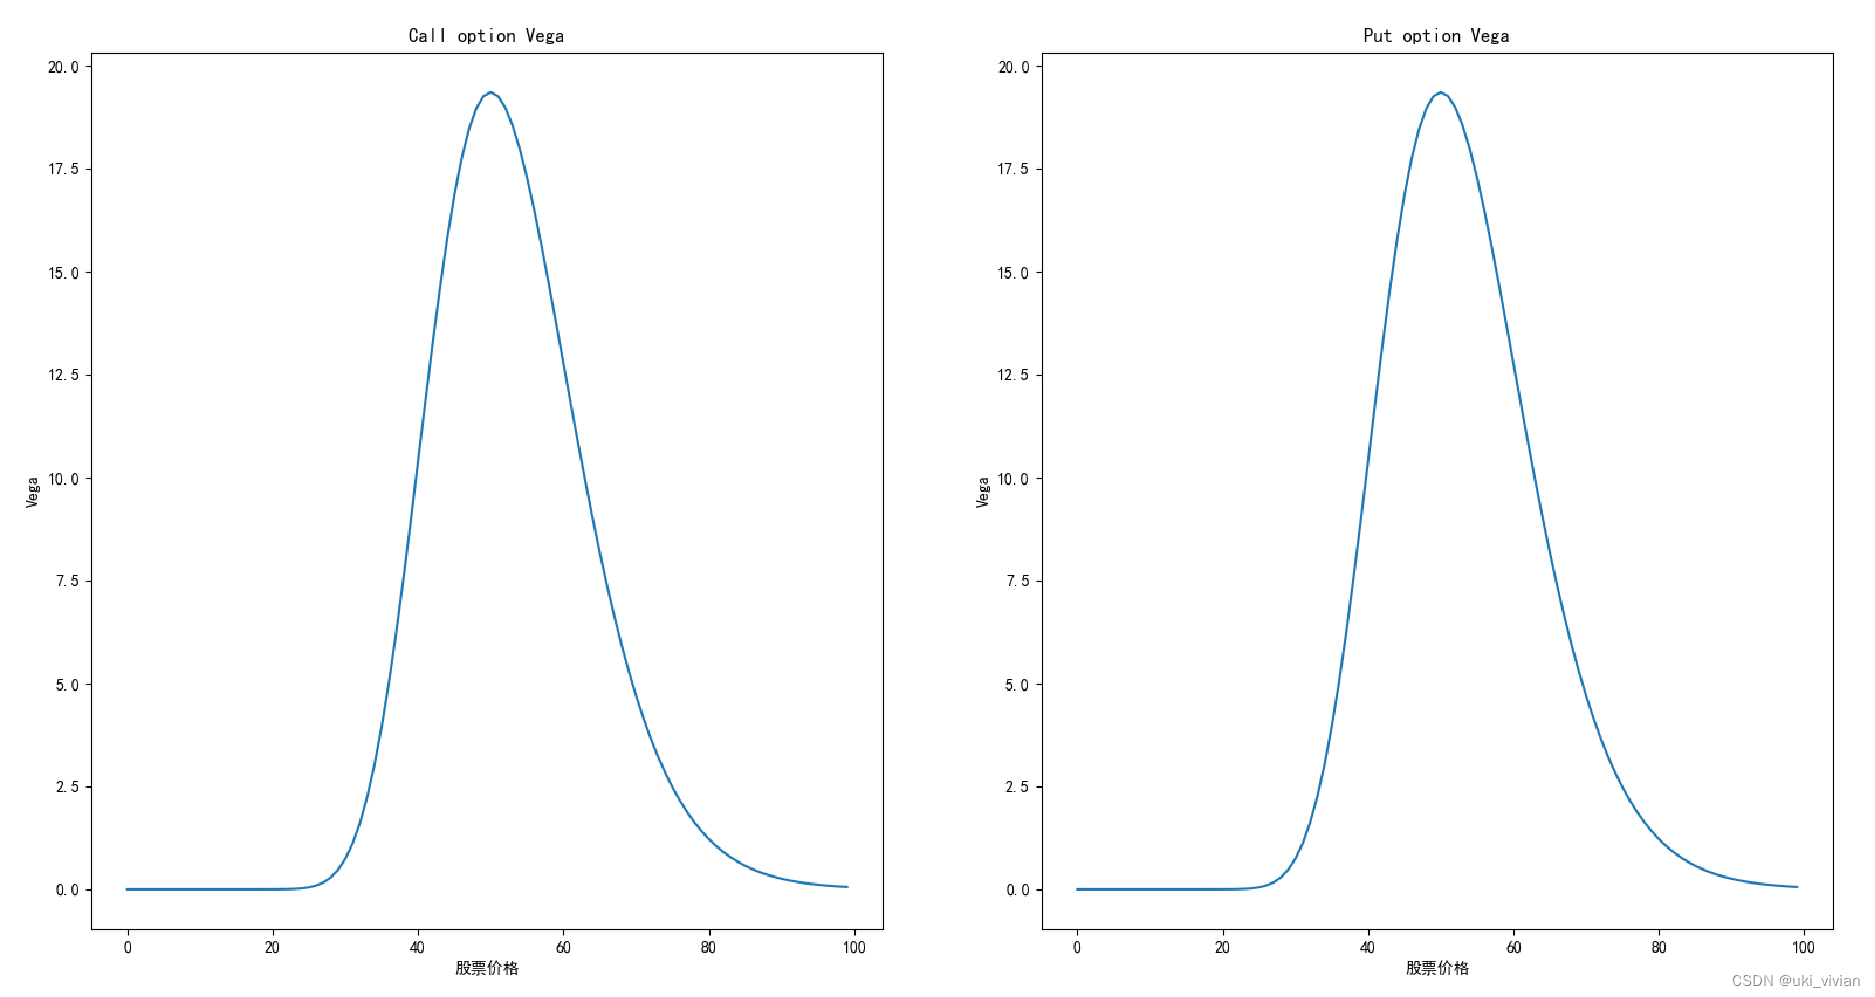
Vega指期权价格对于波动率的敏感度,即期权价格对于波动率的一阶导数。
看涨期权Vega>0,1) 波动率上升,看涨期权价格上升;2) 波动率下降,看涨期权价格下降。
看跌期权Vega>0,1) 波动率上升,看跌期权价格上升;2) 波动率下降,看跌期权价格下降。
图形
看涨期权和看跌期权的Vega公式一致。
import numpy as np
import matplotlib.pyplot as plt

S0=50
K=50
r=0.03
q=0.01
T=1
sigma=0.2

##### Call Option Vega #####
Sx = np.arange(0.01, 100, 1)
Vega_Sx = vega(Sx, K, r, q, T, sigma, True)

plt.rcParams['font.sans-serif']=['SimHei']
plt.subplot(1, 2, 1)
plt.plot(Sx, Vega_Sx)
plt.xlabel('股票价格')
plt.ylabel('Vega')
plt.title('Call option Vega')


##### Put Option Vega #####
Sx = np.arange(0.01, 100, 1)
Vega_Sx = vega(Sx, K, r, q, T, sigma, False)

plt.subplot(1, 2, 2)
plt.plot(Sx, Vega_Sx)
plt.xlabel('股票价格')
plt.ylabel('Vega')
plt.title('Put option Vega')
plt.show()
Rho
定义
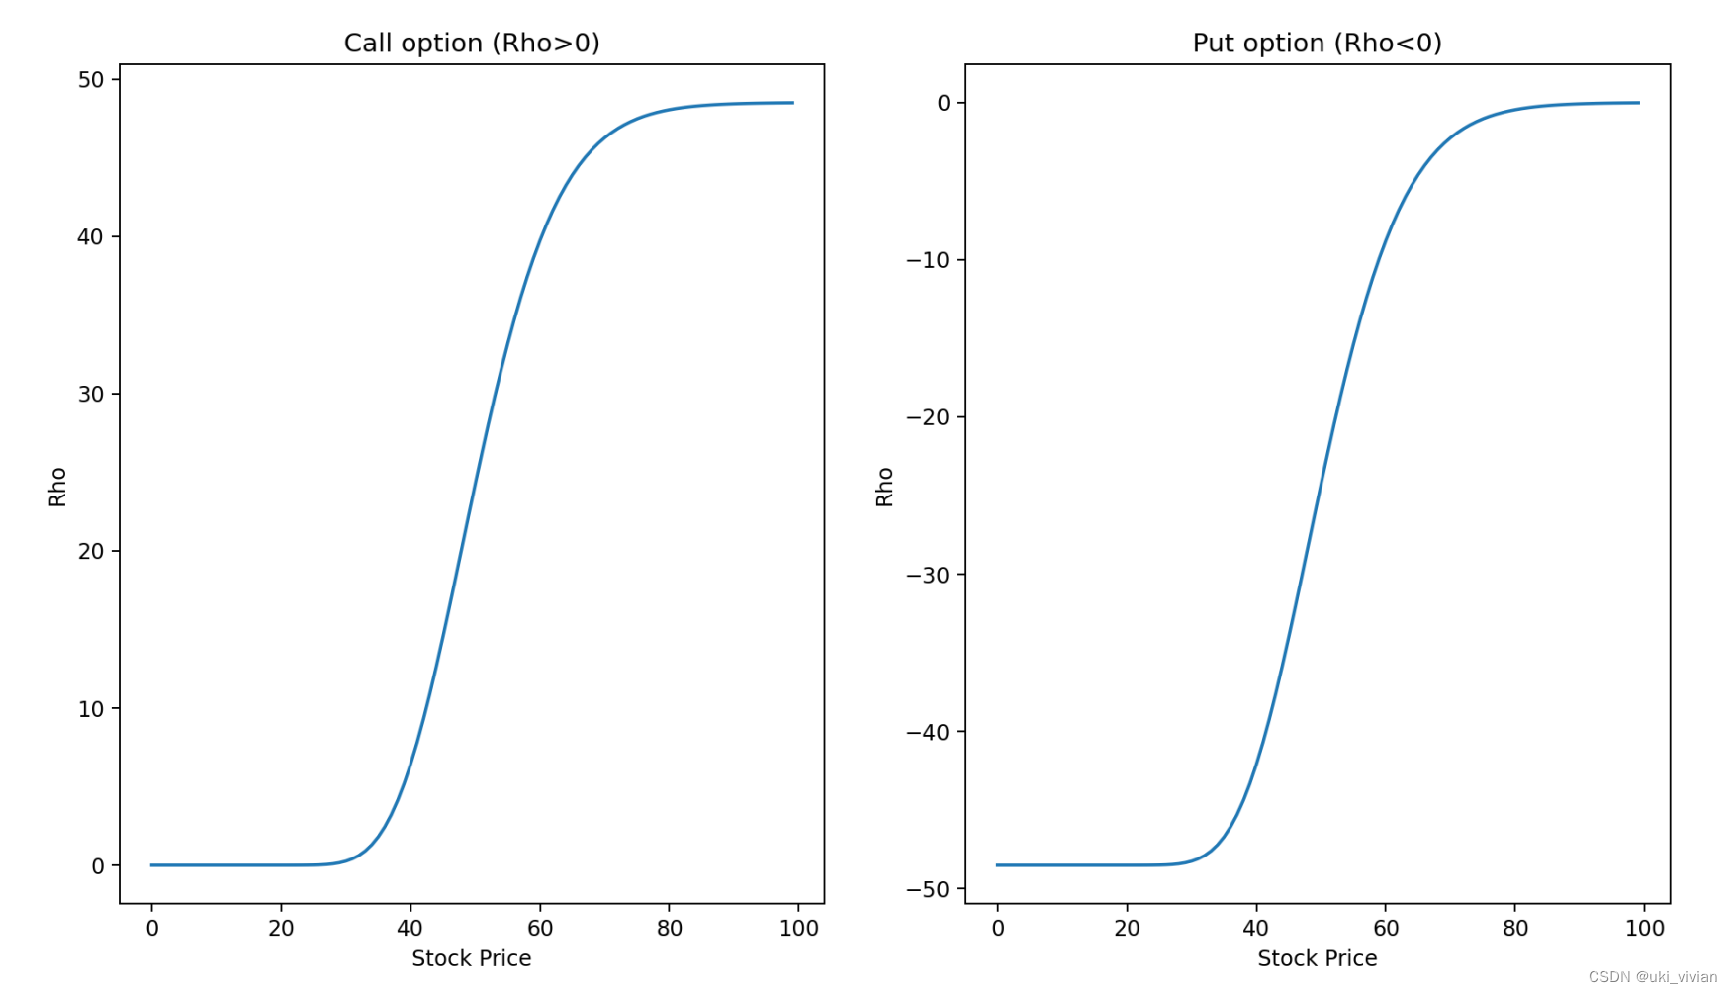
Rho指期权价格对于利率的敏感度,即期权价格对于利率的一阶导数。
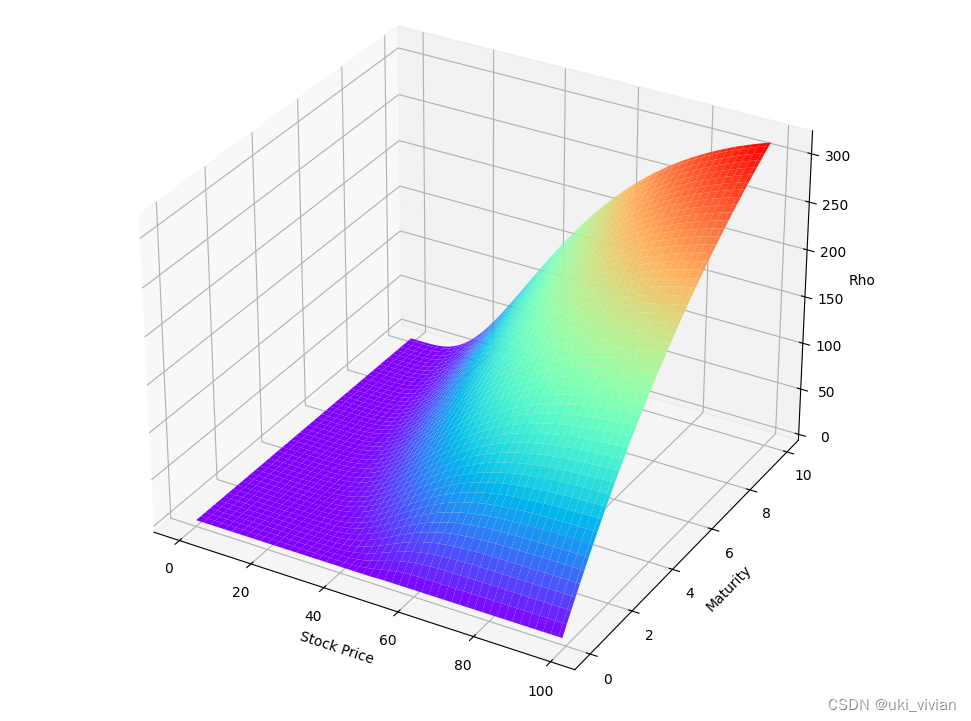
看涨期权Rho>0。1) 利率上升,期权价格上升。2) 利率下降,期权价格下降。
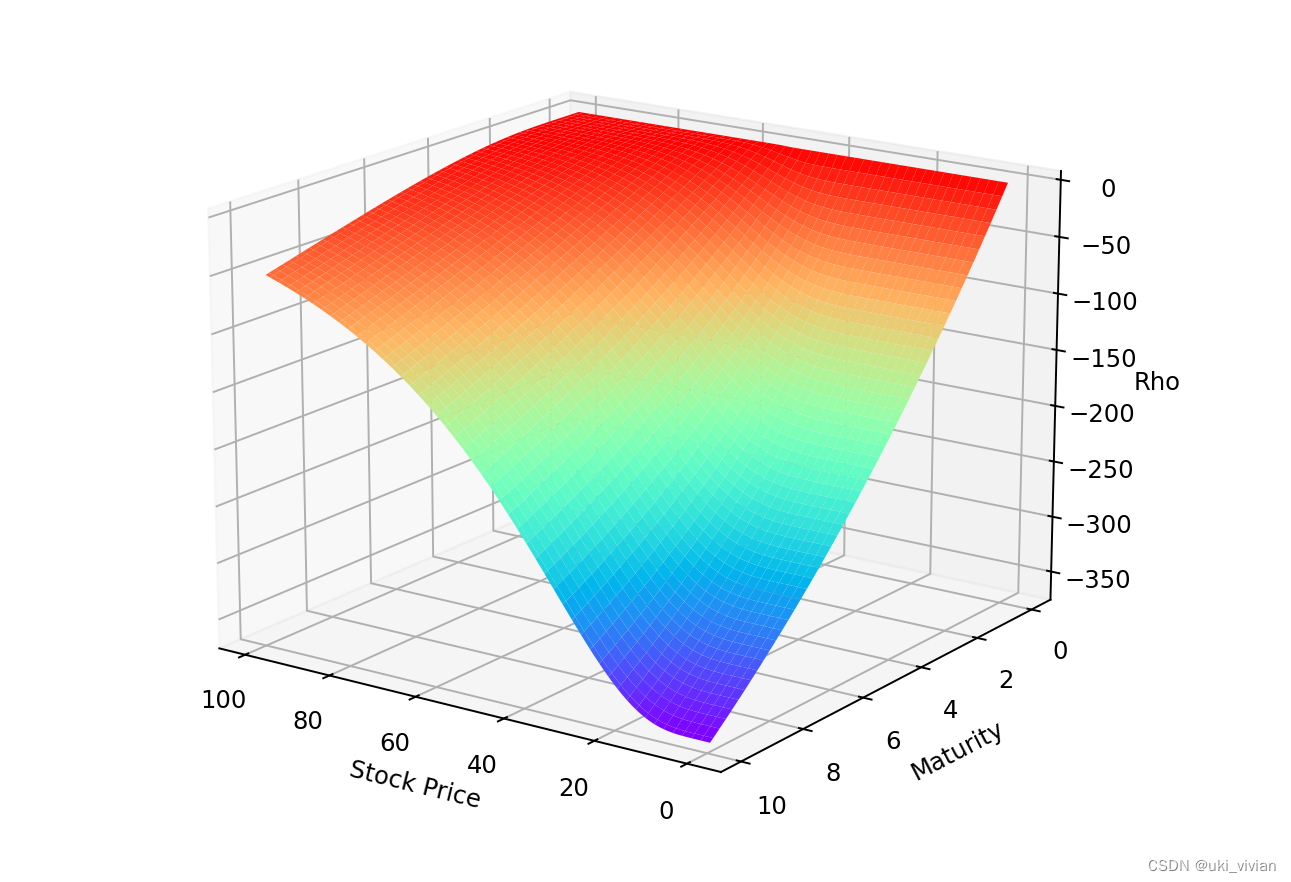
看跌期权Rho<0。1) 利率上升,期权价格下降。2) 利率下降,期权价格上升。
图形
看涨期权
实值期权Rho较大,期权价格受利率影响较大。
虚值期权Rho较小,期权价格受利率影响较小。
剩余期限越长,Rho越大
看跌期权
实值期权Rho的绝对值较大,即期权价格受利率影响较大。
虚值期权Rho的绝对值较小,即期权价格受利率影响较小。
剩余期限越长,Rho的绝对值越大。
import numpy as np
import matplotlib.pyplot as plt

S0=50
K=50
r=0.03
q=0.01
T=1
sigma=0.2


##### Call Option Rho #####
Sx = np.arange(0.01, 100, 1)
Rho_Sx = rho(Sx, K, r, q, T, sigma, True)

plt.subplot(1, 2, 1)
plt.plot(Sx, Rho_Sx)
plt.xlabel('Stock Price')
plt.ylabel('Rho')
plt.title('Call option (Rho>0)')


##### Put Option Rho #####
Sx = np.arange(0.01, 100, 1)
Rho_Sx = rho(Sx, K, r, q, T, sigma, False)

plt.subplot(1, 2, 2)
plt.plot(Sx, Rho_Sx)
plt.xlabel('Stock Price')
plt.ylabel('Rho')
plt.title('Put option (Rho<0)')
# plt.show()


# call option rho
Tx = np.arange(0.01, 10, 0.1)
Sx = np.arange(0.01, 100, 1)
SS, TT = np.meshgrid(Sx, Tx)

Rho_Sx = rho(SS, K, r, q, TT, sigma, True)


fig = plt.figure()
ax1 = plt.axes(projection='3d')
ax1.plot_surface(SS, TT, Rho_Sx, cmap='rainbow')
ax1.set_xlabel('Stock Price')
ax1.set_ylabel('Maturity')
ax1.set_zlabel('Rho')
plt.show()


# put option rho
Tx = np.arange(0.01, 10, 0.1)
Sx = np.arange(0.01, 100, 1)
SS, TT = np.meshgrid(Sx, Tx)

Rho_Sx_put = rho(SS, K, r, q, TT, sigma, False)

fig2 = plt.figure()
ax2 = plt.axes(projection='3d')
ax2.plot_surface(SS, TT, Rho_Sx_put, cmap='rainbow')
ax2.set_xlabel('Stock Price')
ax2.set_ylabel('Maturity')
ax2.set_zlabel('Rho')
plt.show()


 8208
8208

 被折叠的 条评论
为什么被折叠?


