


python 机器学习库
Because of the buzz around artificial intelligence bias, organizations are increasingly in need of an explanation of both the predictions of the models being created and how they work.
由于围绕人工智能偏差的嗡嗡声,组织越来越需要对正在创建的模型的预测以及它们如何工作的解释。
Fortunately, there are a growing number of libraries that the Python programming language offers to solve this problem. Below is a quick guide to four popular libraries for interpreting and explaining machine learning models. Installed with use pip, supplied with detailed documentation, and emphasizes visual interpretation.
幸运的是,Python编程语言提供了越来越多的库来解决此问题。 以下是四个常用库的快速指南,这些库用于解释和解释机器学习模型。 与use pip一起安装,提供详细的文档,并强调视觉解释。
黄砖 (Yellowbrick)
This Python library and extension to the scikit-learn package. Provides some useful and cute visualizations for machine learning models. The renderer objects, the main interface are scikit-learn evaluations, so if you are used to working with scikit-learn, the workflow will seem familiar.
此Python 库和scikit-learn包的扩展。 为机器学习模型提供一些有用而可爱的可视化。 渲染器对象的主要界面是scikit-learn评估,因此,如果您习惯使用scikit-learn,工作流程将看起来很熟悉。
The visualizations provided cover model selection, feature significance determination, and model performance analysis. Let’s walk through a few quick examples.
可视化提供了封面模型选择,特征重要性确定和模型性能分析。 让我们来看几个简单的例子。
The library is installed with pip:
该库是通过pip安装的:
pip install yellowbrickTo illustrate a couple of functionalities, we will use a scikit-learn dataset called wine recognition. This dataset with 13 features and 3 target classes is loaded directly from the scikit-learn library. In the code below, we import the dataset and convert it to an object DataFrame. The classifier is able to use the information without preliminary processing.
为了说明几个功能,我们将使用一个名为酒识别的scikit-learn数据集。 该数据集具有13个要素和3个目标类,可直接从scikit-learn库中加载。 在下面的代码中,我们导入数据集并将其转换为对象DataFrame 。 分类器无需预先处理即可使用信息。
import pandas as pd
from sklearn import datasets
wine_data = datasets.load_wine()
df_wine = pd.DataFrame(wine_data.data,columns=wine_data.feature_names)
df_wine['target'] = pd.Series(wine_data.target)
Use scikit-learn to further split your dataset into validation and training:
使用scikit-learn将您的数据集进一步分为验证和培训:
from sklearn.model_selection import train_test_split
X = df_wine.drop(['target'], axis=1)
y = df_wine['target']
X_train, X_test, y_train, y_test = train_test_split(X, y, test_size=0.2)
In the next step, use the Yellowbricks visualizer to view the correlations between features in the dataset.
下一步,使用Yellowbricks可视化工具查看数据集中要素之间的相关性。
from yellowbrick.features import Rank2D
import matplotlib.pyplot as plt
visualizer = Rank2D(algorithm="pearson",  size=(1080, 720))
visualizer.fit_transform(X_train)
visualizer.poof()
Now let’s tweak RandomForestClassifierand evaluate performance using another renderer:
现在让我们调整RandomForestClassifier并使用另一个渲染器评估性能:
from yellowbrick.classifier import ClassificationReport
from sklearn.ensemble import RandomForestClassifier
model =  RandomForestClassifier()
visualizer = ClassificationReport(model, size=(1080, 720))
visualizer.fit(X_train, y_train)
visualizer.score(X_test, y_test)
visualizer.poof()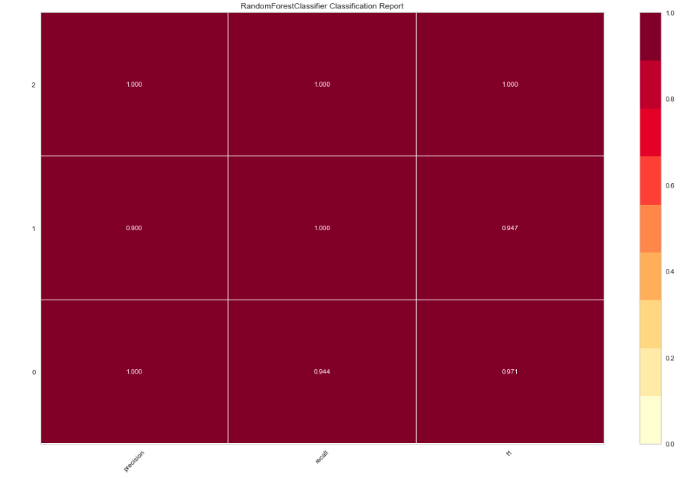
5级 (ELI5)
ELI5 is another visualization library that comes in handy for debugging machine learning models and explaining the predictions made. Works with the most common Python machine learning tools including scikit-learn, XGBoost, and Keras.
ELI5是另一个可视化库,可用于调试机器学习模型并解释所作的预测。 与最常见的Python机器学习工具配合使用,包括scikit-learn,XGBoost和Keras。
Use ELI5 to test the significance of the features of the model discussed above:
使用ELI5来测试上述模型的功能的重要性:
import eli5
eli5.show_weights(model, feature_names = X.columns.tolist())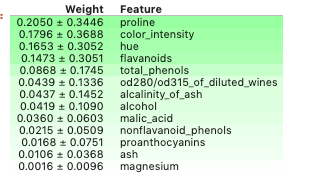
By default, the method show_weightsuses gainto calculate the weight, and when other types are needed, add an argument importance_type.
默认情况下,该方法show_weights用途gain计算权重,并且需要其它类型的情况下,添加一个参数importance_type 。
And also use show_predictionto test the basis of individual predictions.
并且还使用show_prediction来测试各个预测的基础。

酸橙 (LIME)
LIME stands for Local Interpreted, Model Independent Explanations. Interprets predictions made by machine learning algorithms. Lime supports explaining unit predictions from a range of classifiers and also interacts with scikit-learn out of the box.
LIME代表本地解释的,模型独立的解释。 解释机器学习算法做出的预测。 Lime支持解释来自多个分类器的单元预测,并且还可以直接与scikit-learn交互。
Let’s use Lime to interpret the predictions of the model we trained earlier.
让我们使用Lime解释我们之前训练的模型的预测。
Install the library via pip:
通过pip安装库:
pip install limeFirst, let’s create an interpreter. To do this, we take the training dataset as an array from the names of the features used in the model and the class names in the target variable.
首先,让我们创建一个解释器。 为此,我们将训练数据集作为模型中使用的要素名称和目标变量中的类名称的数组。
import lime.lime_tabular
explainer = lime.lime_tabular.LimeTabularExplainer(X_train.values,
feature_names=X_train.columns.values.tolist(),
class_names=y_train.unique())
Then we create a lambda function that takes a model to predict a sample of data. The line was taken from the detailed tutorial on Lime.
然后,我们创建一个lambda函数,该函数采用模型来预测数据样本。 该行摘自有关Lime的详细教程 。
predict_fn = lambda x: model.predict_proba(x).astype(float)Use an interpreter to explain the forecast on a sampled sample. You will see the result below. Lime creates visualizations that show how the traits contributed to a particular prediction.
使用口译员来解释抽样样本的预测。 您将在下面看到结果。 Lime创建了可视化效果,以显示这些特性如何对特定的预测做出了贡献。
exp = explainer.explain_instance(X_test.values[0], predict_fn, num_features=6)
exp.show_in_notebook(show_all=False)
MLxtend (MLxtend)
In the library, you will find a lot of support functions for machine learning. It covers stacking and voting classifiers, model evaluation, feature extraction, and design and charting. In addition to the documentation to help with the Python library, we recommend reading the in-depth material.
在该库中 ,您将找到许多用于机器学习的支持功能。 它涵盖堆叠和投票分类器,模型评估,特征提取以及设计和制图。 除了帮助Python库的文档外,我们建议您阅读深入的材料 。
Let’s turn to MLxtend to compare the decision bounds of the voting classifier and the composite classifier.
让我们转向MLxtend,比较投票分类器和复合分类器的决策范围。
You will need it again pipfor installation.
您将需要再次pip进行安装。
pip install mlxtendSee below for used imports.
二手进口见下文。
from mlxtend.plotting import plot_decision_regions
from mlxtend.classifier import EnsembleVoteClassifier
import matplotlib.gridspec as gridspec
import itertools
from sklearn import model_selection
from sklearn.linear_model import LogisticRegression
from sklearn.naive_bayes import GaussianNB
from sklearn.ensemble import RandomForestClassifier
The following visualization only works with two features at the same time, so first let’s create an array with properties prolineand color_intensity. Chose these traits because of the greatest weight compared to those tested above using ELI5.
以下可视化只能同时使用两个功能,因此首先让我们创建一个具有属性proline和color_intensity的数组。 选择这些特征的原因是,与使用ELI5进行上述测试相比,这些特征的重量最大。
X_train_ml = X_train[['proline', 'color_intensity']].values
y_train_ml = y_train.values
Then we create classifiers, fit them to the training data and get a visualization of decision boundaries using MLxtend. The result is below the code.
然后,我们创建分类器,使它们适合训练数据,并使用MLxtend可视化决策边界。 结果在代码下方。
clf1 = LogisticRegression(random_state=1)
clf2 = RandomForestClassifier(random_state=1)
clf3 = GaussianNB()
eclf = EnsembleVoteClassifier(clfs=[clf1, clf2, clf3], weights=[1,1,1])
value=1.5
width=0.75
gs = gridspec.GridSpec(2,2)
fig = plt.figure(figsize=(10,8))
labels = ['Logistic Regression', 'Random Forest', 'Naive Bayes', 'Ensemble']
for clf, lab, grd in zip([clf1, clf2, clf3, eclf],
                         labels,
                         itertools.product([0, 1], repeat=2)):

    clf.fit(X_train_ml, y_train_ml)
    ax = plt.subplot(gs[grd[0], grd[1]])
    fig = plot_decision_regions(X=X_train_ml, y=y_train_ml, clf=clf)
    plt.title(lab)
This does not end with the list of libraries for interpreting, explaining, and visualizing machine learning models that a Python developer uses. Try other useful tools from a long list as well.
这并不以用于解释,解释和可视化Python开发人员使用的机器学习模型的库列表结尾。 从长期尝试其他有用的工具清单,以及 。
python 机器学习库


 1207
1207

 被折叠的 条评论
为什么被折叠?
被折叠的 条评论
为什么被折叠?
 到【灌水乐园】发言


