


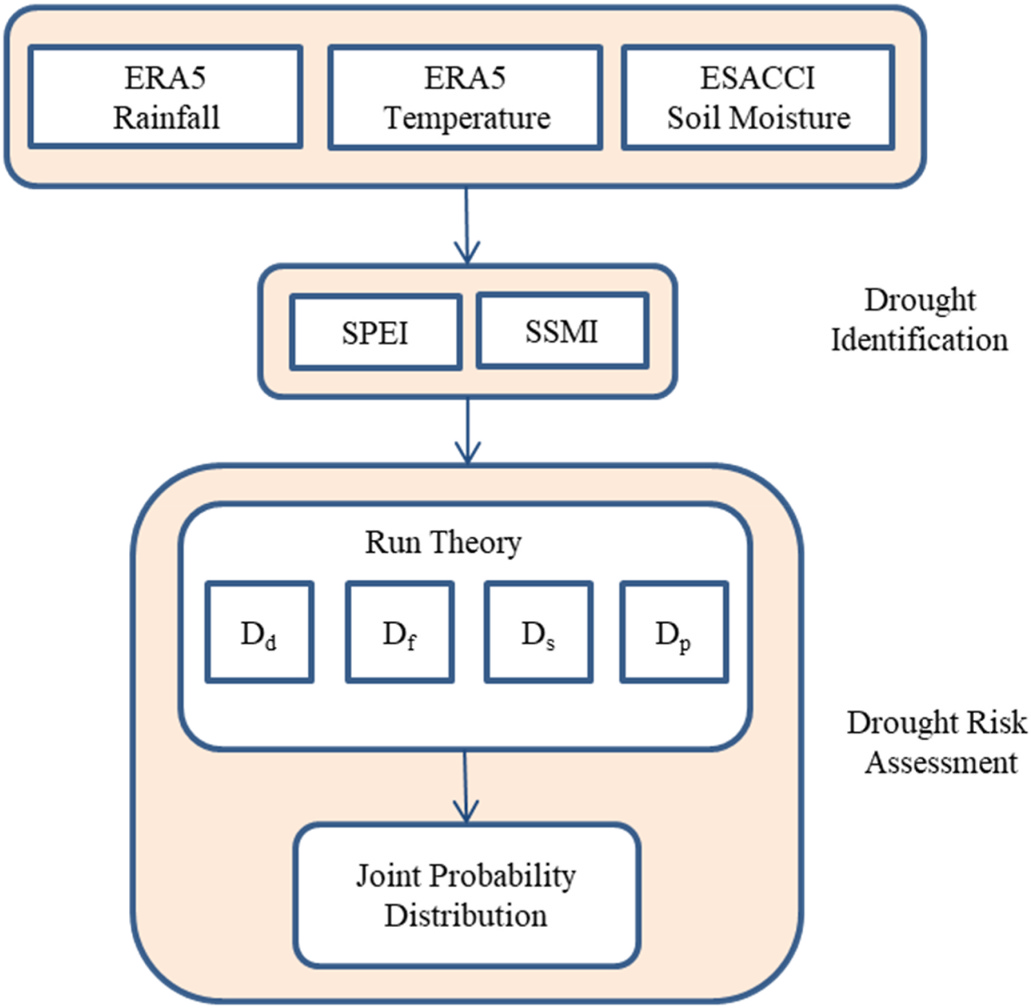
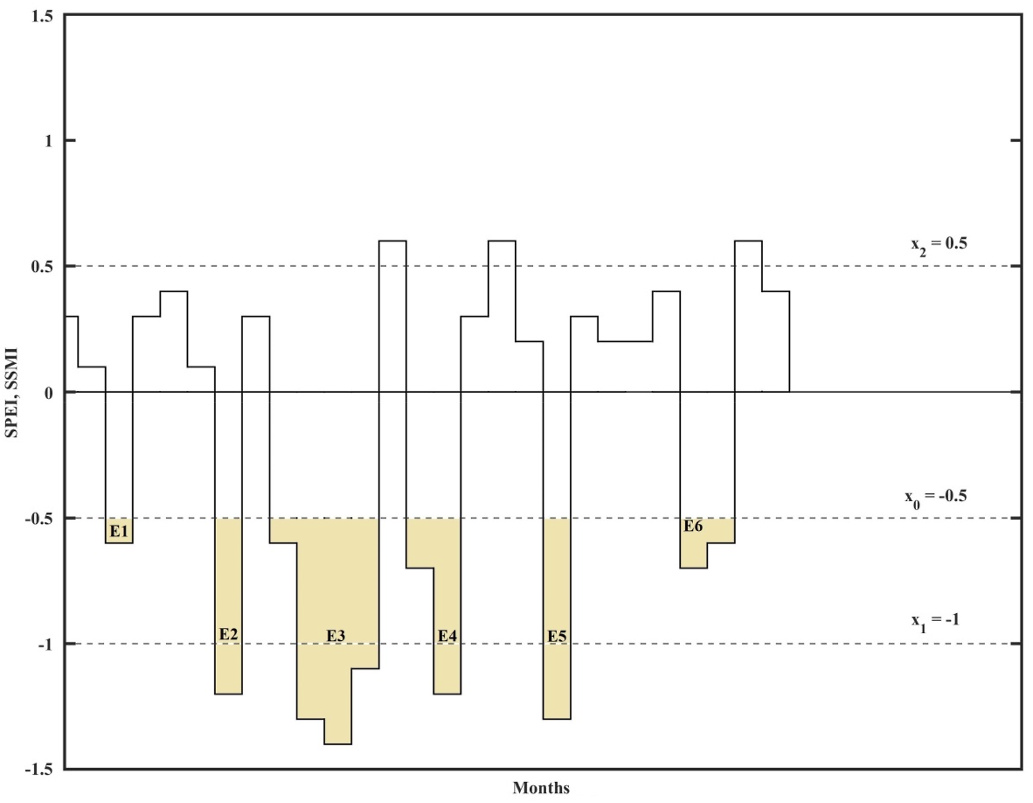
Drought events and its associated characteristics, encompassing drought duration (Dd), frequency (Df), intensity (Ds), and peak (Dp) are determined through the application of the run theory [32]. The Run Theory is a statistical method used to identify and analyse drought events based on predefined thresholds applied to time series data of drought indices, such as the SSMI and the SPEI. This approach allows us to systematically detect periods of drought by observing when the index values fall below specific threshold levels, indicating a deviation from normal SM/rainfall conditions. In this study, we implement a three-threshold system to capture a nuanced spectrum of drought conditions and the methodology for identifying drought events using the SSMI and SPEI time series is visually depicted in Fig. 3. The three thresholds chosen are: x0 = ¶ 0.5,x1 = ¶ 1 and x2 = 0.5, where x0, x1 and x2 represent the values of the SSMI and SPEI [10]. proposed this multi threshold approach which was later used by Ref. [17,33]; and using these thresholds, the drought events are identified as follow: 1st Step: Examine whether the monthly value of SSMI or SPEI is below x0. A value below x0, indicates the drought occurrence, marking it as a potential event. Consequently, the events E1 to E6 are identified in this step as illustrated in Fig. 2.
2nd Step: From the screened ones in previous step E1 to E6, eliminate events those lasting for only one month and not reaching the threshold x1. For instance, E1 is a minor event and is excluded from further analysis. Consequently, E2 to E6 are retained for subsequent steps.
3rd Step: Merge adjacent events with an interval of 1 month but not reaching the x2, into a singular event. In this step, E2 and E3 are consolidated into a unified event.
干旱事件及其相关特征,包括干旱持续时间(Dd)、频率(Df)、强度(Ds)和峰值(Dp),都是通过应用径流理论确定的[32]。Run Theory是一种用于识别和分析干旱事件的统计方法,该方法基于预定义的阈值,应用于干旱指数(如SSMI和SPEI)的时间序列数据。这种方法允许我们通过观察指数值何时低于特定阈值水平来系统地检测干旱时期,这表明偏离正常的SM/降雨条件。在本研究中,我们实施了一个三阈值系统来捕捉干旱条件的细微谱,使用SSMI和SPEI时间序列识别干旱事件的方法如图3所示。选择的三个阈值分别为:x0 =¶0.5,x1 =¶1和x2 = 0.5,其中x0, x1和x2分别代表SSMI和SPEI的值[10]。提出了这种多阈值方法,后来被文献[17,33]采用;并利用这些阈值对干旱事件进行如下识别:第一步:检查SSMI或SPEI的月值是否低于x0。低于x0的值表示发生干旱,将其标记为潜在事件。因此,在此步骤中识别事件E1到E6,如图2所示。
第二步:从前一步E1到E6筛选的事件中,剔除仅持续一个月且未达到阈值x1的事件。例如,E1是一个次要事件,不包括在进一步的分析中。因此,为后续步骤保留E2到E6。
第三步:将间隔为1个月但未达到x2的相邻事件合并为单个事件。在此步骤中,将E2和E3合并为一个统一的事件。
As a result, based on the above three steps, the identified drought events from Fig. 2 coalesce into E2-E3, E4, E5, and E6, totaling 4 distinct drought events. Following the identification of the drought events the associated Dd, Df, Ds and Dp are ascertained. The Average Annual Drought Frequency is computed by dividing the total number of drought events in the study period by the number of years. The Dd for a individual event is defined as the temporal span between its start and end time. The Average Annual Drought Duration is calculated by dividing the collective duration in months of all drought events by the total number of years. The Di for each drought event is calculated as the sum of SSMI/SPEI values divided by the duration of that particular drought event. Dp at each grid is pinpointed as the smallest SPEI value throughout the entire time period.
因此,根据上述三个步骤,从图2中识别的干旱事件合并为E2-E3、E4、E5和E6,共4个不同的干旱事件。在确定干旱事件之后,确定了相关的Dd、Df、Ds和Dp。平均年干旱频率的计算方法是将研究期间的干旱事件总数除以年数。单个事件的Dd定义为其开始时间和结束时间之间的时间跨度。平均年干旱持续时间的计算方法是将所有干旱事件的总持续时间(以月为单位)除以年总数。每个干旱事件的Di计算为SSMI/SPEI值的总和除以该特定干旱事件的持续时间。每个网格上的Dp被确定为整个时间段内最小的SPEI值。
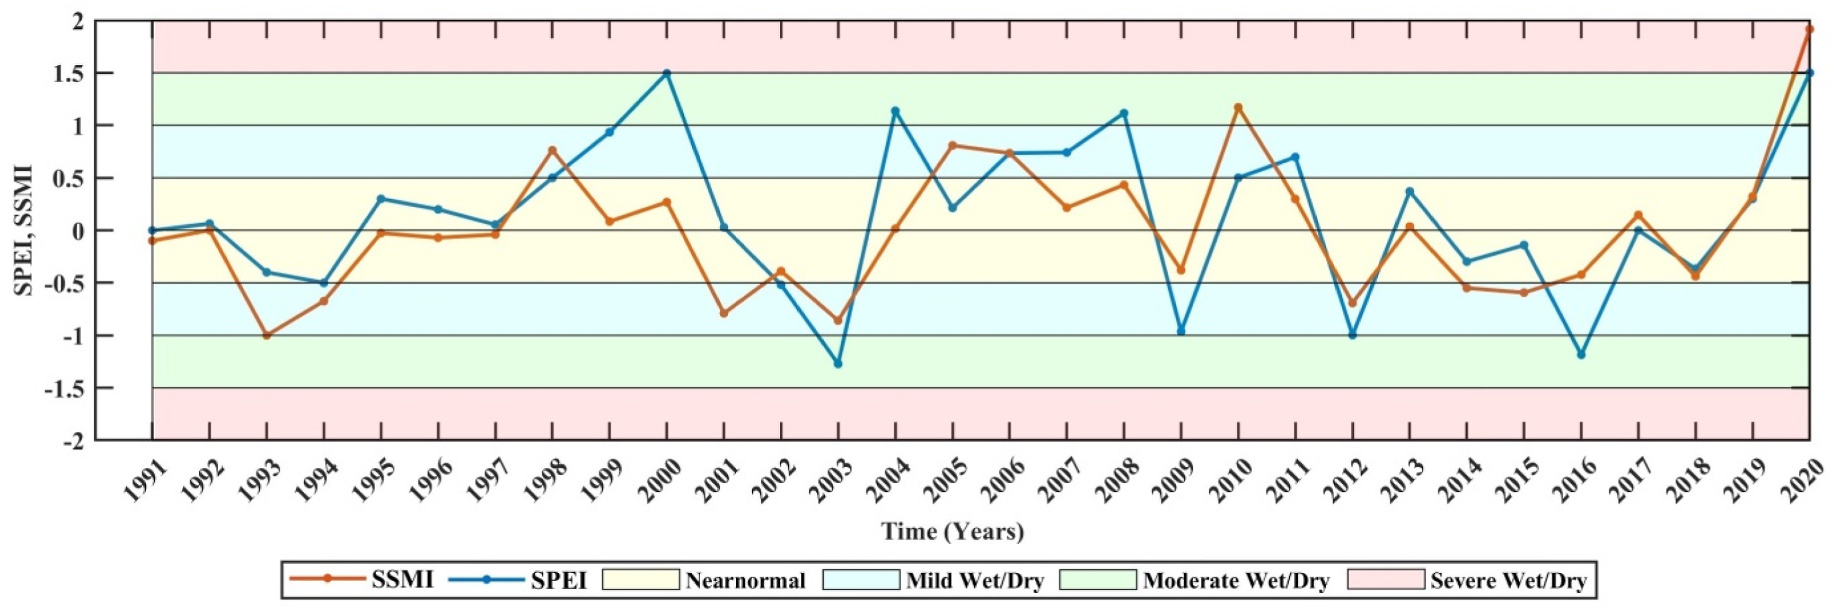
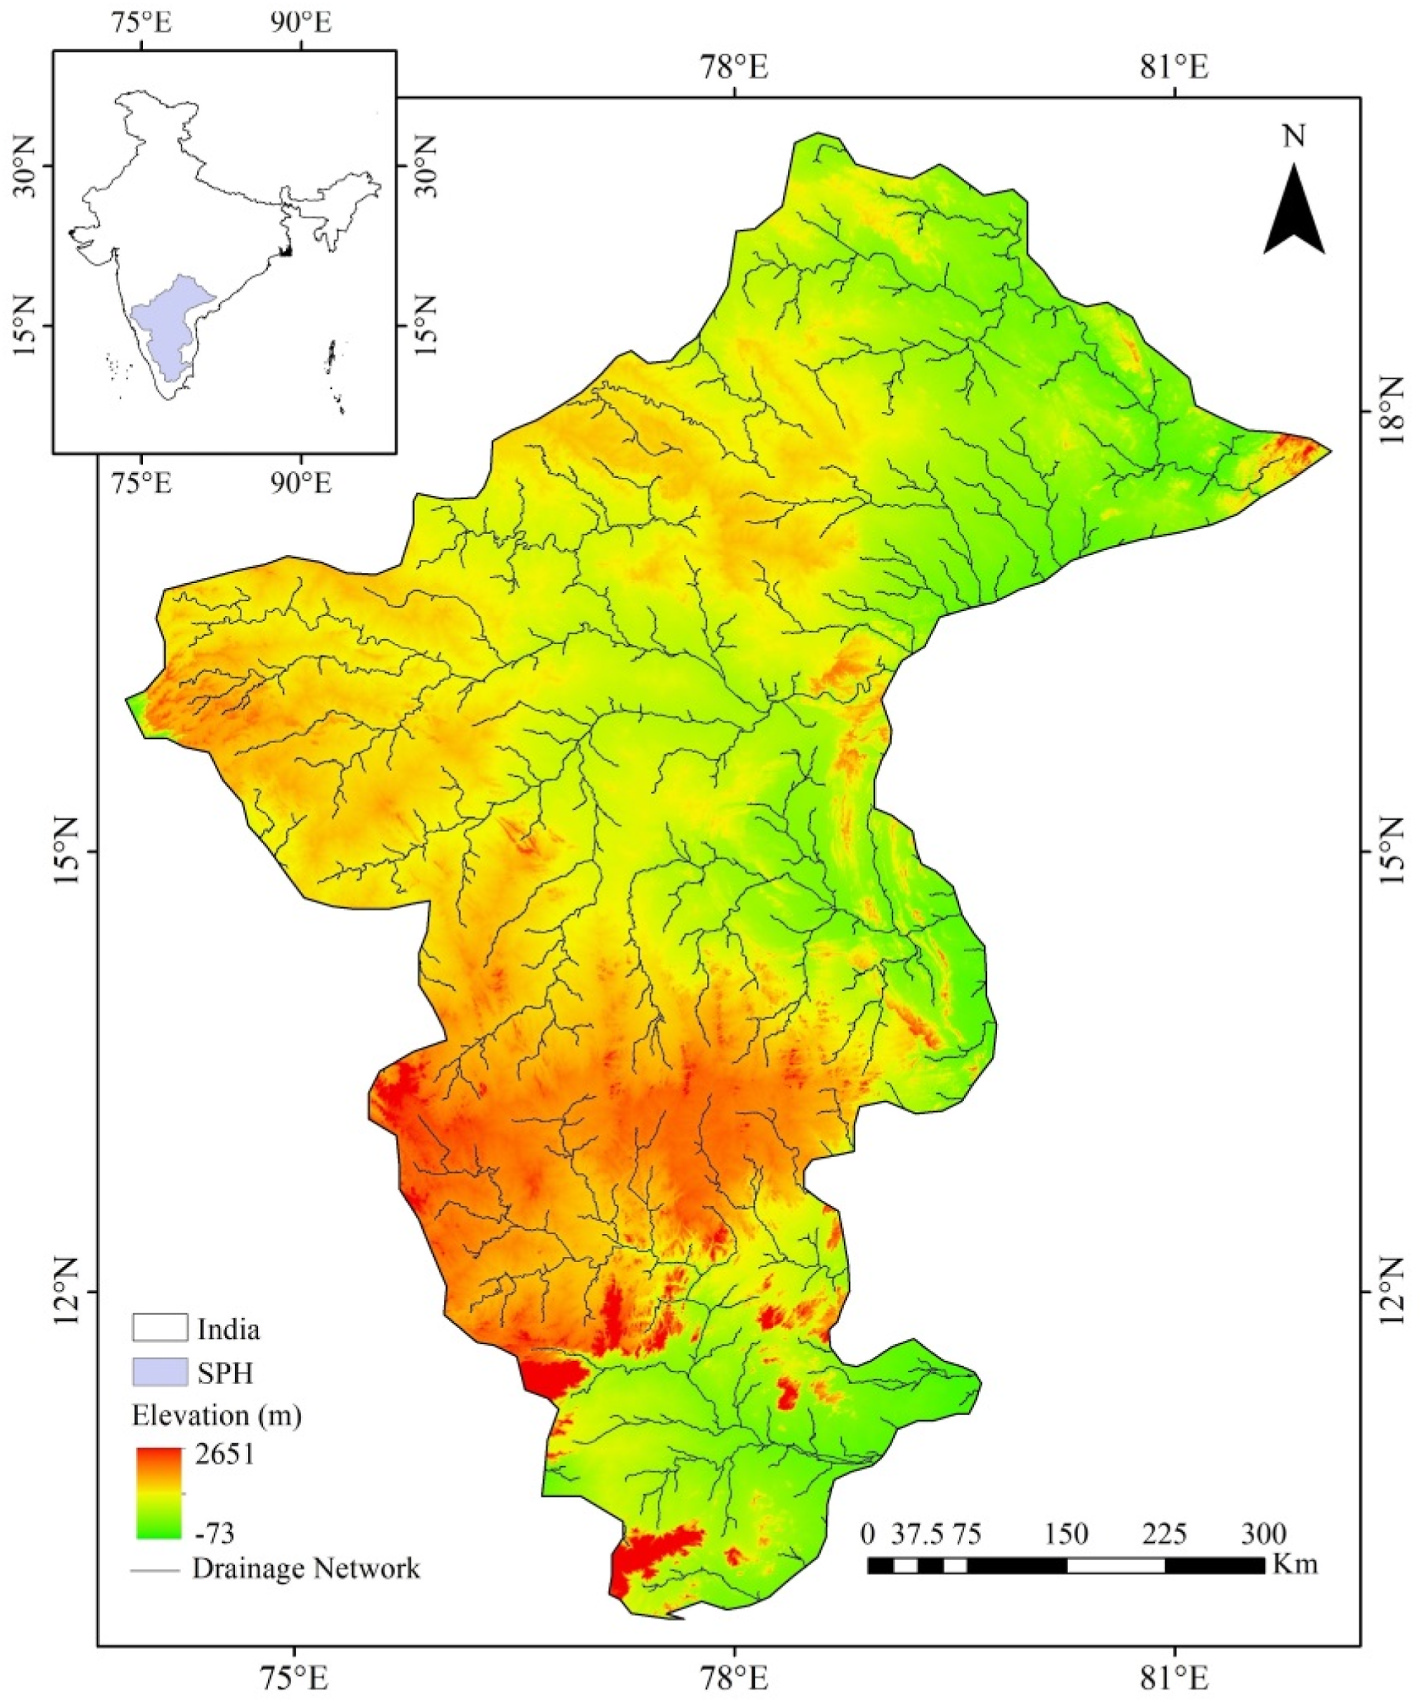
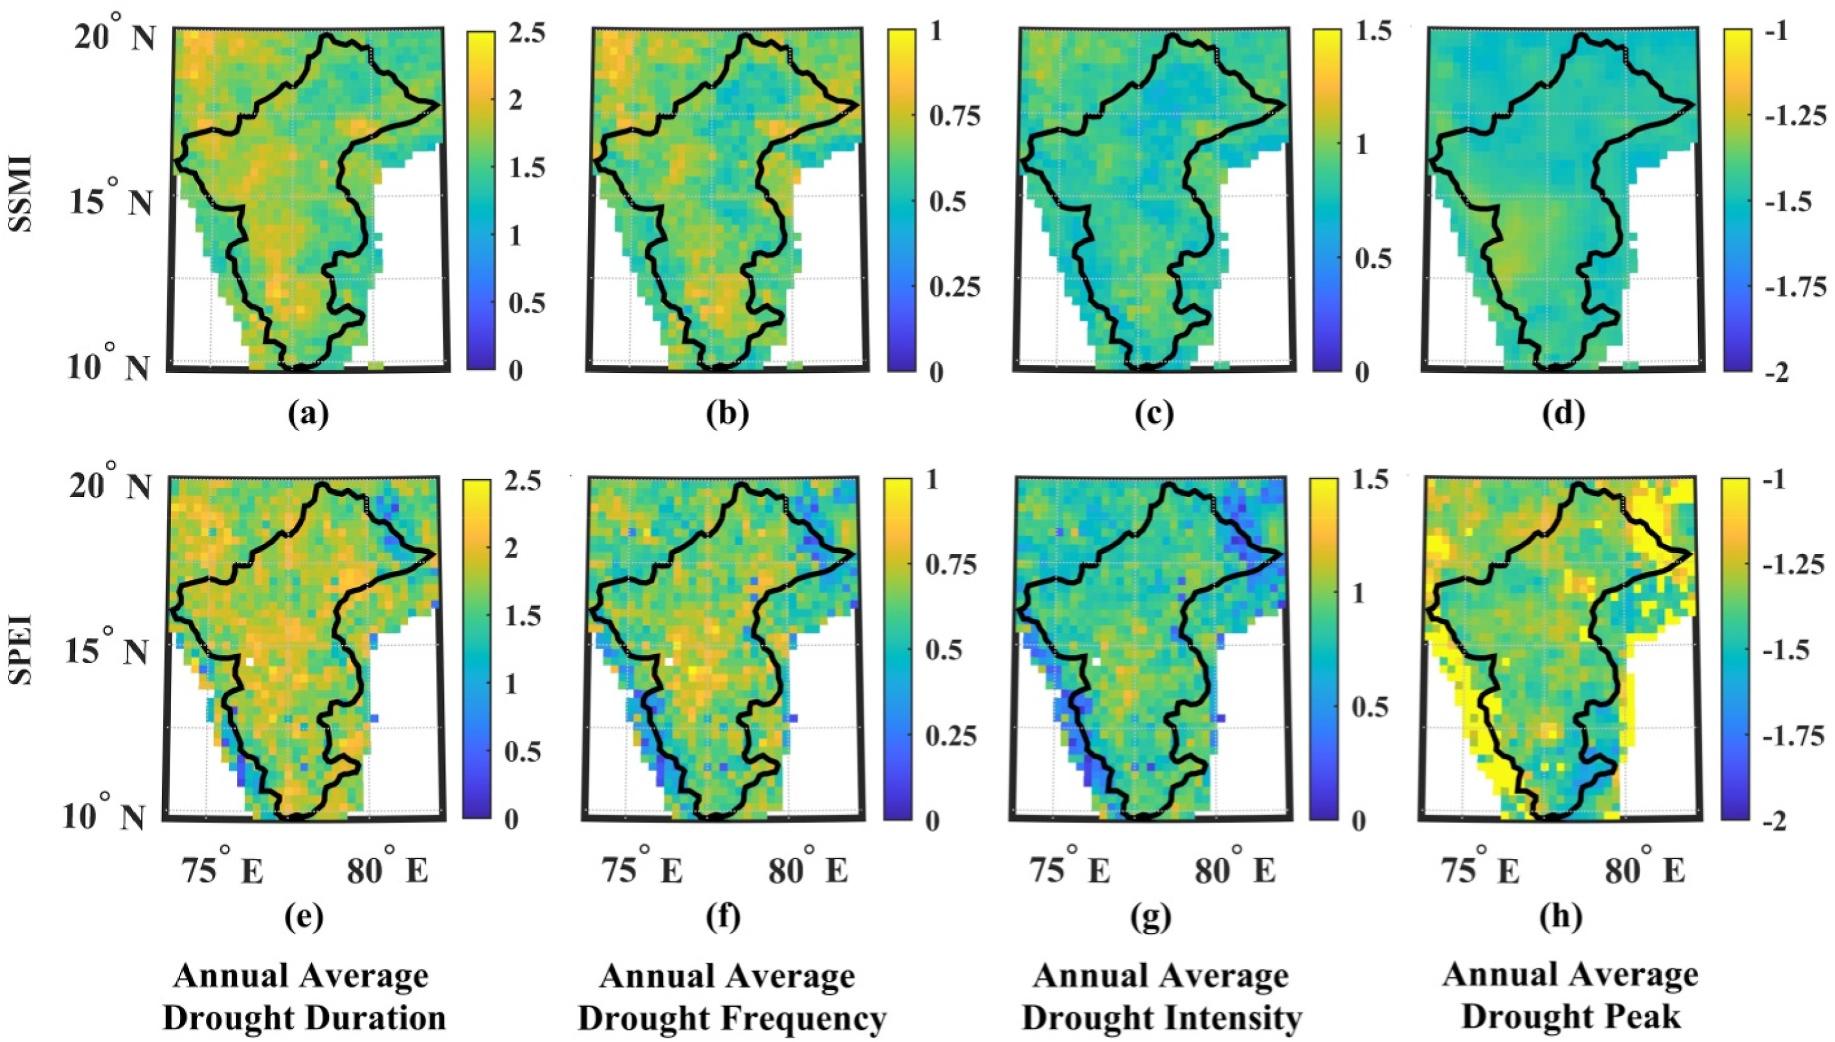
In this study, both the SSMI and the SPEI are found to be consistent with each other, allowing for a comprehensive analysis of drought risk in the Southern Plateau and Hills (SPH) region. Drought event identification, a crucial step in drought risk analysis, is accomplished using run theory, enabling the calculation of average annual drought duration (Dd), frequency (Df), intensity (Ds), and peak (Dp). These characteristics; Dd, Df, Ds, and Dp are derived from the identified drought events using 1- month SSMI and SPEI data for the period 1991 to 2020. These patterns are spatially presented in Fig. 5, representing agricultural (SSMI) and meteorological (SPEI) drought risk. Both indices indicated higher drought risk in terms of Df, shown in yellow colour. The observed spatial distribution of Df aligns with Dd for both indices suggesting that regions with longer drought events (higher Dd) also tended to experience more frequent drought occurrences (higher Df), indicating a strong relation between frequency and duration in the study area. Furthermore, the comparison between SSMI and SPEI revealed slightly lower drought risk concerning Dd, Df, and Ds for SSMI compared to SPEI, while SPEI indicated relatively lower risk concerning Dp. This finding indicates that meteorological droughts tend to be more intense (higher Ds), occur more frequently (higher Df), have longer durations (higher Dd by SSMI), but are less severe (lower Dp) compared to agricultural droughts in the SPH region from 1991 to 2020. The slight discrepancies between SSMI and SPEI in assessing drought risk stem from their foundational differences.
SSMI, which directly measures SM, reflects the immediate availability of water to plants. In contrast, SPEI incorporates both rainfall and PET, offering a broader view of water deficit that includes atmospheric demand for water. The regions showing higher Df and Ds as per SPEI might thus be experiencing not just reduced rainfall but also increased evaporation and transpiration, exacerbating the water stress on vegetation.
These variations influence how each index captures and characterizes drought events. Notably, the differences in Dd, Df, Ds, and Dp between both indices are relatively small, suggesting a relatively close agreement in their assessments. Overall, this comprehensive analysis enhances our understanding of drought risk in the SPH region, providing valuable insights for drought management and water resource planning.
在本研究中,SSMI和SPEI具有较好的一致性,可以对南部高原丘陵地区的干旱风险进行综合分析。干旱事件识别是干旱风险分析的关键步骤,利用运行理论实现了年平均干旱持续时间(Dd)、频率(Df)、强度(Ds)和峰值(Dp)的计算。这些特征;Dd、Df、Ds和Dp是根据1991 - 2020年1个月SSMI和SPEI数据确定的干旱事件得出的。这些模式在空间上呈现在图5中,代表了农业(SSMI)和气象(SPEI)干旱风险。这两个指数都表明干旱风险较高的Df,用黄色表示。观测到的Df与Dd的空间分布一致,表明干旱事件发生时间越长(Dd越高)的地区,干旱事件发生频率越高(Df越高),表明研究区干旱发生频率与持续时间之间存在较强的相关性。此外,SSMI和SPEI的比较表明,SSMI在Dd、Df和Ds方面的干旱风险略低于SPEI,而SPEI在Dp方面的风险相对较低。这一结果表明,与1991 - 2020年SPH地区的农业干旱相比,气象干旱的强度更大(高Ds),发生频率更高(高Df),持续时间更长(SSMI Dd更高),但严重程度更低(Dp更低)。SSMI和SPEI在干旱风险评估中的细微差异源于它们的基础差异。
SSMI直接测量SM,反映了植物的即时可用性。相比之下,SPEI结合了降雨和PET,提供了更广泛的水亏缺视图,包括大气对水的需求。因此,根据SPEI显示Df和Ds较高的地区可能不仅经历了降雨量减少,而且蒸发和蒸腾也增加,加剧了植被的水分压力。
这些变化影响了每个指数捕捉和描述干旱事件的方式。值得注意的是,两个指数之间的Dd、Df、Ds和Dp的差异相对较小,表明它们的评估相对接近。总的来说,这一综合分析增强了我们对保护野生动物保护区地区干旱风险的认识,为干旱管理和水资源规划提供了有价值的见解。
4.3. Dd Df Ds Dp的联合出现
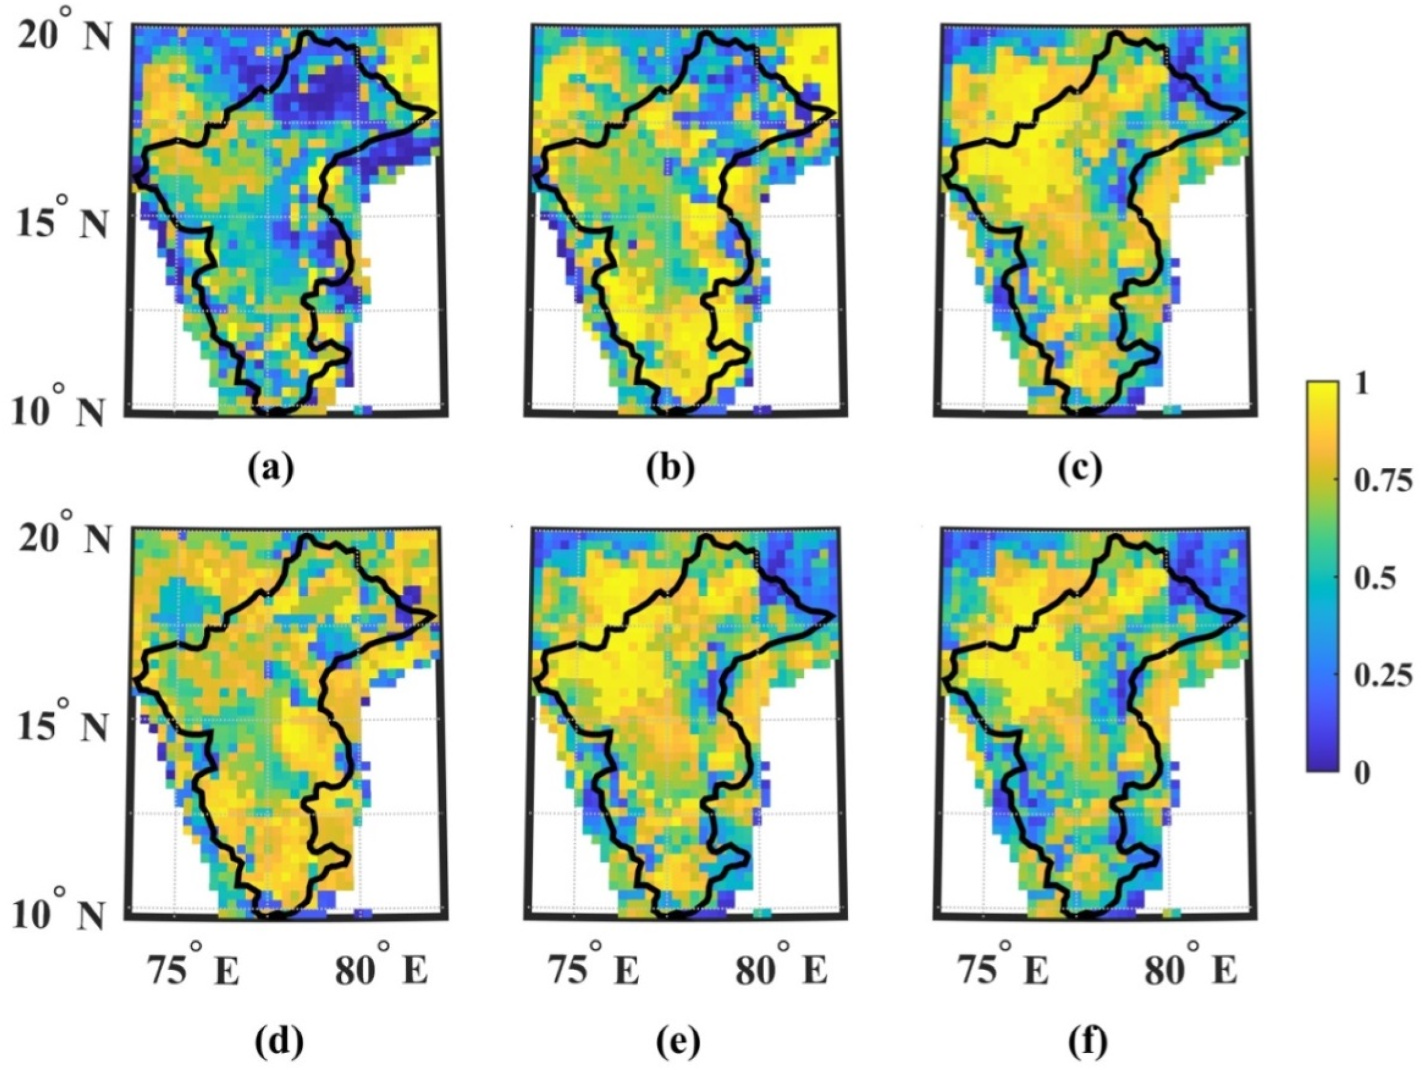
To better assess agricultural drought risk, a joint distribution is employed between various pairs of drought characteristics as: Dd_Ds, Dd_Df, Ds_Df, Dd_Dp, Dd_Dp, Df_Dp, derived from SSMI. Specifically, the agricultural drought risk for the driest year, 2003, is comprehensively evaluated using Archimedean copula functions to capture the joint occurrence of pairs of Dd, Df, Ds, and Dp. Fig. 6 present the joint occurrence of pairs of drought characteristics through conditional probability. The analysis reveals notable differences in the joint occurrences between various pairs of drought characteristics. Specifically, the joint occurrences of Dd and Dp (Fig. 6c), Ds and Df (Fig. 6d), Df and Dp (Fig. 6e), and Dd and Dp (Fig. 6f) are relatively high compared to those of Dd and Df (Fig. 6a) and Dd and Ds (Fig. 6b). The higher joint occurrences of Dd and Dp suggest that droughts with longer durations are more likely to coincide with severe drought peaks, indicating prolonged drought events reaching their most intense phases. Likewise, the elevated joint occurrences of Ds and Df imply that frequent drought events are more likely to have higher severity levels, reflecting a recurring pattern of droughts with varying degrees of intensity in the region. The findings of high joint occurrences between these pairs of drought characteristics; Dd and Dp, and Ds and Df, signal underlying hydrological and agricultural dynamics that drive drought behaviour in the SPH region. For instance, the strong association between drought duration and peak suggests that longer droughts tend to culminate in more severe conditions, possibly due to cumulative deficits in SM and escalating water stress on vegetation over time. Similarly, the correlation between drought frequency and intensity highlights the region’s vulnerability to repeated, severe drought conditions, which can have profound impacts on soil health, crop yields, and water availability. Additionally, the increased joint occurrences of Df and Dp indicate that droughts with higher frequency are also prone to more severe peak phases, suggesting that frequent drought events not only commonly occur but can also reach severe levels during their most intense periods. Conversely, the lower joint occurrences of Dd and Df suggest that longer drought events are less likely to occur frequently, indicating that prolonged droughts in the region exhibit more sporadic recurrence. Similarly, the reduced joint occurrences of Dd and Ds imply that droughts with longer durations are less likely to be extremely severe in terms of their intensity, suggesting that prolonged droughts might not necessarily reach the highest levels of severity. These insights into the joint occurrences of drought characteristics have direct implications for drought management strategies.
为了更好地评估农业干旱风险,利用SSMI数据对干旱特征进行联合分布:Dd_Ds、Dd_Df、Ds_Df、Dd_Dp、Dd_Dp、Df_Dp。具体而言,利用阿基米德copula函数捕捉Dd、Df、Ds和Dp对的共同发生,对最干旱年份2003年的农业干旱风险进行了综合评价。图6通过条件概率给出了成对干旱特征的共同发生。分析表明,各对干旱特征的联合发生存在显著差异。具体来说,Dd和Dp(图6c)、Ds和Df(图6d)、Df和Dp(图6e)、Dd和Dp(图6f)的联合发生率相对于Dd和Df(图6a)和Dd和Ds(图6b)的联合发生率较高。Dd和Dp的较高联合发生率表明,持续时间较长的干旱更有可能与严重干旱高峰同时发生,表明长期干旱事件达到其最强烈的阶段。同样,Ds和Df同时出现的增加意味着频繁的干旱事件更有可能具有更高的严重程度,反映了该区域不同程度强度的干旱反复出现的模式。这些干旱特征对之间的高联合发生率的发现;Dd和Dp以及Ds和Df是驱动SPH地区干旱行为的潜在水文和农业动态的信号。例如,干旱持续时间和峰值之间的强烈关联表明,较长的干旱往往在更严重的条件下达到顶峰,这可能是由于SM的累积不足和随着时间的推移对植被的不断升级的水分胁迫。同样,干旱频率与强度之间的相关性凸显了该地区对反复严重干旱条件的脆弱性,这可能对土壤健康、作物产量和水分供应产生深远影响。此外,Df和Dp同时出现的增加表明,频率较高的干旱也容易出现更严重的峰值阶段,这表明频繁干旱事件不仅经常发生,而且在干旱最严重的时期也可能达到严重程度。相反,Dd和Df的联合发生率较低表明,较长时间的干旱事件不太可能频繁发生,表明该区域的长期干旱表现出更多的零星复发。同样,Dd和Dd同时发生的减少意味着持续时间较长的干旱就其强度而言不太可能是极端严重的,这表明长期干旱可能不一定达到最严重的程度。这些关于干旱特征共同发生的见解对干旱管理战略具有直接影响。
Understanding the probability of concurrent drought extremes can inform risk assessments and guide the development of more resilient agricultural practices and water resource management plans. For example, the knowledge that prolonged droughts are likely to reach severe peaks could motivate the implementation of long-term water conservation measures and the adoption of drought-resistant crop varieties.In a nutshell, this comprehensive analysis of joint occurrences using Archimedean copulas offers valuable insights into the interrelationships between different drought characteristics, enhancing our understanding of agricultural drought risk in the SPH. The use of Archimedean copula functions for analysing joint occurrences of drought characteristics is grounded in their ability to capture the dependency structure between different drought characteristics beyond linear correlations. This methodological choice is particularly relevant in the context of agricultural drought risk assessment, where the relationships between Dd, Df, Ds, and Dp are complex and multifaceted as seen in Fig. 6. These copula functions allow for the modelling of these relationships in a way that accounts for tail dependencies, highlighting extreme co-occurrences that traditional correlation measures might miss. This is crucial for understanding the behaviour of droughts, especially in capturing the likelihood of simultaneous extreme conditions.
了解同时发生极端干旱的可能性可以为风险评估提供信息,并指导制定更具弹性的农业实践和水资源管理计划。例如,认识到长期干旱可能达到严重的高峰,可以促使实施长期节水措施和采用抗旱作物品种。简而言之,利用阿基米德copulas对联合事件的综合分析为了解不同干旱特征之间的相互关系提供了有价值的见解,增强了我们对SPH农业干旱风险的理解。使用阿基米德联结函数来分析干旱特征的共同发生是基于它们能够捕捉不同干旱特征之间超越线性相关性的依赖结构。这种方法选择在农业干旱风险评估的背景下尤为重要,其中Dd、Df、Ds和Dp之间的关系是复杂和多方面的,如图6所示。这些联结函数允许以一种解释尾部依赖的方式对这些关系进行建模,突出传统相关度量可能忽略的极端共现现象,这对于理解干旱的行为至关重要,特别是在捕获同时发生极端条件的可能性方面。
5. 结论
The present study conducted a comprehensive agricultural drought risk assessment in the SPH region using Multi Threshold Run Theory and analyzing two drought indices, the SSMI and SPEI. The objective was to investigate the agricultural drought risk by examining the joint occurrences of drought characteristics by employing copula functions.
• The temporal analysis of SSMI and SPEI revealed their consistency in identifying wet and dry years in the SPH region. This consistency provides confidence in the reliability of both SSMI and SPEI as effective tools for monitoring drought conditions over time • The assessment of drought events using copula functions enabled the investigation of joint occurrences of key drought characteristics: drought duration (Dd), drought frequency (Df), drought intensity (Ds), and drought peak (Dp). The results demonstrated that the joint occurrences of Dd_Dp, Ds_Df, Df_Dp, and Dd_Dp are high compared to the joint occurrences of Dd_Df and Dd_Ds. These findings suggest the presence of strong relationships between these drought characteristics, indicating potential patterns of drought behavior in the SPH region.
• The analysis further revealed that the drought risk assessed by SSMI differed slightly from that of SPEI. The region showed slightly lower drought risk in terms of Dd, Df, and Ds when using SSMI compared to SPEI. However, SPEI indicated relatively lower drought risk in terms of Dp compared to SSMI. These variations in drought risk assessments emphasize the importance of considering multiple drought indices and copula functions to capture the diverse characteristics of agricultural droughts in different climatic and hydrological contexts.
• The methodological approach of employing run theory with multiple thresholds allows for a nuanced detection of drought events that vary in intensity and duration. This approach, coupled with the standardized nature of SSMI and SPEI, ensures that the characterization of drought events is consistent and comparable across different spatial grids within the SPH region. However, the inherent differences in the indices’ focus—SM versus meteorological conditions—naturally lead to slight variations in the identification and characterization of drought events, emphasizing the complementary nature of using both indices for a holistic drought risk assessment.
本文运用多阈值运行理论,分析SSMI和SPEI两种干旱指数,对保护区农业干旱风险进行了综合评价。目的是通过采用联结函数检查干旱特征的联合发生来调查农业干旱风险。
•SSMI和SPEI的时间分析揭示了它们在SPH地区识别干湿年的一致性。这种一致性为SSMI和SPEI作为长期监测干旱状况的有效工具的可靠性提供了信心•使用联结函数对干旱事件进行评估,可以调查关键干旱特征的联合发生:干旱持续时间(Dd)、干旱频率(Df)、干旱强度(Ds)和干旱峰值(Dp)。结果表明,Dd_Dp、Ds_Df、Df_Dp和Dd_Dp的联合发生率高于Dd_Df和Dd_Ds的联合发生率。这些发现表明,这些干旱特征之间存在着密切的关系,表明了SPH地区干旱行为的潜在模式。
•进一步分析表明,SSMI评估的干旱风险与SPEI评估的略有不同。与SPEI相比,SSMI在Dd、Df和Ds方面的干旱风险略低。然而,与SSMI相比,SPEI在Dp方面显示相对较低的干旱风险。干旱风险评估中的这些差异强调了考虑多种干旱指数和联结函数以捕捉不同气候和水文背景下农业干旱的各种特征的重要性。
•采用多阈值运行理论的方法方法允许对强度和持续时间变化的干旱事件进行细致入微的检测。该方法与SSMI和SPEI的标准化性质相结合,确保了SPH区域内不同空间网格间干旱事件特征的一致性和可比性。然而,这两种指数关注焦点的内在差异(sm与气象条件)自然会导致干旱事件识别和表征上的细微差异,强调了使用这两种指数进行整体干旱风险评估的互补性。
•copula函数在农业干旱风险评估中的应用已被证明有助于揭示干旱特征之间的复杂关系,从而丰富我们对SPH地区干旱动态的理解。这种复杂的统计方法可以详细探索各种干旱特征,如持续时间、频率、强度和峰值凝聚,为干旱现象的多面性提供了细致入微的视角。通过准确地模拟这些特征的相互依赖关系和共同出现,联结函数有助于更精确地进行风险评估,这对有效管理和减轻干旱影响至关重要。从这一分析中获得的见解对旨在抗旱能力的战略规划和政策制定具有深远的意义。决策者和利益相关者拥有强大的分析基础,可以根据基于copula的分析所描绘的农业干旱事件的独特模式和趋势,制定有针对性的干旱防范和应对举措。通过深入了解干旱特征的共同行为,这种量身定制的方法使利益攸关方能够制定更精确、更有效的战略,最终提高该地区应对和抵御农业干旱挑战的能力。
•在本研究的背景下,应该承认几个局限性:分析依赖于使用copula函数和多阈值运行理论评估干旱特征所固有的某些假设。这些方法选择,包括在所有栅格中选择相同的三个阈值,假设干旱行为具有一定程度的均匀性和可预测性,这可能无法完全捕捉到SM条件的空间异质性。用于估计干旱指数和分析其相互关系的理论模型可能无法考虑到影响干旱风险的所有可能的气候和水文变量。此外,研究中潜在的误差来源来自使用的数据集和用于计算干旱指数的计算方法。基于模式的降雨和温度估算(ERA5 Land)的准确性和可靠性受到不确定性和误差的影响。这些问题可能源于测量不准确、算法偏差,以及为了准确地表示地面条件而对数据进行内插和外推所固有的挑战。未来的研究可能旨在扩大干旱风险评估的地理和气候范围,纳入更多的干旱指数和数据集,以捕捉更广泛的干旱现象,并改进方法方法,以减少假设和潜在的错误。
综上所述,本研究通过copula函数和干旱共同发生特征的视角,深入分析了SPH地区的农业干旱风险,促进了我们对干旱动态的理解。此外,多阈值运行理论以及SSMI作为监测干旱条件工具的可靠性表明,它们有可能被纳入国家和区域政策框架,促进更明智的决策过程,从而增强农业抵御力和水资源可持续性。这项研究还为今后的研究开辟了新的途径,特别是在探索干旱的社会经济影响和发展早期预警系统的预测模式方面,进一步有助于加强干旱防备和反应机制。通过将我们的科学观察与决策者、资源管理者和更广泛的社区的需求直接联系起来,本研究强调了先进的干旱评估方法在制定有效和可持续的干旱风险管理政策方面的关键作用,从而支持SPH地区在面对当前和未来干旱挑战时的恢复力和可持续发展。


 7万+
7万+

 被折叠的 条评论
为什么被折叠?
被折叠的 条评论
为什么被折叠?
 到【灌水乐园】发言


