


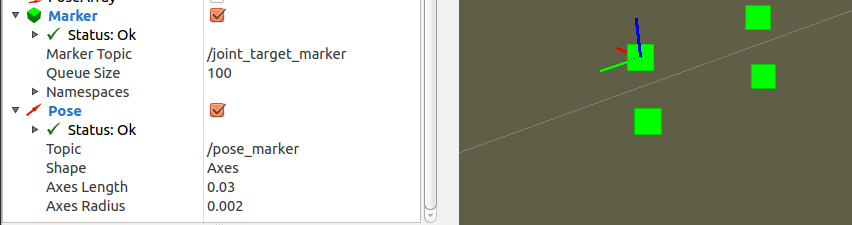
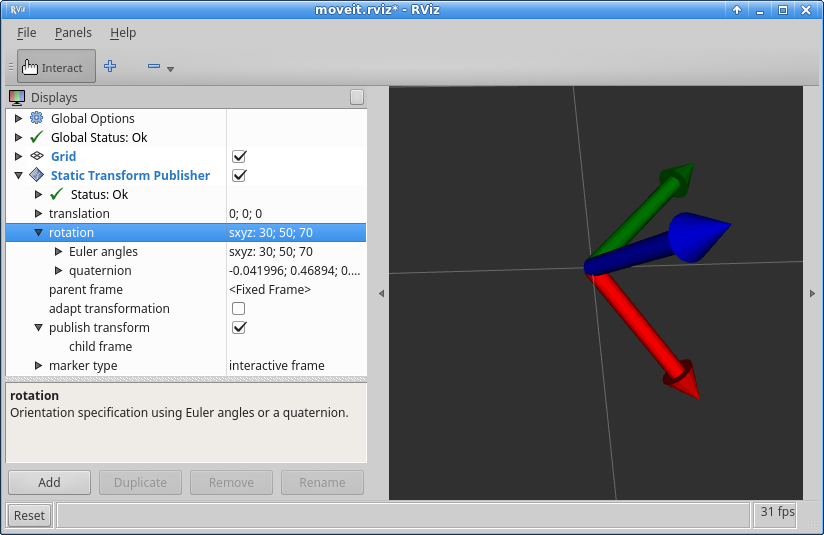
这个问题也算是一个历史遗留问题,之前在youbot的机械臂的夹子间添加了一个virtual joint,也算是添加一个坐标系了。但这个偏重于机器人模型方面的坐标。另外,在做机械臂的轨迹运动规划的时候,常常也需要显示点位,甚至是坐标系姿态。Rviz的插件中虽然也可以添加坐标系,如下图:
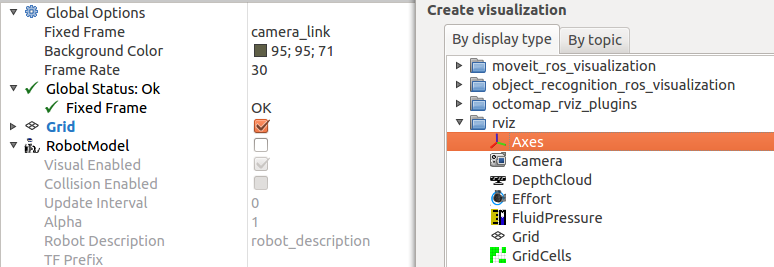
但是发现它的这个Axes只能添加Fixed Frame的坐标系,添加相对于其他坐标系的Axes会显示不出来。
1. 虚拟关节
这部分内容在《ROS By Example Volume 2 Hydro》的第四章P136页有详细说明。截图是这样子
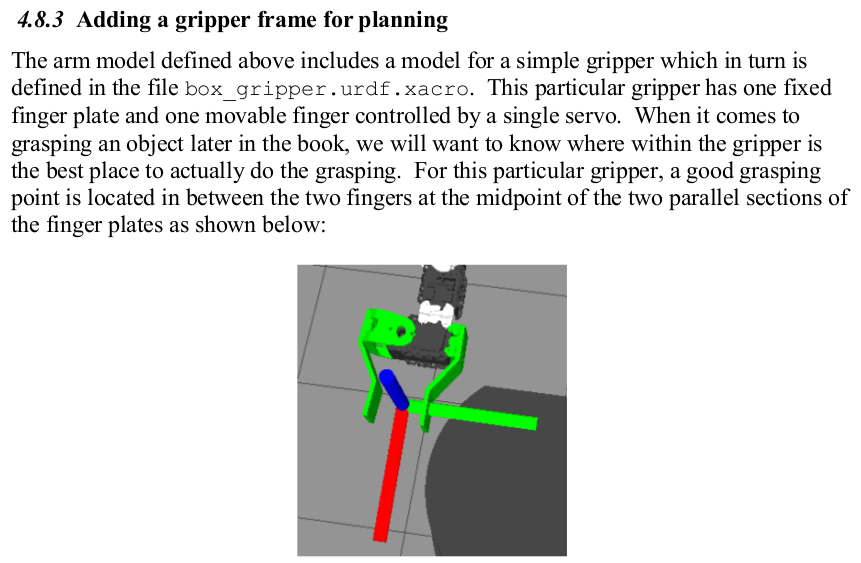
我自己试过如下,它侧重于模型的坐标系的建立,修改机器人的URDF 文件就好。
2. 显示坐标系
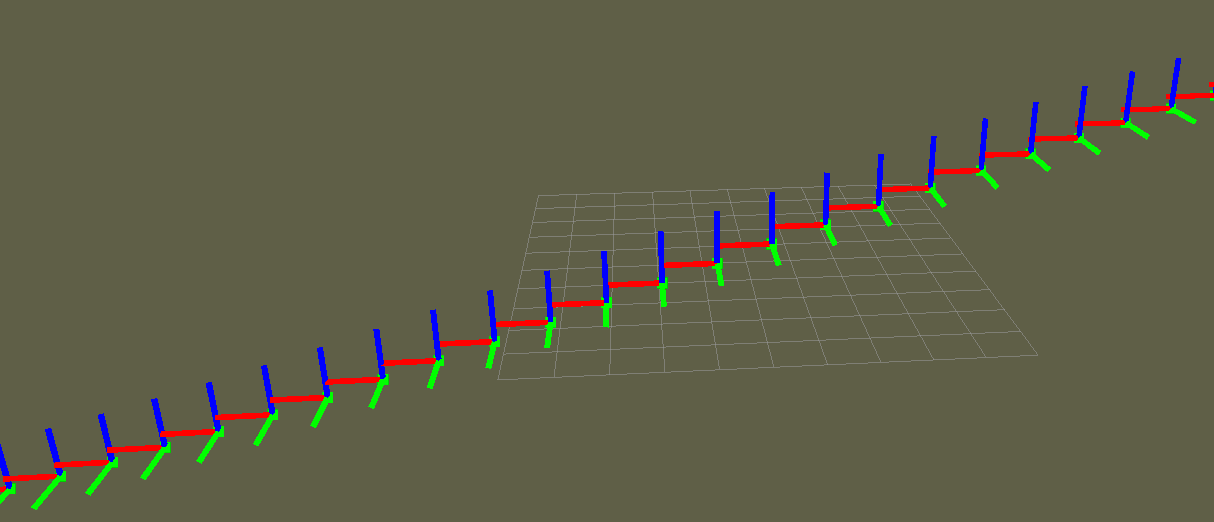
2.1 使用line list分别画出x,y,z轴
这里可以找到Riz所有的显示对象http://wiki.ros.org/rviz/DisplayTypes
参考官网这里的http://wiki.ros.org/rviz/Tutorials/Markers%3A%20Points%20and%20Lines
选用line list来画坐标系,分别画出x, y, z轴
// http://wiki.ros.org/rviz/Tutorials/Markers%3A%20Points%20and%20Lines
// The LINE_STRIP type uses each point as a vertex in a connected set of lines, where point 0 is connected to point 1, 1 to 2, 2 to 3, etc. The LINE_LIST type creates unconnected lines out of each pair of points, i.e. point 0 to 1, 2 to 3, etc.
#include <ros/ros.h>
#include <visualization_msgs/Marker.h>

#include <cmath>

int main( int argc, char** argv )
{
  ros::init(argc, argv, "points_and_lines");
  ros::NodeHandle n;
  ros::Publisher marker_pub = n.advertise<visualization_msgs::Marker>("visualization_marker", 10);

  ros::Rate r(30);

  float f = 0.0;
  while (ros::ok())
  {

    visualization_msgs::Marker points, line_strip, line_list_x,line_list_y, line_list_z;
    points.header.frame_id = line_strip.header.frame_id = line_list_x.header.frame_id = line_list_y.header.frame_id =line_list_z.header.frame_id  = "/base_link";
    points.header.stamp = line_strip.header.stamp = line_list_x.header.stamp= line_list_y.header.stamp = line_list_z.header.stamp= ros::Time::now();
    points.ns = line_strip.ns = line_list_x.ns= line_list_y.ns= line_list_z.ns = "points_and_lines";
    points.action = line_strip.action = line_list_x.action = line_list_y.action =line_list_z.action =visualization_msgs::Marker::ADD;
    points.pose.orientation.w = line_strip.pose.orientation.w = line_list_x.pose.orientation.w =line_list_y.pose.orientation.w =line_list_z.pose.orientation.w = 1.0;


    points.id = 0;
    line_strip.id = 1;
    line_list_x.id = 2;
    line_list_y.id = 3;
    line_list_z.id = 4;


    points.type = visualization_msgs::Marker::POINTS;
    line_strip.type = visualization_msgs::Marker::LINE_STRIP;
    line_list_x.type = visualization_msgs::Marker::LINE_LIST;
    line_list_y.type = visualization_msgs::Marker::LINE_LIST;
    line_list_z.type = visualization_msgs::Marker::LINE_LIST;


    // POINTS markers use x and y scale for width/height respectively
    points.scale.x = 0.2;
    points.scale.y = 0.2;

    // LINE_STRIP/LINE_LIST markers use only the x component of scale, for the line width
    line_strip.scale.x = 0.1;
    line_list_x.scale.x = 0.1;
    line_list_y.scale.x = 0.1;
    line_list_z.scale.x = 0.1;


    // Points are green
    points.color.g = 1.0f;
    points.color.a = 1.0;

    // Line strip is blue
    line_strip.color.b = 1.0;
    line_strip.color.a = 1.0;

    // Line list is red
    line_list_x.color.r = 1.0;
    line_list_x.color.a = 1.0;
    line_list_y.color.g = 1.0;
    line_list_y.color.a = 1.0;
    line_list_z.color.b = 1.0;
    line_list_z.color.a = 1.0;


    // Create the vertices for the points and lines
    for (uint32_t i = 0; i < 100; ++i)
    {
      float y = 5 * sin(f + i / 100.0f * 2 * M_PI);
      float z = 5 * cos(f + i / 100.0f * 2 * M_PI);

      geometry_msgs::Point p;
      p.x = (int32_t)i - 50;
      p.y = y;
      p.z = z;

      points.points.push_back(p);
//      line_strip.points.push_back(p);

      // The line list needs two points for each line


      line_list_z.points.push_back(p);
      p.z += 1.0;
      line_list_z.points.push_back(p);

      p.z -= 1.0;
      line_list_y.points.push_back(p);
      p.y += 1.0;
      line_list_y.points.push_back(p);

      p.y -= 1.0;
      line_list_x.points.push_back(p);
      p.x += 1.0;
      line_list_x.points.push_back(p);
    }


    marker_pub.publish(points);
    marker_pub.publish(line_strip);
    marker_pub.publish(line_list_x);
    marker_pub.publish(line_list_y);
    marker_pub.publish(line_list_z);

    r.sleep();

    f += 0.04;
  }
}
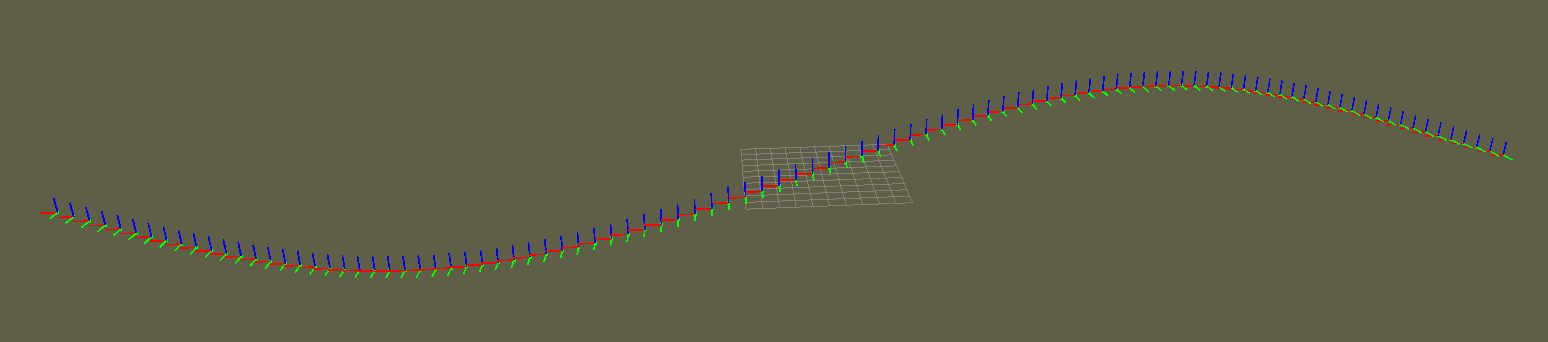
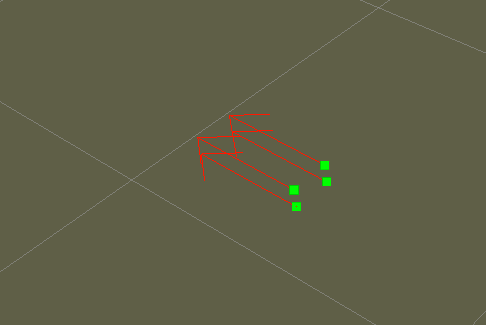
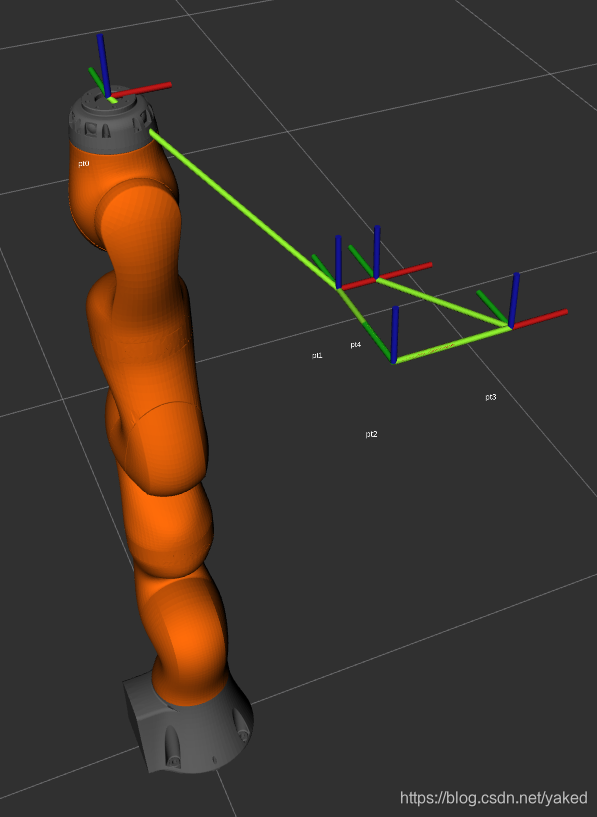
2.2 使用posestamped
// http://wiki.ros.org/rviz/Tutorials/Markers%3A%20Points%20and%20Lines
// The LINE_STRIP type uses each point as a vertex in a connected set of lines, where point 0 is connected to point 1, 1 to 2, 2 to 3, etc. The LINE_LIST type creates unconnected lines out of each pair of points, i.e. point 0 to 1, 2 to 3, etc.
#include <ros/ros.h>
#include <visualization_msgs/Marker.h>
#include <geometry_msgs/PoseStamped.h>

#include <cmath>
#include <sstream>
#include <vector>
#include <fstream>

using namespace std;

std::vector<std::string> &split(const std::string &s, char delim, std::vector<std::string> &elems)
{
    std::stringstream ss(s);
    std::string item;
    while (std::getline(ss, item, delim))
    {
        elems.push_back(item);
    }
    return elems;
}


std::vector<std::string> split(const std::string &s, char delim)
{
    std::vector<std::string> elems;
    split(s, delim, elems);
    return elems;
}


int main( int argc, char** argv )
{
    ros::init(argc, argv, "points_and_lines");
    ros::NodeHandle n;
    ros::Publisher marker_pub = n.advertise<visualization_msgs::Marker>("joint_target_marker", 10);
    ros::Publisher pose_pub = n.advertise<geometry_msgs::PoseStamped>("pose_marker", 10);

    ros::Rate r(10);

    string line;
    ifstream myfile("/home/yake/catkin_ws/src/youbot_trajectory_ros/cartesian_target/cartesian_target.txt");
    std::vector<std::string> elems;

    visualization_msgs::Marker points;
    geometry_msgs::PoseStamped pose;

    std::vector<geometry_msgs::PoseStamped> v_pose;

    if (myfile.is_open())
    {
        cout << "Open file successfully."<<endl;
        while ( getline (myfile,line) )
        {
            cout << line << '\n';

            elems= (split(line, ','));

            // Create the vertices for the points and lines
            geometry_msgs::Point p;
            geometry_msgs::Pose po;

            p.x = atof(elems[0].c_str());
            p.y = atof(elems[1].c_str());
            p.z = atof(elems[2].c_str());
            points.pose.orientation.w = 1.0;


            points.points.push_back(p);

            po.position.x = atof(elems[0].c_str());
            po.position.y = atof(elems[1].c_str());
            po.position.z = atof(elems[2].c_str());
            po.orientation.x = 0.0;
            po.orientation.y = 0.0;
            po.orientation.z = 0.0;
            po.orientation.w = 1.0;

            pose.pose.position = po.position;
            pose.pose.orientation = po.orientation;

            //            pose->header.frame_id= "/arm_link_0";
            //            pose->header.stamp=ros::Time::now();
            //            pose->pose.position = po.position;
            //            pose->pose.orientation = po.orientation;
            pose.header.frame_id= "/arm_link_0";

            v_pose.push_back (pose);

            //            pose_pub.publish(pose);
            //            marker_pub.publish(points);

        }

        myfile.close();

    }else  cout << "Unable to open file"<<endl;

vector<geometry_msgs::PoseStamped>::iterator it = v_pose.begin ();

    while (ros::ok())
    {
        points.header.frame_id = "/arm_link_0";
        points.header.stamp = ros::Time::now();
        points.ns = "joint_points_and_lines";
        points.action = visualization_msgs::Marker::ADD;


        points.id = 0;

        points.type = visualization_msgs::Marker::POINTS;
        //    visualization_msgs::Marker::pose;

        // POINTS markers use x and y scale for width/height respectively
        points.scale.x = 0.02;
        points.scale.y = 0.02;
        points.scale.z = 0.0;

        // Points are green
        points.color.g = 1.0f;
        points.color.a = 1.0;


        marker_pub.publish(points);

       for(size_t i=0; i<v_pose.size (); ++i)
       {
           v_pose[i].header.stamp = ros::Time::now ();
            pose_pub.publish(v_pose[i]);
            ros::Duration(0, 5000000).sleep ();
       }
    }
}
这个问题比较大,坐标系还是可以显示的,但是我需要显示的四个pose,但是发现pose更新速度较慢,坐标系是一个一个显示出来的,不知是否跟我pub有问题。这个pose跟points很不一样,读取本地文件的四个点位坐标后,points直接pushback保存了,而pose这个是没有的,因此我创建了一个Vector来存储pose。最后仿照points的方式,最后放在while循环里直接发布出去。
poseArray也试过了,不是我想要的那种效果, AMCL定位里看到的就是这种方式。http://wiki.ros.org/rviz/DisplayTypes/PoseArray
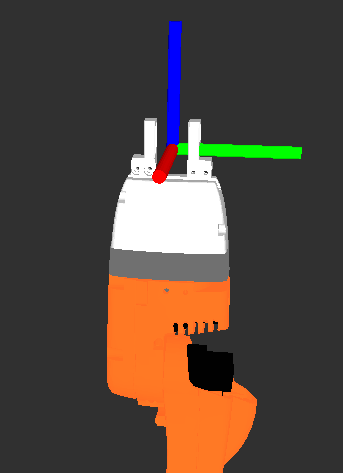
3.针对已有坐标系添加坐标转换关系
对于Kinect或Xtion,在启动驱动的时候会顺便启动自身的相机坐标系
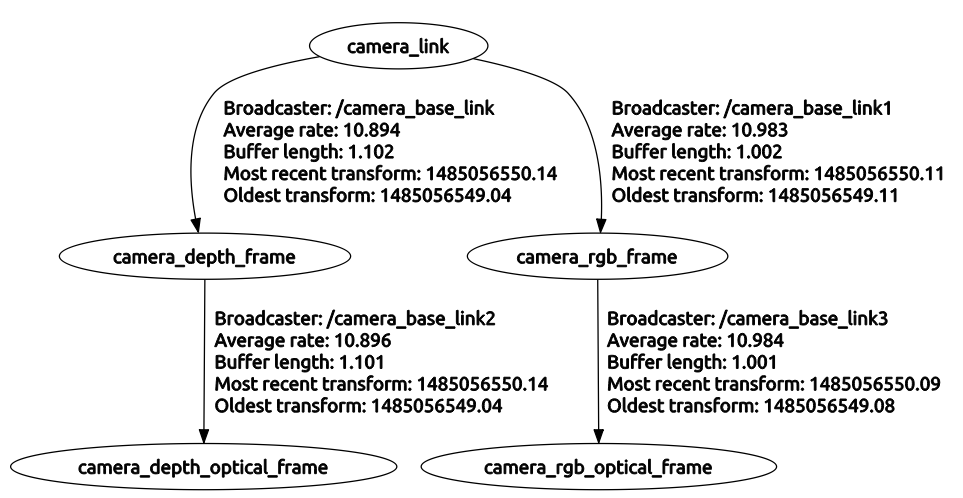
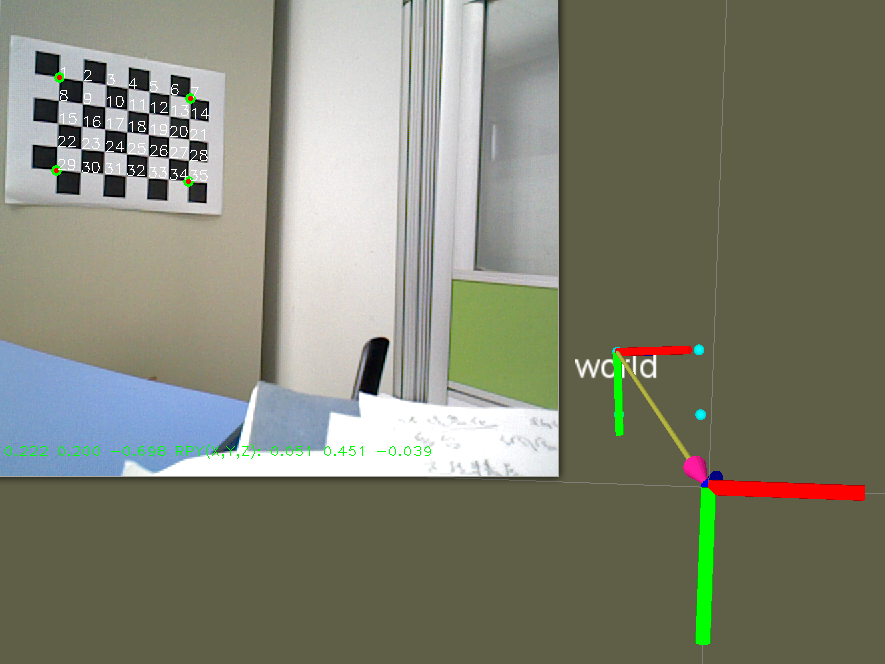
那如果说我通过特征点的识别与匹配,估算了相机的位置,知道其在世界坐标中的位置与姿态,想在rviz中显示出来。ROS 也提供了针对已有坐标系的转化关系
http://wiki.ros.org/tf/Tutorials/Adding%20a%20frame%20%28C%2B%2B%29
关键代码如下
 tf::Transform transform;
 static tf::TransformBroadcaster br;
 transform.setOrigin (tf::Vector3(tx, ty, tz));
 transform.setRotation (tf::createQuaternionFromRPY (-1 * thetax, -1 * thetay, -1 * thetaz));// X Y Z
 br.sendTransform (tf::StampedTransform(transform, ros::Time::now (),"/camera_link", "/world"));
 ros::Duration(0, 5000000).sleep ();
我这里是显示world坐标系相对于相机的位姿,sendTransform中前一个是父坐标系。
====================201804=========================
http://wiki.ros.org/agni_tf_tools
===============================
https://github.com/PickNikRobotics/rviz_visual_tools


 678
678


 被折叠的 条评论
为什么被折叠?
被折叠的 条评论
为什么被折叠?
 到【灌水乐园】发言


