


参考:Damage Propagation Modeling for Aircraft Engine Run-to-Failure Simulation”, in the Proceedings of the Ist International Conference on Prognostics and Health Management (PHM08)
首先,导入相关模块
import numpy as np
import pandas as pd
import seaborn as sns
import math
import matplotlib.pyplot as plt
from matplotlib import cm
from sklearn.decomposition import PCA
from sklearn.preprocessing import MinMaxScaler
from sklearn.model_selection import train_test_split, cross_val_score
from sklearn.preprocessing import QuantileTransformer , PowerTransformer
from sklearn.ensemble import RandomForestRegressor
from sklearn.metrics import mean_absolute_error
from sklearn.metrics import r2_score
from sklearn.metrics import accuracy_score
from sklearn.metrics import mean_squared_error
from sklearn.linear_model import LinearRegression
from sklearn.linear_model import LogisticRegression
from keras.layers import Dense , LSTM
from keras.models import Sequential
from sklearn.metrics import mean_squared_error
import warnings
warnings.filterwarnings('ignore')
%matplotlib inline
cmap = cm.get_cmap('Spectral') # Colour map (there are many others)
from sklearn.metrics import mean_absolute_error
from sklearn.metrics import mean_squared_error
from sklearn.metrics import explained_variance_score
from sklearn.metrics import r2_score
import pickle
然后,进行数据预处理
#Data analysis
train_file = "train_FD001.txt"
test_file = "test_FD001.txt"
RUL_file = "RUL_FD001.txt"
df = pd.read_csv(train_file,sep=" ",header=None)
df.head()
#columns = ['unit_number','time_in_cycles','setting_1','setting_2','TRA','T2','T24','T30','T50','P2','P15','P30','Nf',
# 'Nc','epr','Ps3 0','phi','NRf','NRc','BPR','farB','htBleed','Nf_dmd','PCNfR_dmd','W31','W32' ]
#delete NaN values
df.drop(columns=[26,27],inplace=True)
columns = ["Section-{}".format(i) for i in range(26)]
df.columns = columns
df.head()
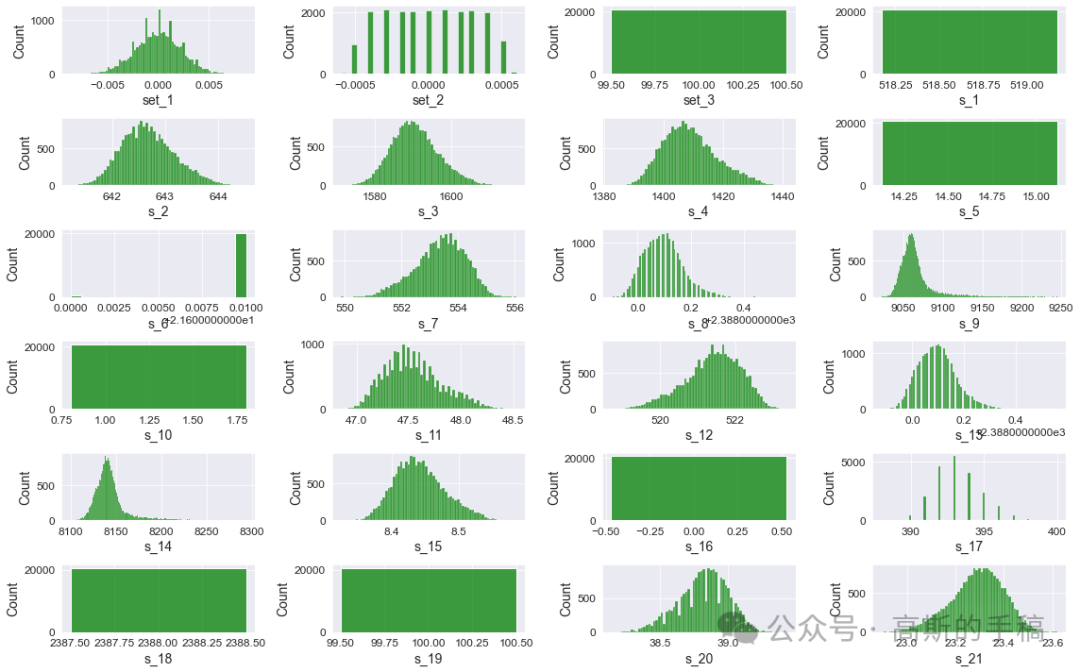
#Dataset statistics for each parameter
df.describe()
# Names
MachineID_name = ["Section-0"]
RUL_name = ["Section-1"]
OS_name = ["Section-{}".format(i) for i in range(2,5)]
Sensor_name = ["Section-{}".format(i) for i in range(5,26)]
# Data in pandas DataFrame
MachineID_data = df[MachineID_name]
RUL_data = df[RUL_name]
OS_data = df[OS_name]
Sensor_data = df[Sensor_name]
# Data in pandas Series
MachineID_series = df["Section-0"]
RUL_series = df["Section-1"]
grp = RUL_data.groupby(MachineID_series)
max_cycles = np.array([max(grp.get_group(i)["Section-1"]) for i in MachineID_series.unique()])
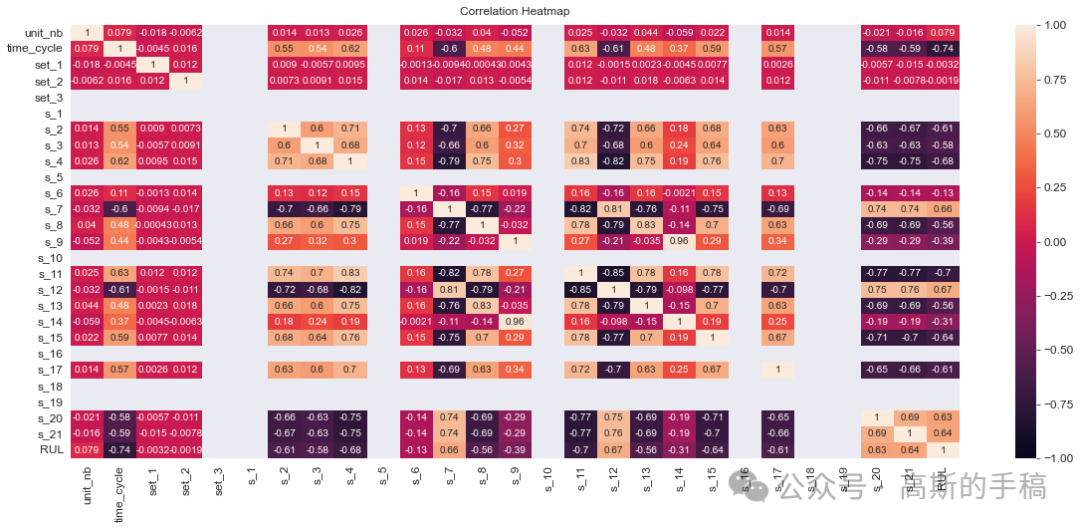
#delete columns with constant values that do not carry information about the state of the unit
#data = pd.concat([RUL_data,OS_data,Sensor_data], axis=1)
df.drop(columns=["Section-0",
"Section-4", # Operatinal Setting
"Section-5", # Sensor data
"Section-9", # Sensor data
"Section-10", # Sensor data
"Section-14",# Sensor data
"Section-20",# Sensor data
"Section-22",# Sensor data
"Section-23"] , inplace=True)
#Noise removal and Normalization
print(type(df))
gen = MinMaxScaler(feature_range=(0, 1))
df = gen.fit_transform(df)
df = pd.DataFrame(df)
#df = df.rolling(20).mean()
pt = PowerTransformer()
df = pt.fit_transform(df)
df=np.nan_to_num(df)
#Training and Validation
def RUL_df():
rul_lst = [j for i in MachineID_series.unique() for j in np.array(grp.get_group(i)[::-1]["Section-1"])]
rul_col = pd.DataFrame({"rul":rul_lst})
return rul_col
RUL_df().head()3种不同模型的训练性能,包括随机森林回归,线性回归和逻辑回归
X = np.array(df)
y = np.array(RUL_df()).reshape(-1,1)
X_train, X_test, y_train, y_test = train_test_split(X, y, test_size = 0.20)
forest_model = RandomForestRegressor()
forest_model.fit(X_train, y_train)
lin_model = LinearRegression()
lin_model.fit(X_train, y_train)
logistic_model = LogisticRegression()
logistic_model.fit(X_train, y_train)

pred_f = forest_model.predict(X)
pred_lin = lin_model.predict(X)
pred_log = logistic_model.predict(X)

print("mean_squared_error >> ", mean_squared_error(y, pred_f))
print("mean_absolute_error >>",mean_absolute_error(y, pred_f))

print("\nmean_squared_error >> ", mean_squared_error(y, pred_lin))
print("mean_absolute_error >>",mean_absolute_error(y, pred_lin))

print("\nmean_squared_error >> ", mean_squared_error(y, pred_log))
print("mean_absolute_error >>",mean_absolute_error(y, pred_log))

pickle.dump(logistic_model, open('logistic_regression.sav', 'wb'))

pickle.dump(lin_model, open('linear_regression.sav', 'wb'))

pickle.dump(forest_model, open('forest_regression.sav', 'wb'))

print("Acc of Linear Regression >> ",lin_model.score(X_test, y_test))
print("Acc of Random Forest >> ",forest_model.score(X_test, y_test))
print("Acc of Logistic Regression >> ",logistic_model.score(X_test, y_test))
随机森林预测结果
forest_pred = forest_model.predict(X_test)
print("mean_squared_error >> ", mean_squared_error(y_test, forest_pred))
print("mean_absolute_error >>",mean_absolute_error(y_test, forest_pred))
#Random Forest Validation Prediction vs Actual
plt.plot(y_test,c='k',label='Actual')
plt.plot(forest_pred,c='red',label='Predicted')
plt.legend()
plt.show()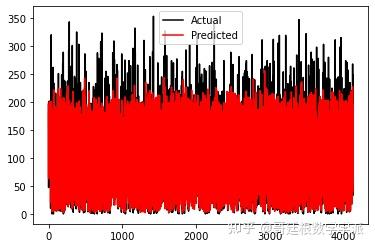
随机森林预测结果
线性回归预测结果
#Linear Regression
#Linear Regression Validation Performance
lin_pred = lin_model.predict(X_test)
print("mean_squared_error >> ", mean_squared_error(y_test, lin_pred))
print("mean_absolute_error >>",mean_absolute_error(y_test, lin_pred))
#Linear Regression Validation Prediction vs Actual
plt.plot(y_test,c='k',label='Actual')
plt.plot(lin_pred,c='red',label='Predicted')
plt.legend()
plt.show()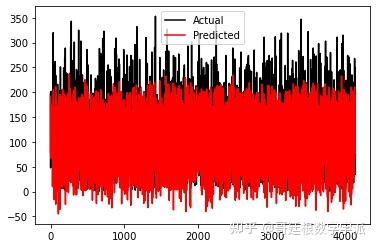
线性回归预测结果
逻辑回归预测结果
#Logistic Regression
# Logistic Regression Validation Performance
logistic_pred = logistic_model.predict(X_test)
print("mean_squared_error >> ", mean_squared_error(y_test, logistic_pred))
print("mean_absolute_error >>",mean_absolute_error(y_test, logistic_pred))
#Logistic Regression Validation Prediction vs Actual
plt.plot(y_test,c='k',label='Actual')
plt.plot(logistic_pred,c='red',label='Predicted')
plt.legend()
plt.show()
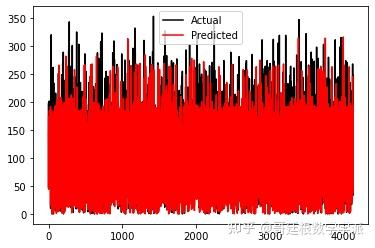
逻辑回归预测结果
模型测试代码
#Testing
forest_model = pickle.load(open('forest_regression.sav', 'rb'))
lin_model = pickle.load(open('linear_regression.sav', 'rb'))
logistic_model = pickle.load(open('logistic_regression.sav', 'rb'))

df_test = pd.read_csv(test_file, sep=" ",header=None)
df_test.drop(columns=[26,27],inplace=True)
df_test.columns = columns
df_test.head()

df_rul = pd.read_csv(RUL_file, names=['rul'])
df_rul.head()

RUL_name = ["Section-1"]
RUL_data = df_test[RUL_name]
MachineID_series = df_test["Section-0"]
grp = RUL_data.groupby(MachineID_series)
max_cycles = np.array([max(grp.get_group(i)["Section-1"]) for i in MachineID_series.unique()])
max_cycles

df_test.drop(df_test[["Section-0",
                "Section-4", # Operatinal Setting
                "Section-5", # Sensor data
                "Section-9", # Sensor data
                "Section-10", # Sensor data
                "Section-14",# Sensor data
                "Section-20",# Sensor data
                "Section-22",# Sensor data
                "Section-23"]], axis=1 , inplace=True)
#df_test = df_test.groupby(["Section-0"])
#print(df_test)

gen = MinMaxScaler(feature_range=(0, 1))
df_test = gen.fit_transform(df_test)
df_test = pd.DataFrame(df_test)
#df_test = df_test.rolling(20).mean()
pt = PowerTransformer()
df_test = pt.fit_transform(df_test)
df_test=np.nan_to_num(df_test)
#Random Forest Testing
forest_pred = forest_model.predict(df_test)
forest_pred = np.array(forest_pred)
forest_pred = forest_pred.flatten()
forest_pred = forest_pred.reshape(forest_pred.shape[0],1)
forest_pred.shape
forest_pred

final_forest_pred = []
count = 0
for i in range(100):
    temp = 0
    j = max_cycles[i]
    while j>0:
        temp = temp + forest_pred[count]
        j=j-1
        count=count+1
    final_forest_pred.append(temp/max_cycles[i])

final_forest_pred=np.array(final_forest_pred)
final_forest_pred = final_forest_pred.flatten()

final_forest_pred[0]
fig = plt.figure(figsize=(18,10))
plt.plot(final_forest_pred,c='red',label='preduction')
plt.plot(df_rul,c='blue',label='y_test')

fig.suptitle('RUL Prediction using Random Forest Regressin Model', fontsize=35)
plt.xlabel("Engine Number", fontsize=35)
plt.ylabel("Remaining Useful Life", fontsize=35)

plt.legend(loc='upper left')
plt.grid()
plt.show()

def scoring_function(actual,predicted):
    d = []
    for i in range(len(predicted)):
        d.append((predicted[i] - actual[i]))
    scores = []
    for i in range(len(d)):
        if d[i] >= 0:
            scores.append(math.exp(d[i]/10) - 1)
        else :
            scores.append(math.exp((-1*d[i])/13) - 1)
    return sum(scores)


print("mean_squared_error >> ", mean_squared_error(df_rul,final_forest_pred))
print("root mean_absolute_error >>",math.sqrt(mean_squared_error(df_rul,final_forest_pred)))
print("mean_absolute_error >>",mean_absolute_error(df_rul,final_forest_pred))
print("scoring function >>",scoring_function(np.array(df_rul),final_forest_pred))

#Linear Regressor Testing
lin_pred = lin_model.predict(df_test)
lin_pred = np.array(lin_pred)
lin_pred = lin_pred.flatten()
lin_pred = lin_pred.reshape(lin_pred.shape[0],1)
lin_pred.shape

final_lin_pred = []
count = 0
for i in range(100):
    temp = 0
    j = max_cycles[i]
    while j>0:
        temp = temp + lin_pred[count]
        j=j-1
        count=count+1
    final_lin_pred.append(temp/max_cycles[i])

final_lin_pred=np.array(final_lin_pred)
final_lin_pred = final_lin_pred.flatten()

fig = plt.figure(figsize=(18,10))
plt.plot(final_lin_pred,c='red',label='prediction')
plt.plot(df_rul,c='blue',label='y_test')

fig.suptitle('RUL Prediction using Linear Regressin Model', fontsize=35)
plt.xlabel("Engine Number", fontsize=35)
plt.ylabel("Remaining Useful Life", fontsize=35)

plt.legend(loc='upper left')
plt.grid()
plt.show()

def scoring_function(actual,predicted):
    d = []
    for i in range(len(predicted)):
        d.append((predicted[i] - actual[i]))
    scores = []
    for i in range(len(d)):
        if d[i] >= 0:
            scores.append(math.exp(d[i]/10) - 1)
        else :
            scores.append(math.exp((-1*d[i])/13) - 1)
    return sum(scores)

print("mean_squared_error >> ", mean_squared_error(df_rul,final_lin_pred))
print("root mean_absolute_error >>",math.sqrt(mean_squared_error(df_rul,final_lin_pred)))
print("mean_absolute_error >>",mean_absolute_error(df_rul,final_lin_pred))
print("scoring function >>",scoring_function(np.array(df_rul),final_lin_pred))
# scoring_function(np.array(df_rul),final_lin_pred)

#Logistic Regressor Testing
logistic_pred = logistic_model.predict(df_test)
logistic_pred = np.array(logistic_pred)
logistic_pred = logistic_pred.flatten()
logistic_pred = logistic_pred.reshape(logistic_pred.shape[0],1)
logistic_pred.shape

final_logistic_pred = []
count = 0
for i in range(100):
    temp = 0
    j = max_cycles[i]
    while j>0:
        temp = temp + logistic_pred[count]
        j=j-1
        count=count+1
    final_logistic_pred.append(temp/max_cycles[i])

final_logistic_pred=np.array(final_logistic_pred)
final_logistic_pred = final_logistic_pred.flatten()

fig = plt.figure(figsize=(18,10))
plt.plot(final_logistic_pred,c='red',label='prediction')
plt.plot(df_rul,c='blue',label='y_test')

fig.suptitle('RUL Prediction using Logistic Regressin Model', fontsize=35)
plt.xlabel("Engine Number", fontsize=35)
plt.ylabel("Remaining Useful Life", fontsize=35)

plt.legend(loc='upper left')
plt.grid()
plt.show()

print("mean_squared_error >> ", mean_squared_error(df_rul,final_logistic_pred))
print("root mean_squared_error >> ", math.sqrt(mean_squared_error(df_rul,final_logistic_pred)))
print("mean_absolute_error >>",mean_absolute_error(df_rul,final_logistic_pred))
print("scoring function >>",scoring_function(np.array(df_rul),final_logistic_pred))
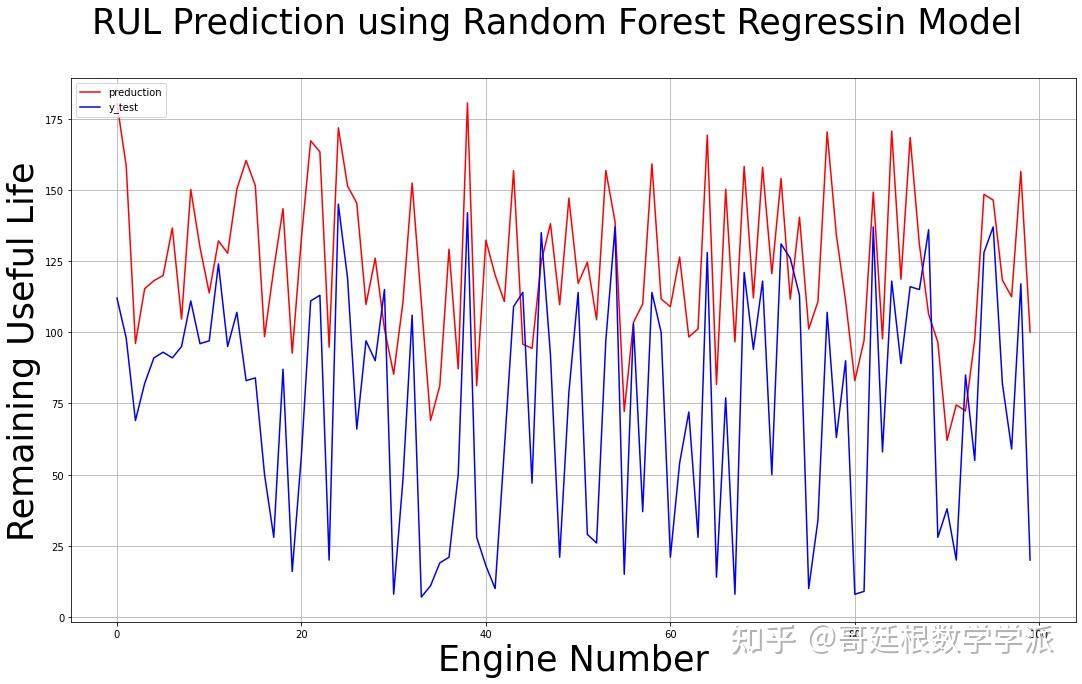
随机森林模型预测结果
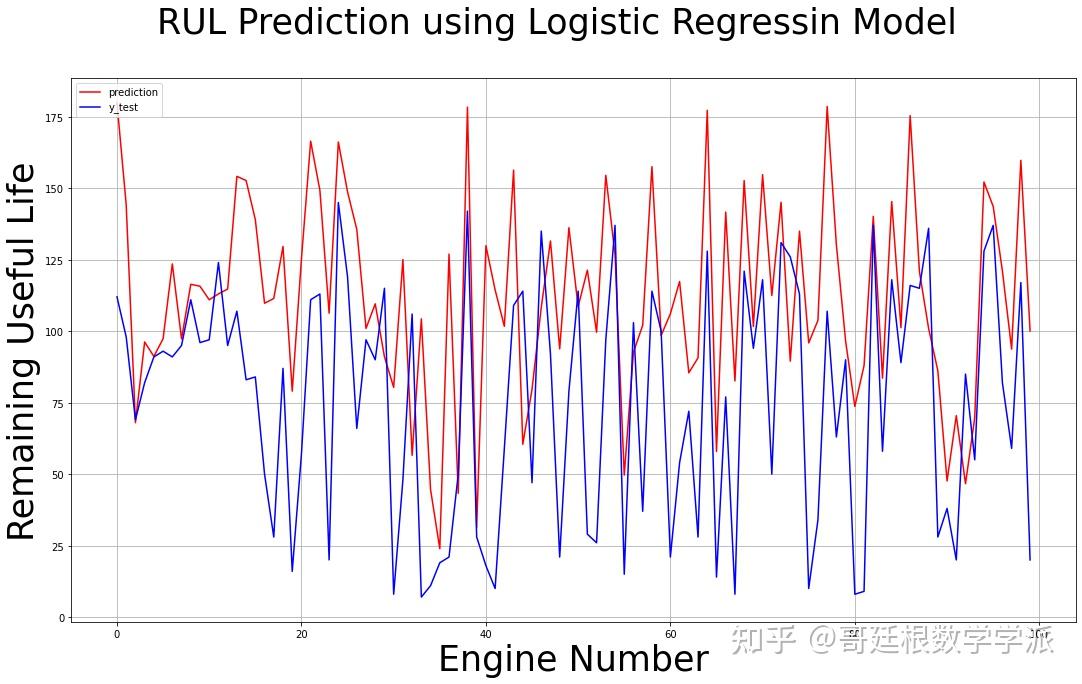
逻辑回归模型预测结果
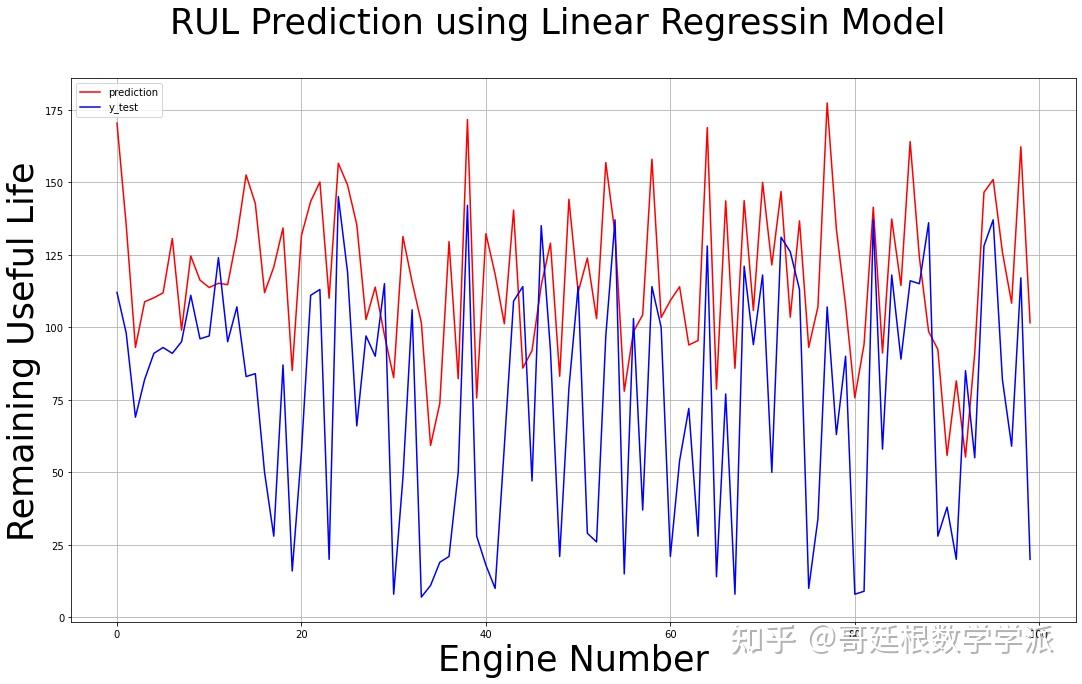
线性回归模型预测结果
学术咨询

担任《Mechanical System and Signal Processing》《中国电机工程学报》等期刊审稿专家,擅长领域:信号滤波/降噪,机器学习/深度学习,时间序列预分析/预测,设备故障诊断/缺陷检测/异常检测。
Python环境下基于机器学习的NASA涡轮风扇发动机剩余使用寿命RUL预测
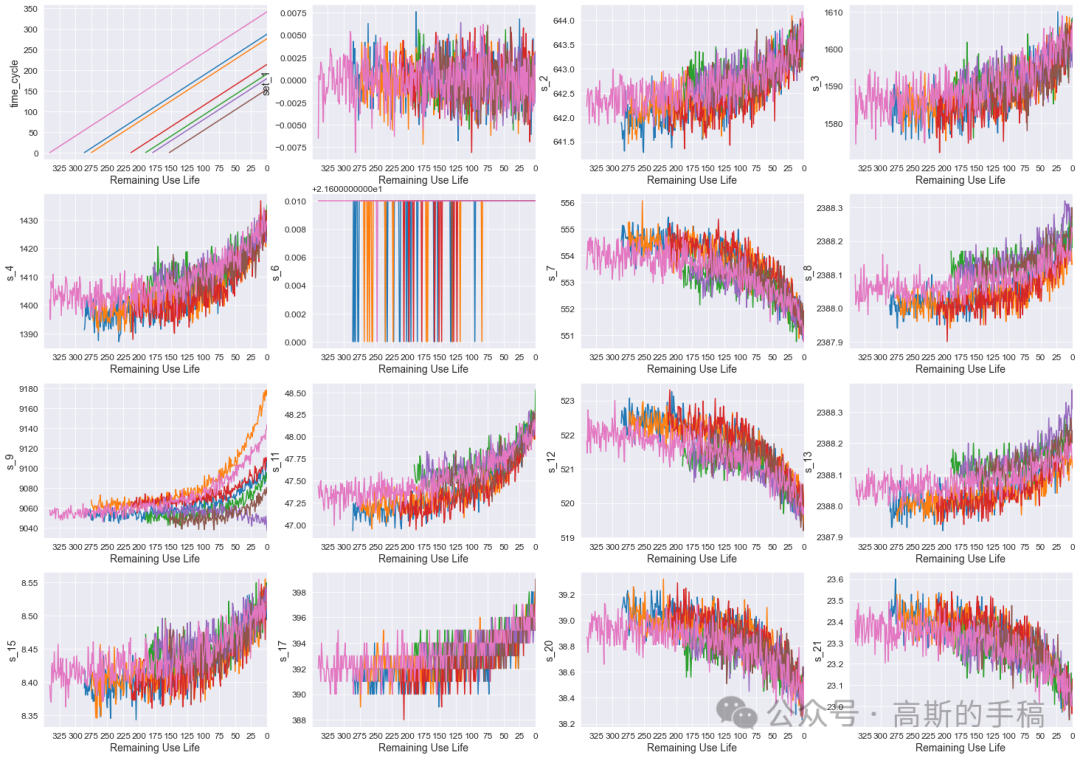
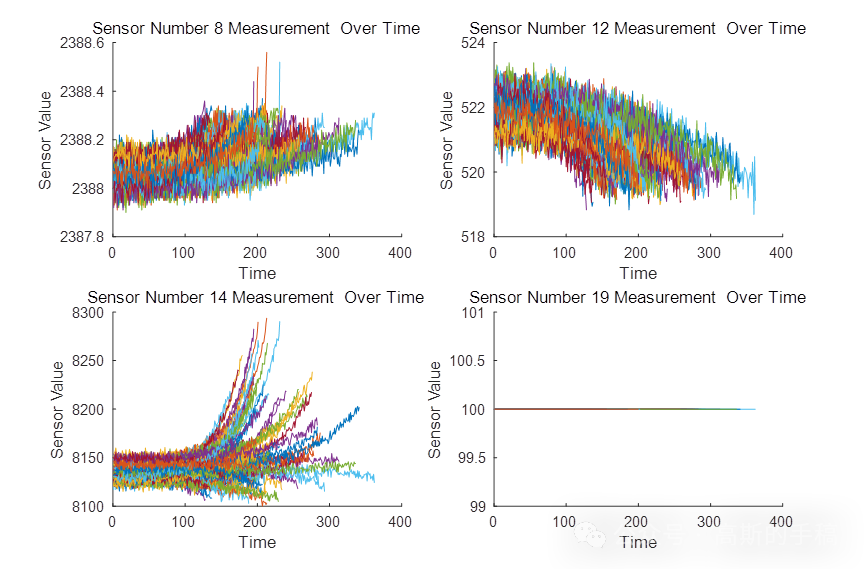
C-MAPSS数据集是美国NASA发布的涡轮风扇发动机数据集,其中包含不同工作条件和故障模式下涡轮风扇发动机多源性能的退化数据,共有4个子数据集,每个子集又可分为训练集、测试集和RUL标签。其中,训练集包含航空发动机从开始运行到发生故障的所有状态参数;测试集包含一定数量发动机从开始运行到发生故障前某一时间点的全部状态参数;RUL标签记录测试集中发动机的RUL值,可用于评估模型的RUL预测能力。
程序为Python编写,运行环境为Spyder IDE,采用8种机器学习方法对NASA涡轮风扇发动机进行剩余使用寿命RUL预测,8种方法分别为:Linear Regression,SVM regression,Decision Tree regression,KNN model,Random Forest,Gradient Boosting Regressor,Voting Regressor,ANN Model。
所用模块如下:
import pandas as pd
import seaborn as sns
import numpy as np
import matplotlib.pyplot as plt
from sklearn.preprocessing import StandardScaler
from sklearn.model_selection import train_test_split
from sklearn.linear_model import LinearRegression
from sklearn.svm import SVR
from sklearn.tree import DecisionTreeRegressor
from sklearn.ensemble import RandomForestRegressor
from sklearn.metrics import mean_squared_error, r2_score
import tensorflow as tf
from tensorflow.keras.layers import Dense

完整代码和数据可通过学术咨询获得:

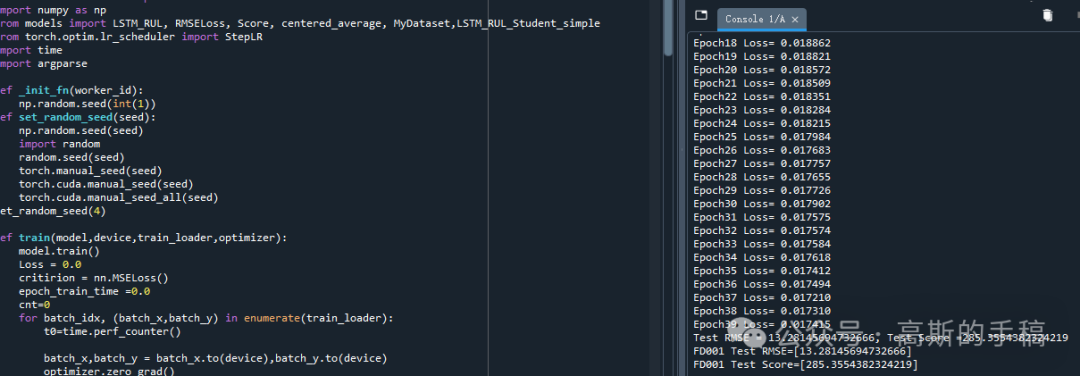
Python环境下采用知识蒸馏框架压缩深度神经网络并用于涡扇发动机剩余使用寿命预测
完整代码和数据可通过学术咨询获得:

基于门控卷积单元增强的Transformer编码器NASA涡扇发动机退化仿真数据集剩余使用寿命RUL预测(Python)
所使用的模块版本如下:
python==3.8.8
numpy==1.20.1
pandas==1.2.4
matplotlib==3.3.4
pytorch==1.8.1
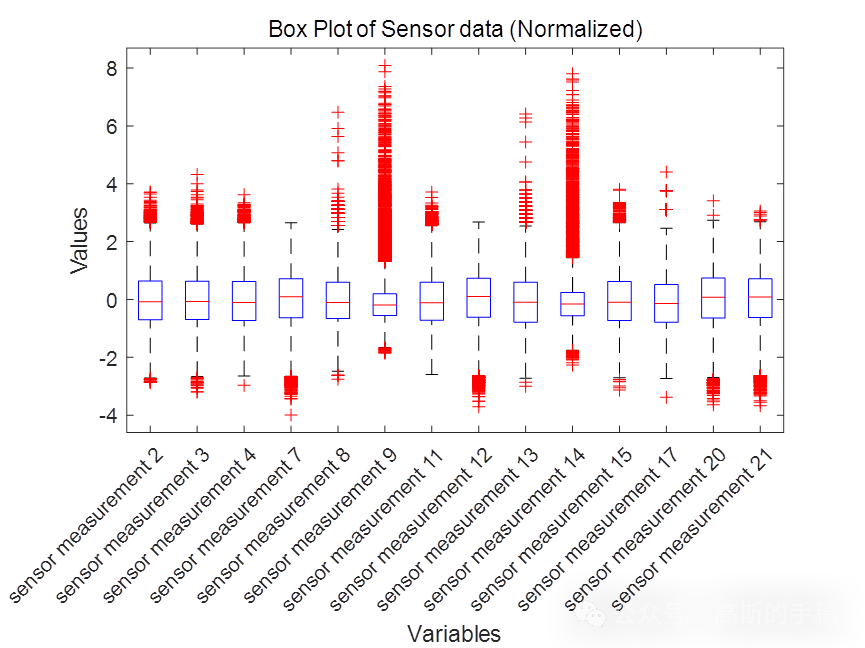
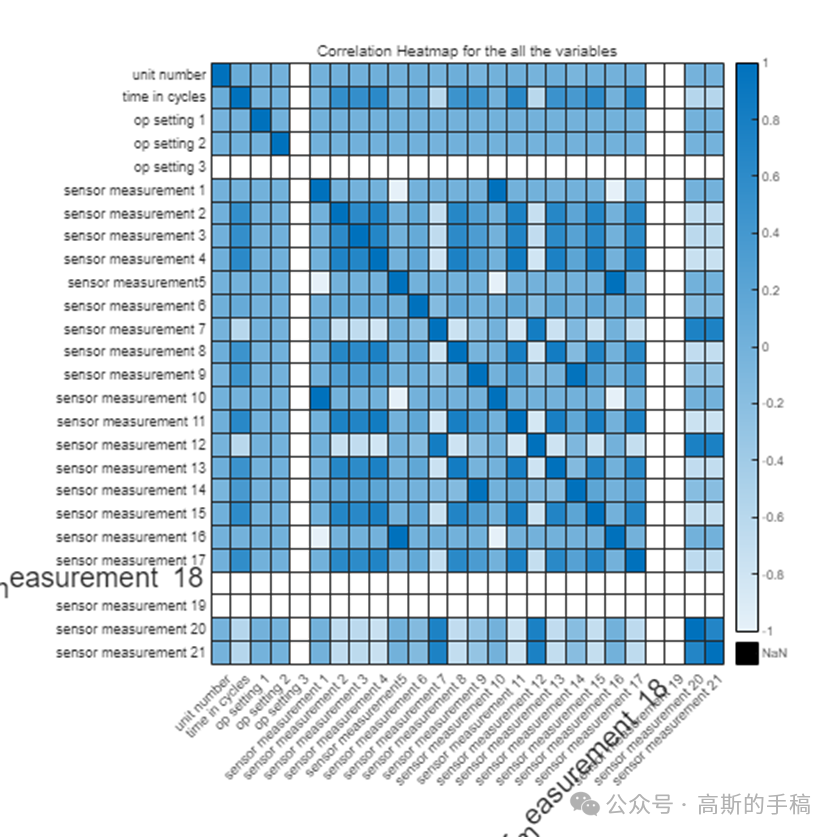
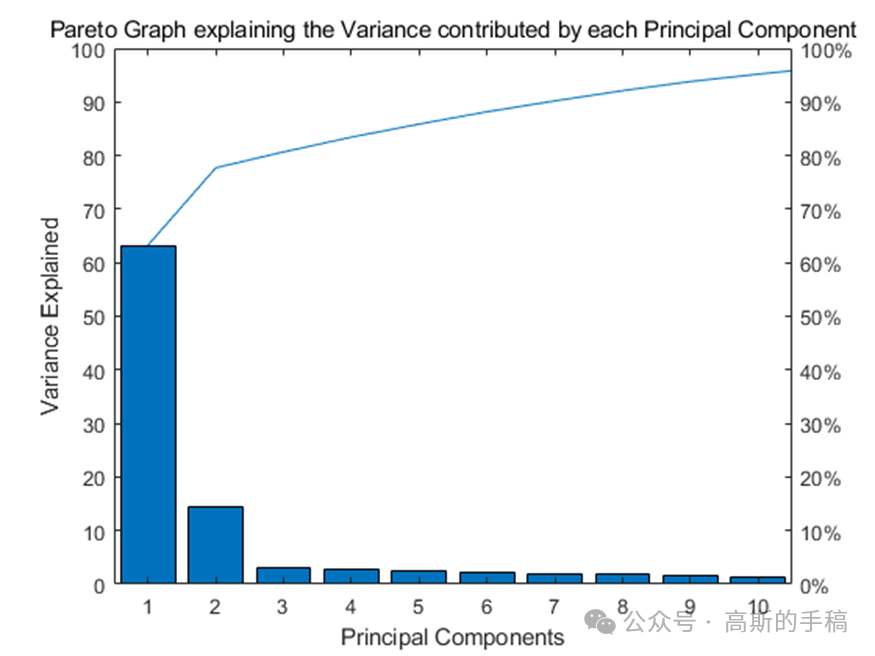
基于机器学习的NASA涡轮风扇发动机数据分析(MATLAB R2021B)
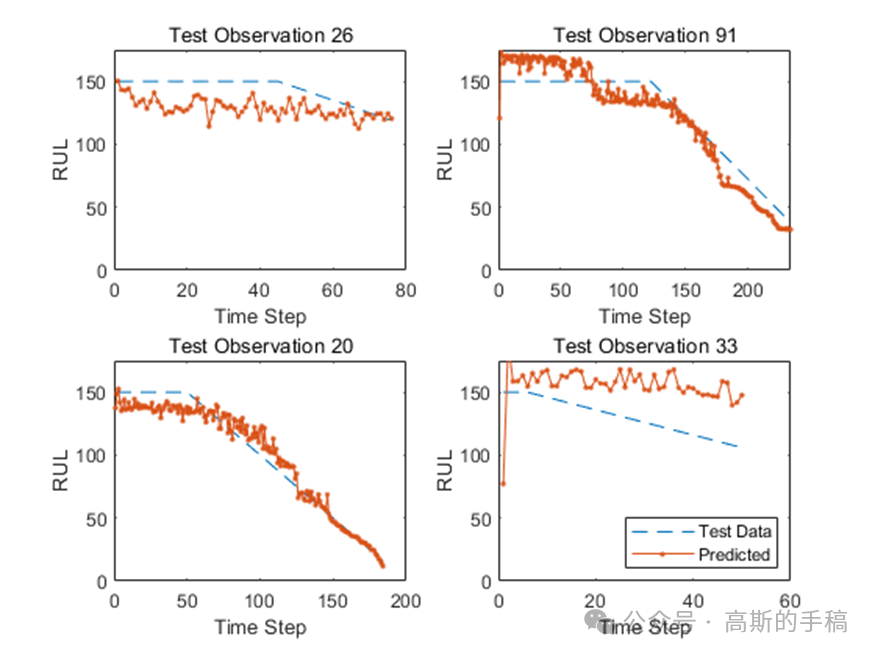
基于深度学习的NASA涡扇发动机退化仿真数据集剩余使用寿命预测(MATLAB R2018)
完整代码和数据可通过学术咨询获得:


 1986
1986

 被折叠的 条评论
为什么被折叠?
被折叠的 条评论
为什么被折叠?
 到【灌水乐园】发言


