


欢迎大家关注全网生信学习者系列:
- WX公zhong号:生信学习者
- Xiao hong书:生信学习者
- 知hu:生信学习者
- CDSN:生信学习者2
介绍
本教程旨在通过不同的图表来可视化微生物组的生物标志物。
数据
大家通过以下链接下载数据:
- 百度网盘链接:https://pan.baidu.com/s/1f1SyyvRfpNVO3sLYEblz1A
- 提取码: 请关注WX公zhong号_生信学习者_后台发送 复现msm 获取提取码
Deviation plot
R packages required
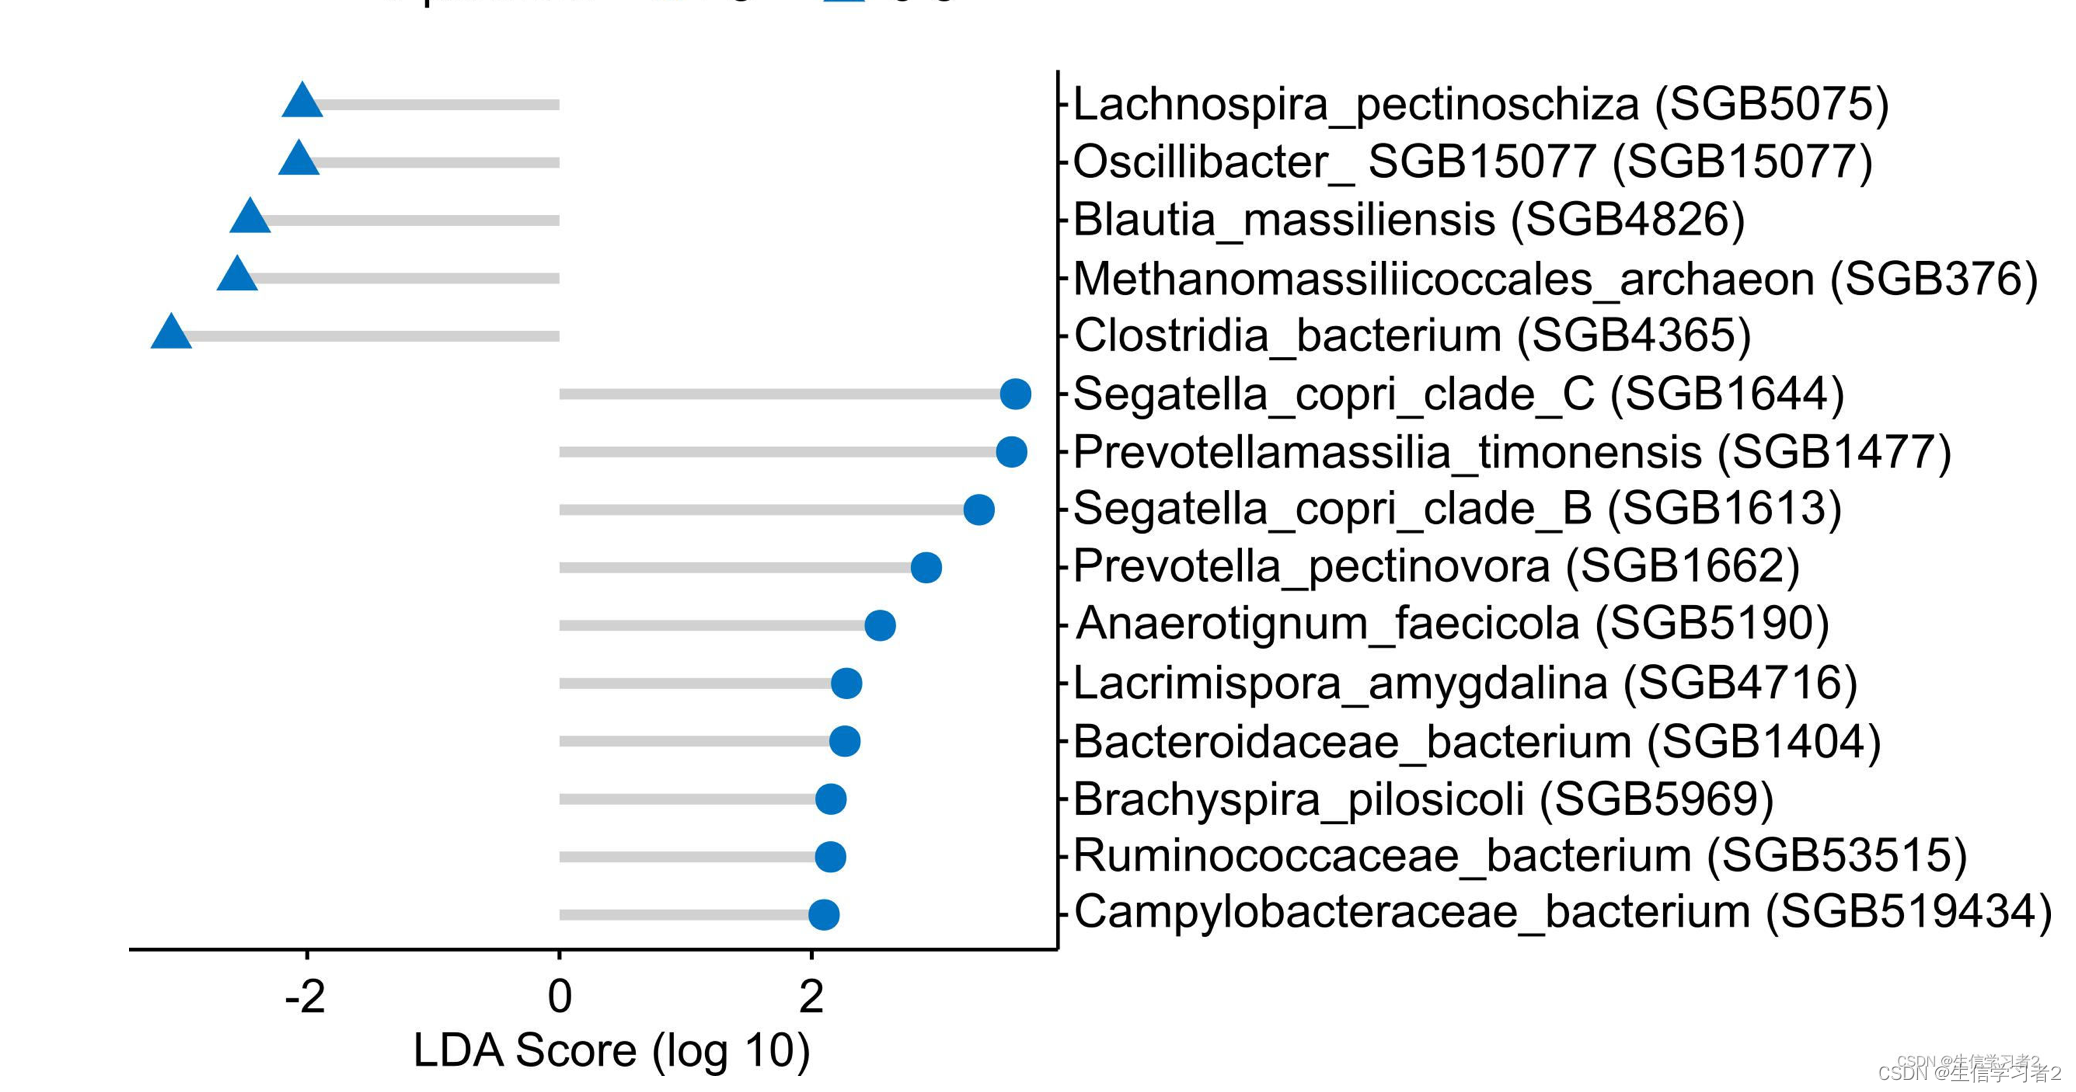
在本教程中,我们将使用R包ggpubr中的ggdotchart 函数来可视化与MSM个体中性伴侣数量相关的LefSe生物标志物: biomarkers: ./data/npartners_lefse_deviation_plot.tsv。
- 加载
biomarkers: ./data/npartners_lefse_deviation_plot.tsv.
npartner_lefse_df <- data.frame(read.csv("./data/npartners_lefse_deviation_plot.tsv", header = TRUE, sep = "\t"))
- 画图
library(ggpubr)

ggdotchart(npartner_lefse_df, x = "feature", y = "lda_score",
           color = "class",
           palette = c("#0073C2FF", "#0073C2FF")
           sorting = "descending",
           add = "segments",
           add.params = list(color = "lightgray", size = 1.5),
           group = "class",
           rotate = T,
           dot.size = 4,
           shape = "class",
           ggtheme = theme_pubr()) +
  theme(text = element_text(size = 13, family = "Arial")) +
  scale_x_discrete(position = "top")
UpSet plot
R packages required
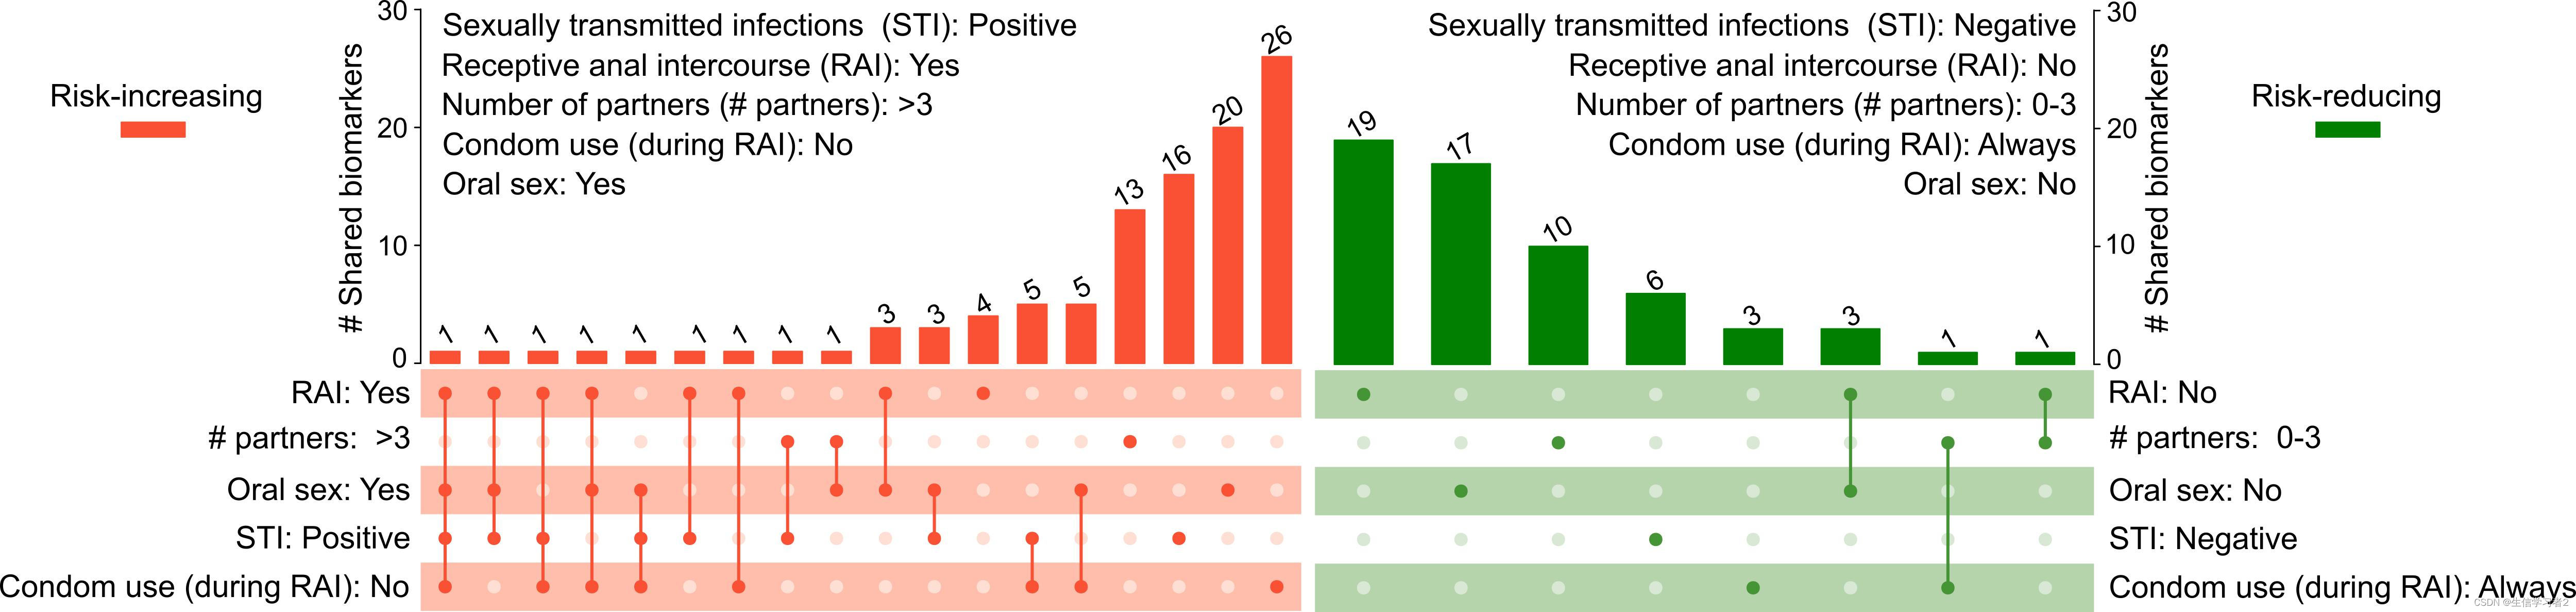
在这一部分,我们将向您展示如何使用UpSet图来可视化与多个群体相关的LefSe生物标志物。我们的数据data: ./data/UpSet_matrix1.tsv包含了与性行为相关的LefSe生物标志物,包括接受肛交RAI: Yes (receiving anal intercourse), having >3 sexual partners (# partners: >3), practicing oral sex (Oral sex: Yes), diagnosed with sexually transmitted infection (STI: Positive), condomless during RAI (Condom use (during RAI): No)。首先加载我们的数据 data: ./data/UpSet_matrix1.tsv。
library(ComplexHeatmap)

upset_matrix <- data.frame(read.csv("./data/UpSet_matrix1.tsv",
                                    header = TRUE,
                                    sep = "\t"))
rownames(upset_matrix) <- upset_matrix[, colnames(upset_matrix)[[1]]]
upset_matrix[, colnames(upset_matrix)[[1]]] <- NULL
upset_matrix <- upset_matrix[as.logical(rowSums(upset_matrix != 0)),] # This step is optional.
一旦数据加载完成,我们可以使用在ComplexHeatmap包中实现的UpSet()函数来绘制一个UpSet图
comb <- make_comb_mat(upset_matrix, mode = "intersect") # generate combination data
c_size <- comb_size(comb) # find combination sizes for setting order later
sets <- c("RAI.yes", "X.partners.3", "Oral.yes",  "STI.positive", "condom.no") # manually set the set order

upset_plot <- ComplexHeatmap::UpSet(
      comb,
      comb_col = "#fb5238", # the color for combination columns
      bg_col = "#ffbeab", # the color for background of columns
      bg_pt_col = "#ffdfd5", # the color for background of column patches
      set_order = sets,
      comb_order = order(c_size),
      top_annotation = HeatmapAnnotation(
          "# shared taxonomic biomarkers" = anno_barplot(c_size,
                                                         ylim = c(0, max(c_size)*1.1),
                                                         border = FALSE,
                                                         gp = gpar(fill = "#fb5238", col = "#fb5238"),
                                                         height = unit(8, "cm")),
          annotation_name_side = "left",
          annotation_name_rot = 90),
          right_annotation = NULL)
- 生成了基本框架之后,接下来我们将使用
decorate_annotation函数在条形图上显示值:
upset_plot <- draw(upset_plot)
col_order <- column_order(upset_plot)

decorate_annotation("# shared taxonomic biomarkers", {
  grid.text(c_size[col_order], x = seq_along(c_size), y = unit(c_size[col_order], "native") + unit(2, "pt"),
            default.units = "native", just = c("left", "bottom"),
            gp = gpar(fontsize = 6, col = "#404040"), rot = 45)
})
类似的代码可以用于另一组与特定条件或群体相关的LefSe生物标志物: RAI: No (not receiving anal intercourse), having 0-3 sexual partners (# partners: 0-3), not practicing oral sex (Oral sex: No), free from sexually transmitted infection (STI: Negative), use condom during RAI (Condom use (during RAI): Yes).
Lollipop plot
R packages required
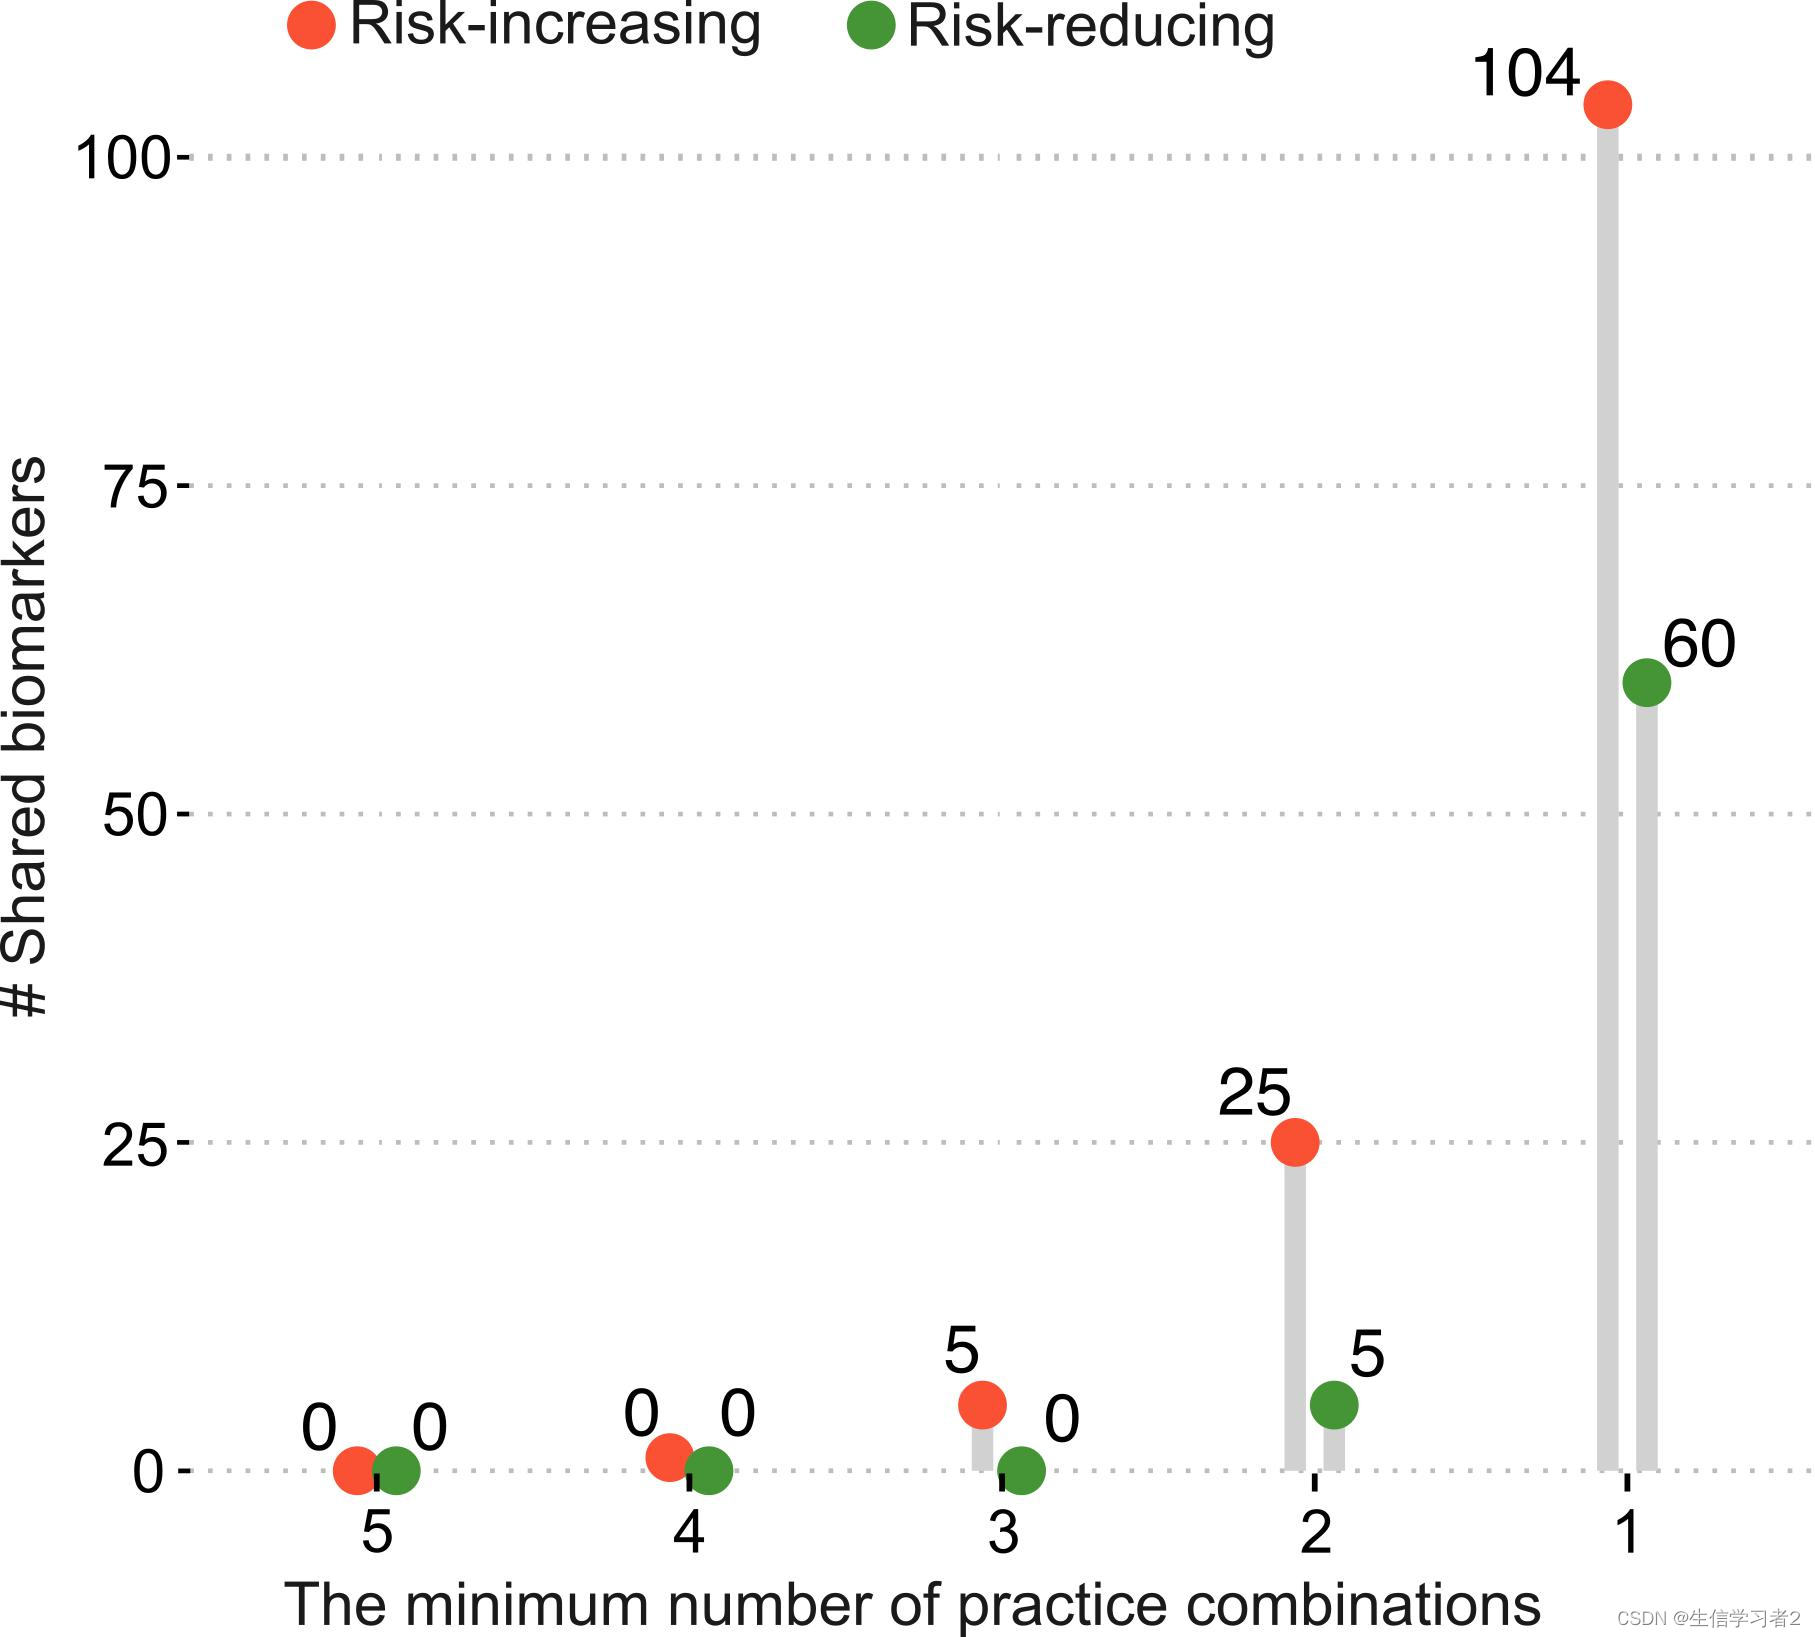
在最后一节中,我们将使用棒棒糖图来展示与不同性行为相关的共享生物标志物的数量。这里,您可以直接从我们准备好的文件shared_biomarkers.tsv: ./data/shared_biomarkers.tsv开始,该文件包含了不同性行为(分类为风险增加和风险减少)共享的LefSe生物标志物的数量。加载shared_biomarkers.tsv: ./data/shared_biomarkers.tsv
library(ggpubr)
shared_biomarkers <- data.frame(read.csv("./data/shared_biomarkers.tsv", header = TRUE, sep = "\t"))
一旦数据加载完成,我们使用在ggpubr包中实现的 ggdotchart函数来进行可视化。这个函数非常适合创建点状图,可以用来展示不同组别或条件下的数值,例如生物标志物的丰度或数量。通过 ggdotchart,您可以轻松地添加误差线、调整点的大小和颜色,以及自定义图表的其他视觉元素,以更清晰地传达数据信息。
ggdotchart(shared_biomarkers, x = "group.number", y ="shared.biomarker.number",
           color = "type", palette = c("#fb5238", "#469537"), size = 5,
           add = "segment",
           shape = 19,
           group = "cate",
           add.params = list(color = "lightgray", size = 2.5),
           position = position_dodge(0.25),
           ggtheme = theme_pubclean()) +
  geom_text(aes(label = n_common_sps, group = cate),
      position = position_dodge(0.8),
      vjust = -0.5, size = 3.5)


 326
326


 被折叠的 条评论
为什么被折叠?
被折叠的 条评论
为什么被折叠?
 到【灌水乐园】发言


