


提要:
本次实验给了我三个样品ABC,其中A是单端测序仅有一个文件,B,C为双端测序,有两个文件。给我的数据都是clean data,因此我没有进行质控,直接从STAR比对开始,然后利用了rsem进行转录本定量。利用DEseq2进行差异表达分析。其中分组为B相对与A上调的基因为upAB,B相对于C上调的基因为upBC。分别找到两组上调基因后去overlap共同的基因,然后将这些overlap到的基因做个火山图。
寻找上调差异基因
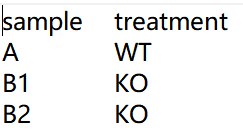
** 设计一个sampleAB,BC.txt的文件 **
** 以及一个gene_trans.txt文件 **
awk '{print $1,"\t"$2}' *.isoforms.results > gene_trans.txt

** 寻找差异基因**
setwd("F:/rnaseq/dongfeng/2021_8_16/data2")
library(DESeq2)
library(ggplot2)
library(clusterProfiler)
library(ggrepel)
library(org.Hs.eg.db)
library(tidyverse)
library(apeglm)
library(tximport)
library(stringr)

sampleAB<-read.table("sampleAB.txt",sep = "\t",header = T)
sampleAB$condition <- factor(c(rep("control", 1), rep("treatment", 2)), levels = c("control","treatment"))
sampleBC<-read.table("sampleBC.txt",sep = "\t",header = T)
sampleBC$condition <- factor(c(rep("control", 2), rep("treatment", 2)), levels = c("control","treatment"))

rownames(sampleAB)<-sampleAB$sample
rownames(sampleBC)<-sampleBC$sample
files <- paste(sampleAB$sample,".genes.results",sep="")
files
filesBC <- paste(sampleBC$sample,".genes.results",sep="")
filesBC

txi<-tximport(files,type="rsem",tx2gene=tx2gene)
txi$length[txi$length == 0] <- 1
txiBC<-tximport(filesBC,type="rsem",tx2gene=tx2gene)
txiBC$length[txiBC$length == 0] <- 1

ddsTxi<-DESeqDataSetFromTximport(txi,colData = sampleAB,design = ~condition)
ddsTxi <- DESeq(ddsTxi)
ddsTxiBC<-DESeqDataSetFromTximport(txiBC,colData = sampleBC,design = ~condition)
ddsTxiBC <- DESeq(ddsTxiBC)

resTxi <- results(ddsTxi,contrast = c("condition","control","treatment"))
resTxi <- lfcShrink(ddsTxi,coef="condition_treatment_vs_control", type="apeglm")
resTxiBC <- results(ddsTxiBC,contrast = c("condition","control","treatment"))
resTxiBC <- lfcShrink(ddsTxiBC,coef="condition_treatment_vs_control", type="apeglm")

resTxi <- subset(resTxi, padj < 0.05 & abs(log2FoldChange) > 1)
resTxi <- resTxi[order(abs(resTxi$log2FoldChange),decreasing = TRUE),]
write.csv(resTxi,file = "DESeqAB2-Txi.csv")
resTxiBC <- subset(resTxiBC, padj < 0.05 & abs(log2FoldChange) > 1)
resTxiBC <- resTxiBC[order(abs(resTxiBC$log2FoldChange),decreasing = TRUE),]
write.csv(resTxiBC,file = "DESeqBC2-Txi.csv")

resSigUpAB <- subset(resTxi, padj < 0.05 & log2FoldChange >1 )
write.csv(resSigUpAB,file = "resSigUpAB.csv")
resSigUpBC <- subset(resTxiBC, padj < 0.05 & log2FoldChange >1 )
write.csv(resSigUpBC,file = "resSigUpBC.csv")
#↑ 找的是log2FoldChange >1的上调的基因

#↓  由于resSigUpAB的第一列是ENSEMBL ID,但是没有行名,因此加上个行名"gene_id",另存文件为resSigUpABid.csv
ABup<- read.csv("resSigUpABid.csv",header = T)
View(ABup)

#该数据中ENSEMBL id存在小数,有小数是不能转SYMBOL等id的,因此先去掉小数。
ABup$gene_id=unlist(str_split(ABup$gene_id,"[.]",simplify=T))[,1]
symbolidABUP = bitr(ABup$gene_id,
                    fromType="ENSEMBL",
                    toType="SYMBOL",
                    OrgDb="org.Hs.eg.db")
write.csv(symbolidABUP,file = "symbolidABUP.csv")
BCup<- read.csv("resSigUpBCid.csv",header = T)
BCup$gene_id=unlist(str_split(BCup$gene_id,"[.]",simplify=T))[,1]
symbolidBCUP = bitr(BCup$gene_id,
                    fromType="ENSEMBL",
                    toType="SYMBOL",
                    OrgDb="org.Hs.eg.db")
write.csv(symbolidBCUP,file = "symbolidBCUP.csv")

#此处,从A.genes.results文件复制内容到excel中,并筛选出后面要做heatmap的数据,如TPM,FPKM,COUNT等,!!!一定要留下ENSEMBL号,方便merge
Acount<- read.csv("Acount.csv",header = T)
Acount$gene_id=unlist(str_split(Acount$gene_id,"[.]",simplify=T))[,1]
write.csv(Acount,file = "Acountid.csv")
Bcount<- read.csv("Bcount.csv",header = T)
Bcount$gene_id=unlist(str_split(Bcount$gene_id,"[.]",simplify=T))[,1]
write.csv(Bcount,file = "Bcountid.csv")
Ccount<- read.csv("Ccount.csv",header = T)
Ccount$gene_id=unlist(str_split(Ccount$gene_id,"[.]",simplify=T))[,1]
write.csv(Ccount,file = "Ccountid.csv")
然后去找overlap。###
将得到的 文件上传到服务器上进行overlap
sort symbolidABUP.csv symbolidBCUP.csv | uniq -d > overlapAB_BC.csv
即可得到overlapAB_BC.csv文件
heatmap数据准备
# 将最后需要合并的去做heatmap的文件添加到另一个文件夹下,方便读取。
setwd("F:/rnaseq/dongfeng/2021_8_16/data2/heatmap")
library(dplyr)
A <- read.csv("Acountid.csv",header = F)
B <- read.csv("Bcountid.csv",header = F)
C <- read.csv("Ccountid.csv",header = F)
OVER <- read.csv("overlapAB_BC.csv",header = F)
OVERA <- left_join(OVER, A, by ='V1')
OVERAB <- left_join(OVERA, B, by ='V1')
OVERABC <- left_join(OVERAB, C, by ='V1')
画图
BiocManager::install("gplots")
install.packages("pheatmap")
library(gplots)
library(pheatmap)
heatABC <- read.csv("OVERABC.csv",header = T)
data <- read.csv("OVERABC.csv", header = T, row.names = 1)
#pheatmap(as.matrix(data), scale='row', border_color=NA, width=9, height=50, fontsize=9, fontsize_row=10,cluster_col=F, filename="heatmap2.pdf" )
pheatmap(data, scale='row', border_color=NA, width=5, height=50, fontsize=20, fontsize_row=20,cluster_col=F, filename="heatmap4.pdf" )


 1807
1807


 被折叠的 条评论
为什么被折叠?
被折叠的 条评论
为什么被折叠?
 到【灌水乐园】发言


