


 本文介绍了如何使用Unity Test Runner和Unity Performance Testing Extension在Unity中进行性能基准测试。通过示例项目和详细步骤,展示了如何收集性能指标、创建基准、比较性能测试结果,并跟踪性能变化。这对于确保游戏在不同平台上的流畅运行和优化SDK、驱动程序等至关重要。

怎么在unity中测试游戏
As a Unity developer, you want your users to love playing your games, enjoying a smooth experience across all the platforms they may play on. What if I told you that we just made it easier to create performance benchmarks? If you want to learn how to develop games or Unity tools with an eye on performance, please read on!
作为Unity开发人员,您希望用户喜欢玩游戏,在他们可能玩过的所有平台上享受流畅的体验。 如果我告诉您我们使创建性能基准变得更加容易怎么办? 如果您想学习如何着眼于性能来开发游戏或Unity工具,请继续阅读!
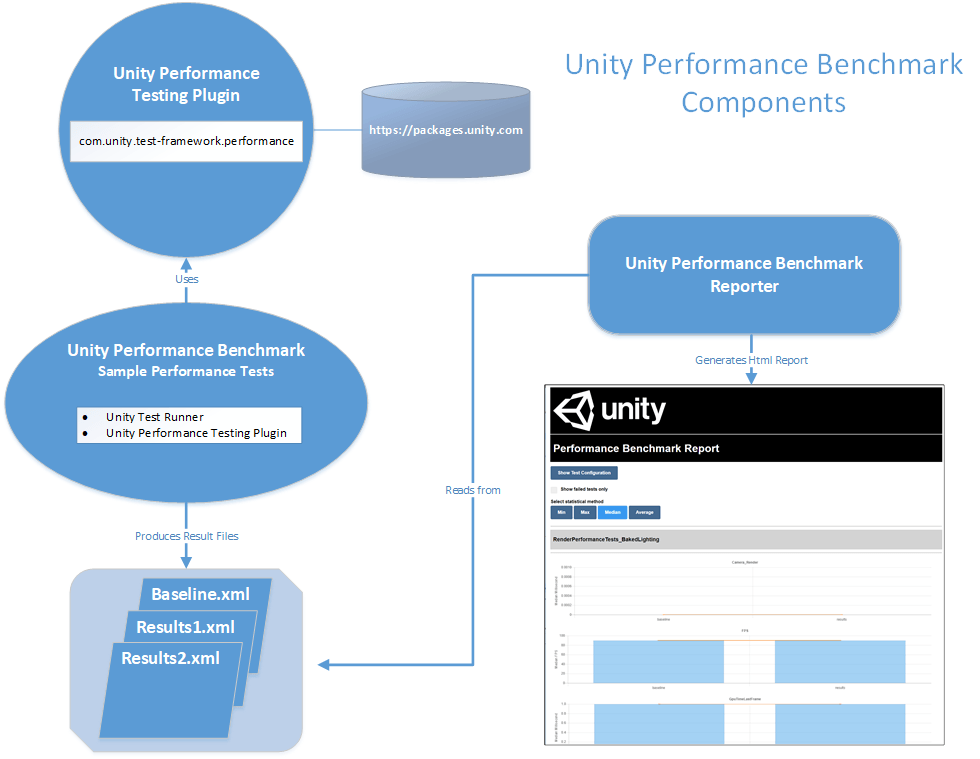
In this post, I explain how to use a couple of Unity tools that give you an easy way to start collecting performance metrics and creating benchmarks with them: the Unity Test Runner that ships with the Unity Editor, the Unity Performance Testing Extension, and the Unity Performance Benchmark Reporter.
在本文中,我将说明如何使用几个Unity工具,这些工具为您提供了一种简单的方法来开始收集性能指标并使用它们创建基准:Unity编辑器附带的Unity Test Runner , Unity Performance Testing Extension和Unity Performance Benchmark Reporter 。
为什么要在Unity中对性能进行基准测试? (Why Benchmark Performance in Unity?)
As a Unity Developer, you might find yourself in the following situation: your project was running fast and smooth not too long ago, but then one or more changes have come in, and now scenes are noticeably slow, frames are dropping, and other performance issues have started popping up. Tracking which changes led to the performance regression can be difficult.
作为Unity开发人员,您可能会遇到以下情况:项目不久前运行很快且流畅,但是随后进行了一个或多个更改,现在场景明显变慢,帧掉落以及其他性能问题开始出现。 跟踪导致性能下降的更改可能很困难。
If you’re a Unity Partner, you want to understand the performance changes across your SDKs, drivers, platforms, packages, or other artefacts. Or you’d like to collect performance metrics across different versions of Unity with your products, but it’s not very clear how to do this and then make the comparisons.
如果您是Unity合作伙伴,则希望了解SDK,驱动程序,平台,软件包或其他工件之间的性能变化。 或者,您想收集产品在不同版本的Unity中的性能指标,但是还不清楚如何执行然后进行比较。
Those are just a couple of examples where establishing performance benchmarks can really save the day. Now, let me show you how you can start collecting performance metrics, create benchmarks with them, and visualize changes in performance metrics.
这些只是建立性能基准可以真正节省时间的几个例子。 现在,让我向您展示如何开始收集性能指标,使用它们创建基准并可视化性能指标的变化。
下载样例项目 (Download the Sample Project)
For this discussion, we’ll be looking at the test code in the UnityPerformanceBenchmark sample performance test project.
对于此讨论,我们将在UnityPerformanceBenchmark示例性能测试项目中查看测试代码。
Download the latest XRAutomatedTests release from GitHub. You’ll find the UnityPerformanceBenchmark project in the PerformanceTests subdirectory.
从GitHub下载最新版本的XRAutomatedTests 。 您可以在PerformanceTests子目录中找到UnityPerformanceBenchmark项目。
在Unity Test Runner中编写性能测试 (Writing Performance Tests in Unity Test Runner)
The UnityPerformanceBenchmark project contains a variety of sample scenes that are in turn used in Unity Performance Tests using the Unity Performance Testing Extension.
UnityPerformanceBenchmark项目包含各种示例场景,这些示例场景又在使用Unity Performance Testing Extension的Unity Performance Tests中使用。
The first thing we’re going to do is take a look at how we write performances test using the Unity Test Runner with the Unity Performance Testing Extension. Here is a bit of background info on both of these tools before we proceed.
我们要做的第一件事是看看如何使用带有Unity Performance Testing Extension的Unity Test Runner编写性能测试。 在继续之前,下面是有关这两种工具的一些背景信息。
Unity测试运行器 (Unity Test Runner)
We’re using the Unity Test Runner to run our performance tests. The Unity Test Runner is a test execution framework built into the Unity Editor allowing you to test your code in both Edit and Play mode on target platform players such as Standalone, Android, or iOS. If you aren’t familiar with the Unity Test Runner, check out the Unity Test Runner documentation.
我们正在使用Unity Test Runner运行性能测试。 Unity Test Runner是Unity编辑器中内置的测试执行框架,可让您在目标平台播放器(例如Standalone,Android或iOS)上以Edit和Play模式测试代码。 如果您不熟悉Unity Test Runner,请查看Unity Test Runner文档 。
Unity性能测试扩展 (Unity Performance Testing Extension)
The Unity Performance Testing Extension is a Unity Editor package that provides an API and test case attributes allowing you to sample and aggregate both Unity profiler markers and non-profiler custom metrics, in the Unity Editor and players. You can learn more by checking out the Unity Performance Testing Extension documentation, but we’re going to look at some examples here.
Unity Performance Testing Extension是一个Unity Editor 软件包 ,它提供API和测试用例属性,使您可以在Unity Editor和播放器中采样和聚合Unity Profiler标记和非Profiler自定义指标。 您可以通过查看Unity Performance Testing Extension文档来了解更多信息 ,但是我们将在此处查看一些示例。
The Unity Performance Test Extension requires Unity 2018.1 or higher. Be sure to use Unity version 2018.1 or higher if you want to run the sample performance tests in the UnityPerformanceBenchmark project or whenever you are using the Unity Performance Test Extension.
Unity Performance Test Extension需要Unity 2018.1或更高版本。 如果要在UnityPerformanceBenchmark项目中运行示例性能测试,或者在每次使用Unity Performance Test Extension时,请确保使用Unity版本2018.1或更高版本。
使用命令行打开示例项目 (Open the Sample Project Using the Command Line)
The UnityPerformanceBenchmark project implements the IPrebuildSetup interface, a Unity Test Runner facility, where we can implement a Setup method that is automatically called before the test run is executed by the Unity Test Runner.
UnityPerformanceBenchmark项目实现IPrebuildSetup接口,这是Unity Test Runner工具,我们可以在其中实现Setup方法,该方法在Unity Test Runner执行测试运行之前会自动调用。
The first thing the UnityPerformanceBenchmark project’s IPrebuildSetup.Setup method does is parse the command line arguments looking for player build settings. This allows us to flexibly build the player for our performance tests using the same Unity project against different platforms, render threading modes, player graphics APIs, scripting implementations, and XR-enabled settings such as stereo rendering path and VR SDKs.
UnityPerformanceBenchmark项目的IPrebuildSetup.Setup方法要做的第一件事是解析命令行参数,以查找播放器生成设置。 这使我们能够针对不同的平台,渲染线程模式,播放器图形API,脚本实现以及启用XR的设置(例如立体声渲染路径和VR SDK)针对同一平台使用相同的Unity项目灵活地为性能测试构建播放器。
Thus, we’ll need to open the UnityPerformanceBenchmark project with Unity from the command line, passing in the player build options we want to use when we run the tests in the Unity Test Runner.
因此,我们需要从命令行通过Unity打开UnityPerformanceBenchmark项目,并传入我们在Unity Test Runner中运行测试时要使用的播放器构建选项。
Example: Launch UnityPerformanceBenchmark project from Windows to Build Android Player:
示例:从Windows启动UnityPerformanceBenchmark项目以构建Android Player:
|
1
2
3
|
Unity.exe -projectPath
C:\XRAutomatedTests-2018.2\PerformanceTests\UnityPerformanceBenchmark
-testPlatform Android -buildTarget Android -playergraphicsapi=OpenGLES3 -mtRendering -scriptingbackend=mono
|
|
1
2
3
|
Unity . exe - projectPath
C : \ XRAutomatedTests - 2018.2 \ PerformanceTests \ UnityPerformanceBenchmark
- testPlatform Android - buildTarget Android - playergraphicsapi = OpenGLES3 - mtRendering - scriptingbackend = mono
|
Here we launch Unity on Windows to build for Android with OpenGLES3 graphics API, multithreaded rendering, and mono scripting backend.
在这里,我们在Windows上启动Unity,以使用OpenGLES3图形API,多线程渲染和单色脚本后端为Android构建。
Example: Launch UnityPerformanceBenchmark project from OSX to Build iOS Player
示例:从OSX启动UnityPerformanceBenchmark项目以构建iOS Player
|
1
2
3
4
|
./Unity -projectPath /XRAutomatedTests-2018.2/PerformanceTests/UnityPerformanceBenchmark
-testPlatform iOS -buildTarget iOS -playergraphicsapi=OpenGLES3 -mtRendering -scriptingbackend=mono
-appleDeveloperTeamID=<yourAppleDeveloperTeamID>
-iOSProvisioningProfileID=<yourIosProvisionProfileID>
|
|
1
2
3
4
|
. / Unity - projectPath / XRAutomatedTests - 2018.2 / PerformanceTests / UnityPerformanceBenchmark
- testPlatform iOS - buildTarget iOS - playergraphicsapi = OpenGLES3 - mtRendering - scriptingbackend = mono
- appleDeveloperTeamID = < yourAppleDeveloperTeamID >
- iOSProvisioningProfileID = < yourIosProvisionProfileID >
|
Here we launch Unity on OSX to build for iOS with OpenGLES3 graphics API, multithreaded rendering, and mono scripting backend. We also provide the Apple developer team and provisioning profile information needed to deploy to an iOS device.
在这里,我们在OSX上启动Unity,以使用OpenGLES3图形API,多线程渲染和单色脚本后端为iOS构建。 我们还提供了Apple开发人员团队和调配配置文件信息,以部署到iOS设备。
When we open the UnityPerformanceBenchmark project with Unity from the command line like in the examples above, the command line args will be in memory for the IPrebuildSetup.Setup method to parse and use to build the player with.
当像上面的示例一样从命令行使用Unity打开UnityPerformanceBenchmark项目时,命令行args将在内存中供IPrebuildSetup.Setup方法解析并用于构建播放器。
While this launch-from-command-line approach isn’t required to run tests in the Unity Test Runner, it’s a good pattern to use to avoid using a separate test project for each player configuration.
虽然在Unity Test Runner中运行测试不需要使用这种从命令行启动的方法,但是这是避免在每个播放器配置中使用单独的测试项目的一种好模式。
I’ve detailed the command line options for opening the project, or just running the tests, from the command line on the wiki for the test project: How to Run the Unity Performance Benchmark Tests. To learn more about how we’re parsing the player build settings in the test project, take a look at the RenderPerformancePrebuildStep.cs file in the Scripts directory of the UnityPerformanceBenchmark test project.
我已经从测试项目Wiki上的命令行详细介绍了用于打开项目或仅运行测试的命令行选项: 如何运行Unity Performance Benchmark Tests 。 要了解有关我们如何在测试项目中解析播放器构建设置的更多信息,请查看UnityPerformanceBenchmark测试项目的Scripts目录中的RenderPerformancePrebuildStep.cs文件。
打开测试运行器窗口 (Open the Test Runner Window)
After we open the UnityPerformanceBenchmark, we need to open the Unity Test Runner window in the Unity Editor
打开UnityPerformanceBenchmark之后,我们需要在Unity编辑器中打开Unity Test Runner窗口
in Unity 2018.1, go to Window > Test Runner.
在Unity 2018.1中,转到窗口>测试运行器 。
in Unity 2018.2, go to Window > General > Test Runner.
在Unity 2018.2中,转到窗口>常规>测试运行器 。
The Unity Test Runner window will open and look like the image below.
Unity Test Runner窗口将打开,如下图所示。
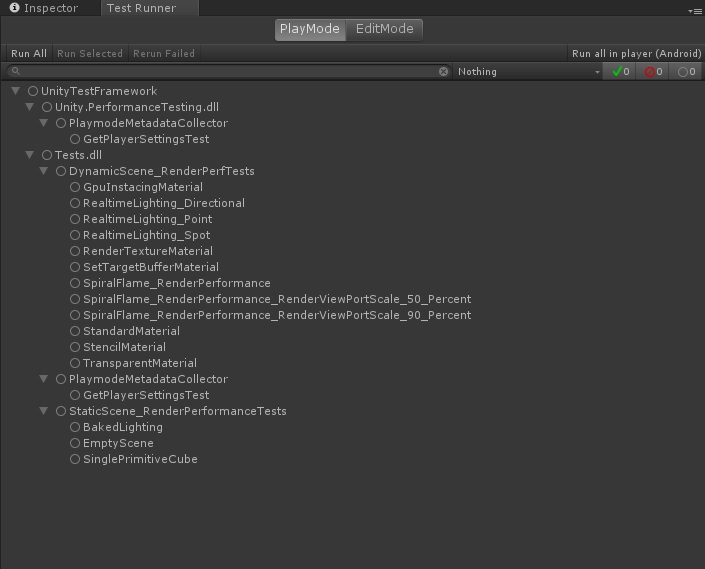
Unity Test Runner with Tests.
Unity Test Runner与测试。
These are our Unity Performance tests. We can run them in the Editor using the Run button at the top left of the window, or on the actual device or platform using the “Run all in player” button at the top right of the window.
这些是我们的Unity Performance测试。 我们可以使用窗口左上方的“运行”按钮在编辑器中运行它们,也可以使用窗口右上方的“在播放器中运行所有”按钮在实际设备或平台上运行它们。
Debugging Tip
调试技巧
If you want to debug code in your IPrebuildSetup.Setup method
如果要调试IPrebuildSetup.Setup方法中的代码
Set breakpoints in your IPrebuildSetup.Setup code in Visual Studio
在Visual Studio中的IPrebuildSetup.Setup代码中设置断点
Attach to the Unity Editor with the Visual Studio Tool for Unity extension
使用Visual Studio Tool for Unity扩展附加到Unity编辑器
Run your tests in the Editor using the “Run All” or “Run Select” button in the Unity Test Runner window.
使用Unity Test Runner窗口中的“全部运行”或“运行选择”按钮在编辑器中运行测试。
At this point the Visual Studio debugger will break into your code where you can debug as needed.
此时,Visual Studio调试器将分解为您的代码,您可以在其中根据需要进行调试。
Unity性能测试示例 (Example Unity Performance Test)
Let’s take a look at a performance test example so we can get a better understanding of how it works.
让我们看一下性能测试示例,以便我们可以更好地了解它的工作方式。
Example: Sampling Profiler Markers in a Unity Performance Test
示例:在Unity性能测试中采样探查器标记
|
1
2
3
4
5
6
7
8
9
10
11
12
13
14
15
16
17
18
19
20
21
22
23
24
25
26
27
28
29
|
[PerformanceUnityTest]
public IEnumerator SpiralFlame_RenderPerformance()
{
yield return SceneManager
.LoadSceneAsync(spiralSceneName, LoadSceneMode.Additive);
SetActiveScene(spiralSceneName);
// Instantiate performance test object in scene
var renderPerformanceTest =
SetupPerfTest<DynamicRenderPerformanceMonoBehaviourTest>();
// allow time to settle before taking measurements
yield return new WaitForSecondsRealtime(SettleTime);
// use ProfilerMarkers API from Performance Test Extension
using (Measure.ProfilerMarkers(SamplerNames))
{
// Set CaptureMetrics flag to TRUE;
// let's start capturing metrics
renderPerformanceTest.component.CaptureMetrics = true;
// Run the MonoBehaviour Test
yield return renderPerformanceTest;
}
yield return SceneManager.UnloadSceneAsync(spiralSceneName);
}
|
|
1
2
3
4
5
6
7
8
9
10
11
12
13
14
15
16
17
18
19
20
21
22
23
24
25
26
27
28
29
|
[ PerformanceUnityTest ]
public IEnumerator SpiralFlame_RenderPerformance ( )
{
yield return SceneManager
. LoadSceneAsync ( spiralSceneName , LoadSceneMode . Additive ) ;
SetActiveScene ( spiralSceneName ) ;
// Instantiate performance test object in scene
var renderPerformanceTest =
SetupPerfTest < DynamicRenderPerformanceMonoBehaviourTest > ( ) ;
// allow time to settle before taking measurements
yield return new WaitForSecondsRealtime ( SettleTime ) ;
// use ProfilerMarkers API from Performance Test Extension
using ( Measure . ProfilerMarkers ( SamplerNames ) )
{
// Set CaptureMetrics flag to TRUE;
// let's start capturing metrics
renderPerformanceTest . component . CaptureMetrics = true ;
// Run the MonoBehaviour Test
yield return renderPerformanceTest ;
}
yield return SceneManager . UnloadSceneAsync ( spiralSceneName ) ;
}
|
In this example, our test method is called SpiralFlame_RenderPerformance. We know from the method decorator [PerformanceUnityTest], that this is a Unity Performance Test.
在此示例中,我们的测试方法称为SpiralFlame_RenderPerformance。 我们从方法装饰器[PerformanceUnityTest]知道这是一个Unity性能测试。
All of the tests in the UnityPerformanceBenchmark test project follow the same pattern we see in this test method:
UnityPerformanceBenchmark测试项目中的所有测试都遵循我们在此测试方法中看到的相同模式:
We also sample custom metrics (metrics that don’t fall into one of Unity profiler markers, framecount, or execution time) in the RenderPerformanceMonoBehaviourTestBase base class (this class inherits from MonoBehaviour).
我们还将在RenderPerformanceMonoBehaviourTestBase基类(该类继承自MonoBehaviour)中对自定义指标(不属于Unity事件探查器标记,帧数或执行时间之一的指标)进行采样。
Example: Sampling Custom Metrics in a Monobehaviour Script
示例:在单行为脚本中对自定义指标进行采样
|
1
2
3
4
5
6
7
8
9
10
11
12
13
14
15
16
17
18
19
|
private void Update()
{
if (CaptureMetrics)
{
FrameCount++;
SampleFps();
#if ENABLE_VR
if (XRSettings.enabled)
{
SampleGpuTimeLastFrame();
}
#endif
}
if (IsMetricsCaptured)
{
EndMetricCapture();
}
}
|
|
1
2
3
4
5
6
7
8
9
10
11
12
13
14
15
16
17
18
19
|
private void Update ( )
{
if ( CaptureMetrics )
{
FrameCount ++ ;
SampleFps ( ) ;
#if ENABLE_VR
if ( XRSettings . enabled )
{
SampleGpuTimeLastFrame ( ) ;
}
#endif
}
if ( IsMetricsCaptured )
{
EndMetricCapture ( ) ;
}
}
|
|
1
2
3
4
5
6
|
private void SampleFps()
{
Fps = GetFps();
Measure.Custom(FpsSg, Fps);
startFrameCount = Time.renderedFrameCount;
}
|
|
1
2
3
4
5
6
|
private void SampleFps ( )
{
Fps = GetFps ( ) ;
Measure . Custom ( FpsSg , Fps ) ;
startFrameCount = Time . renderedFrameCount ;
}
|
|
1
2
3
4
5
|
private void SampleGpuTimeLastFrame()
{
var gpuTimeLastFrame = GetGpuTimeLastFrame();
Measure.Custom(GpuTimeLastFrameSg, gpuTimeLastFrame * 1000);
}
|
|
1
2
3
4
5
|
private void SampleGpuTimeLastFrame ( )
{
var gpuTimeLastFrame = GetGpuTimeLastFrame ( ) ;
Measure . Custom ( GpuTimeLastFrameSg , gpuTimeLastFrame * 1000 ) ;
}
|
|
1
2
3
4
5
6
7
|
public void EndMetricCapture()
{
CaptureMetrics = false;
#if UNITY_ANALYTICS && UNITY_2018_2_OR_NEWER
Measure.Custom(startupTimeSg, appStartupTime);
#endif
}
|
|
1
2
3
4
5
6
7
|
public void EndMetricCapture ( )
{
CaptureMetrics = false ;
#if UNITY_ANALYTICS && UNITY_2018_2_OR_NEWER
Measure . Custom ( startupTimeSg , appStartupTime ) ;
#endif
}
|
In the example above, we’re capturing FPS, GpuTimeLastFrame (if XR is enabled), and application startup time (if Unity Analytics is enabled and we’re running on Unity 2018.2-or- newer where the API we need is available).
在上面的示例中,我们正在捕获FPS,GpuTimeLastFrame(如果启用了XR)和应用程序启动时间(如果启用了Unity Analytics,并且在Unity 2018.2或更高版本上运行,而我们需要的API可用)。
IsTestFinished属性 (IsTestFinished Property)
Finally, notice in the same RenderPerformanceMonoBehaviourTestBase base class that we have implemented a property public bool IsTestFinished.We’re required to implement this property because our RenderPerformanceMonoBehaviourTestBase implements the IMonoBehaviourTest interface.
最后,请注意在我们实现属性public bool IsTestFinished的同一RenderPerformanceMonoBehaviourTestBase基类中,由于我们的RenderPerformanceMonoBehaviourTestBase实现了IMonoBehaviourTest接口,因此需要实现此属性。
This property is important because the Unity Test Runner uses it to know when to stop the test. When it’s value is true, the test ends. It’s up to you to implement the logic you want in order to determine when the Unity Test Runner should stop running the test.
该属性很重要,因为Unity Test Runner使用它来知道何时停止测试。 当其值为true时,测试结束。 由您决定要执行的逻辑,以确定Unity Test Runner应何时停止运行测试。
Example: Sampling Custom Metrics in the IsTestFinished Property
示例:在IsTestFinished属性中采样自定义指标
|
1
2
3
4
5
6
7
8
9
10
11
12
13
14
15
16
17
|
public bool IsTestFinished
{
get
{
bool isTestFinished = false;
if (IsMetricsCaptured)
{
Measure.Custom(objCountSg, RenderedGameObjects);
Measure.Custom(trianglesSg, Tris);
Measure.Custom(verticesSg, Verts);
isTestFinished = true;
}
return isTestFinished;
}
}
|
|
1
2
3
4
5
6
7
8
9
10
11
12
13
14
15
16
17
|
public bool IsTestFinished
{
get
{
bool isTestFinished = false ;
if ( IsMetricsCaptured )
{
Measure . Custom ( objCountSg , RenderedGameObjects ) ;
Measure . Custom ( trianglesSg , Tris ) ;
Measure . Custom ( verticesSg , Verts ) ;
isTestFinished = true ;
}
return isTestFinished ;
}
}
|
In this final example, we’re capturing the number of rendered game objects, triangles, and vertices in the scene when the test finishes.
在最后一个示例中,我们将在测试完成时捕获场景中渲染的游戏对象,三角形和顶点的数量。
SampleGroupDefinition (SampleGroupDefinition)
Now that we’ve seen some examples of how we make calls into the Performance Testing Extension to sample metrics, let’s talk about how we configure these to begin with.
现在,我们已经看到了一些有关如何调用Performance Testing Extension来采样指标的示例,让我们来谈谈如何配置这些指标。
The Measure.* methods generally take a struct as a parameter called a SampleGroupDefinition. When we create a new SampleGroupDefinition we define some properties for the samples we are interested in collecting.
Measure。*方法通常将一个结构作为名为SampleGroupDefinition的参数。 创建新的SampleGroupDefinition时,我们为有兴趣收集的样本定义了一些属性。
Example: Define new SampleGroupDefinition for GpuTimeLastFrame, using Milliseconds as the sample unit, aggregate samples using a minimum value
示例:使用毫秒作为样本单位,为GpuTimeLastFrame定义新的SampleGroupDefinition,使用最小值汇总样本
Below is the SampleGroupDefinition for GpuTimeLastFrame. This is how we let the Performance Testing Extension know how to collect samples and aggregate them for GpuTimeLastFrame.
以下是GpuTimeLastFrame的SampleGroupDefinition。 这就是我们让Performance Testing Extension知道如何收集样本并将其汇总到GpuTimeLastFrame的方式。
This SampleGroupDefinition is from the dynamic scene render performance test example, so here we’ve chosen to aggregate our samples using the minimum value collected. But why would we do that rather than use a more common aggregation measure, like median or average?
该SampleGroupDefinition来自动态场景渲染性能测试示例,因此在这里,我们选择了使用收集的最小值来聚合样本。 但是,为什么我们要这样做而不是使用更常见的汇总度量(例如中位数或平均值)呢?
The answer is because the scene is dynamic. In a dynamic scene using a median or average aggregation would be unreliable or inconsistent for the same scene run against the same code given the changing nature of the rendering. This is most likely the best we can do if we want to track a single aggregate for a rendering metric in a dynamic scene. However, when we define a similar SampleGroupDefinition for our static scenes, we definitely use a median aggregation.
答案是因为场景是动态的。 在动态场景中,鉴于渲染性质的变化,对于相同场景针对相同代码运行,使用中值或平均聚合将是不可靠或不一致的。 如果我们想为动态场景中的渲染指标跟踪单个聚合,这很可能是我们可以做的最好的事情。 但是,当我们为静态场景定义类似的SampleGroupDefinition时,我们肯定会使用中值聚合。
|
1 |
new SampleGroupDefinition(GpuTimeLastFrameName, SampleUnit.Millisecond, AggregationType.Min)
|
|
1 |
new SampleGroupDefinition ( GpuTimeLastFrameName , SampleUnit . Millisecond , AggregationType . Min )
|
Example: Define new SampleGroupDefinition for FPS, using none as the sample unit, aggregate samples using a median value, an increase in the value is better
示例:为FPS定义新的SampleGroupDefinition,不使用任何采样单位,使用中值聚合样本,值的增加更好
Below is the SampleGroupDefinition for FPS (Frames Per Second). FPS doesn’t have a separate measurement unit; it’s just FPS, so we specify SampleUnit.None here. We’ll using a median aggregation type here; this is in a static scene so we don’t have to worry about an unpredictable rendering experience. We’re explicitly establishing a 15% threshold for the sample group, and passing true for the increaseIsBetter argument because, if FPS increases, it’s a good thing!
以下是FPS(每秒帧数)的SampleGroupDefinition。 FPS没有单独的测量单位; 这只是FPS,因此我们在此处指定SampleUnit.None。 我们将在此处使用中位数聚合类型; 这是在静态场景中,因此我们不必担心无法预测的渲染体验。 我们正在为样本组明确设置一个15%的阈值,并为crementIsBetter参数传递true,因为,如果FPS增加,那是一件好事!
These last two arguments are collected and saved in our performance test results .xml file when running from the command line, and can be later used in the Unity Performance Benchmark Reporter to establish benchmarks.
从命令行运行时,将收集最后两个自变量并将其保存在我们的性能测试结果.xml文件中,以后可在Unity Performance Benchmark Reporter中用于建立基准。
|
1 |
new SampleGroupDefinition(FpsName, SampleUnit.None, AggregationType.Median, threshold: 0.15, increaseIsBetter: true)
|
|
1 |
new SampleGroupDefinition ( FpsName , SampleUnit . None , AggregationType . Median , threshold : 0.15 , increaseIsBetter : true )
|
When the test completes, all of the metric samples we enabled earlier are then aggregated by the Performance Testing Extension.
测试完成后,性能测试扩展将汇总我们之前启用的所有度量标准样本。
测量类型 (Measurement Types)
I want to point out that in our code examples we use a couple of different Unity Performance Testing Extension APIs, namely
我想指出的是,在我们的代码示例中,我们使用了两个不同的Unity Performance Testing Extension API,即
The Unity Performance Testing Extension provides other Measure methods as well that may suit your specific needs depending on what, and how, you’re wanting to measure performance in Unity. These additional methods include:
Unity Performance Testing Extension还提供了其他评估方法,这些方法可能适合您的特定需求,具体取决于您要在Unity中评估性能的方式和方式。 这些其他方法包括:
Learn more about the different Measure methods in the Unity Performance Testing Extension documentation, specifically in the “Taking measurements” section.
在Unity Performance Testing Extension文档中 ,特别是在“进行度量”部分中,了解有关不同度量方法的更多信息。
在Unity Test Runner中运行性能测试 (Running Performance Tests in Unity Test Runner)
Now that we’ve looked at some examples of how we write performance tests using the Unity Test Runner using the Unity Performance Testing Extension, let’s look at how we run them.
现在,我们已经看了一些如何使用Unity Performance Test Extension来使用Unity Test Runner编写性能测试的示例,让我们看一下如何运行它们。
There are two primary ways we can execute our performance tests
我们可以通过两种主要方法来执行性能测试
From the command line, launching Unity with the -runTests option. This is the preferred way for performance tests because the Unity Performance Test Extension will generate a result .xml file for us that we can use in the Unity Performance Benchmark Reporter to view and compare our results.
在命令行中,使用-runTests选项启动Unity。 这是性能测试的首选方法,因为Unity Performance Test Extension将为我们生成一个结果.xml文件,我们可以在Unity Performance Benchmark Reporter中使用它来查看和比较结果。
Directly from within the Editor. This is a useful approach if you
直接在编辑器中。 如果您选择
a. Just want to run the tests and view the results in the Unity Test Runner window without needing to capture the results for later use, or
一个。 只想运行测试并在Unity Test Runner窗口中查看结果,而无需捕获结果以备后用,或者
b. Want to verify your tests will run or you need to debug into test code.
b。 要验证您的测试将运行,或者您需要调试成测试代码。
使用-runTests命令行选项运行性能测试 (Running Performance Tests with the -runTests Command Line Option)
Here are two examples of how to run performance tests with Unity Test Runner from the command line. These examples should look very familiar, because we’re building off the same examples we saw earlier in our discussion about opening the UnityPerformanceBenchmark project from the command line.
以下是两个如何从命令行使用Unity Test Runner运行性能测试的示例。 这些示例应该看起来非常熟悉,因为我们正在构建与前面讨论的有关从命令行打开UnityPerformanceBenchmark项目的示例相同的示例。
Example: Running the UnityPerformanceBenchmark Performance Tests from Windows against an Android Player
示例:从Windows对Android Player运行UnityPerformanceBenchmark性能测试
Here we launch Unity on Windows to build for Android with OpenGLES3 graphics API, multithreaded rendering, and mono scripting backend.
在这里,我们在Windows上启动Unity,以使用OpenGLES3图形API,多线程渲染和单色脚本后端为Android构建。
|
1
2
3
4
|
Unity.exe -runTests [-batchmode] -projectPath
C:\XRAutomatedTests-2018.2\PerformanceTests\UnityPerformanceBenchmark -testPlatform Android -buildTarget Android -playergraphicsapi=OpenGLES3 -mtRendering -scriptingbackend=mono -testResults
C:\PerfTests\results\PerfBenchmark_Android_OpenGLES3_MtRendering_Mono.xml -logfile
C:\PerfTests\logs\PerfBenchmark_Android_OpenGLES3_MtRendering_Mono_UnityLog.txt
|
|
1
2
3
4
|
Unity . exe - runTests [ - batchmode ] - projectPath
C : \ XRAutomatedTests - 2018.2 \ PerformanceTests \ UnityPerformanceBenchmark - testPlatform Android - buildTarget Android - playergraphicsapi = OpenGLES3 - mtRendering - scriptingbackend = mono - testResults
C : \ PerfTests \ results \ PerfBenchmark_Android_OpenGLES3_MtRendering_Mono . xml - logfile
C : \ PerfTests \ logs \ PerfBenchmark_Android_OpenGLES3_MtRendering_Mono_UnityLog . txt
|
Example: Running UnityPerformanceBenchmark Performance tests from OSX against an iOS Player
示例:针对iOS播放器从OSX运行UnityPerformanceBenchmark性能测试
Here we launch Unity on OSX to build for iOS with OpenGLES3 graphics API, multithreaded rendering, and mono scripting backend. We also provide the Apple developer team and provisioning profile information needed to deploy to an iOS device.
在这里,我们在OSX上启动Unity,以使用OpenGLES3图形API,多线程渲染和单色脚本后端为iOS构建。 我们还提供了Apple开发人员团队和调配配置文件信息,以部署到iOS设备。
|
1
2
3
4
5
6
|
./Unity -runTests [-batchmode] -projectPath /XRAutomatedTests-2018.2/PerformanceTests/UnityPerformanceBenchmark
-testPlatform iOS -buildTarget iOS -playergraphicsapi=OpenGLES3
-mtRendering -scriptingbackend=mono
-appleDeveloperTeamID=<yourAppleDeveloperTeamID>
-iOSProvisioningProfileID=<yourIosProvisionProfileID> -testResults /PerfTests/results/PerfBenchmark_Android_OpenGLES3_MtRendering_Mono.xml
-logfile /PerfTests/logs/PerfBenchmark_Android_OpenGLES3_MtRendering_Mono_UnityLog.txt
|
|
1
2
3
4
5
6
|
. / Unity - runTests [ - batchmode ] - projectPath / XRAutomatedTests - 2018.2 / PerformanceTests / UnityPerformanceBenchmark
- testPlatform iOS - buildTarget iOS - playergraphicsapi = OpenGLES3
- mtRendering - scriptingbackend = mono
- appleDeveloperTeamID = < yourAppleDeveloperTeamID >
- iOSProvisioningProfileID = < yourIosProvisionProfileID > - testResults / PerfTests / results / PerfBenchmark_Android_OpenGLES3_MtRendering_Mono . xml
- logfile / PerfTests / logs / PerfBenchmark_Android_OpenGLES3_MtRendering_Mono_UnityLog . txt
|
For both of these examples, we’ve introduced three to four new command line options that will help us run our tests instead of just opening the Unity Editor with the command line arguments available to the IPrebuildSetup.Setup method.
对于这两个示例,我们都引入了三到四个新的命令行选项,这些选项将帮助我们运行测试,而不仅仅是使用IPrebuildSetup.Setup方法可用的命令行参数打开Unity Editor。
-runTests This option tells the Unity Test Runner that you want to run your tests
-runTests此选项告诉Unity Test Runner您要运行测试
-testResults <pathToWritePerformanceTestResultsFile> This option specifies the filename and path to the .xml file that the Unity Test Runner should save your performance tests results in.
-testResults <pathToWritePerformanceTestResultsFile>此选项指定Unity Test Runner应将性能测试结果保存到的.xml文件的文件名和路径。
-logfile <pathToWriteUnityEditorLogFile> This option specifies the filename and path to the file that the Unity Editor should write its logging to. This is optional, but can be really helpful when you’re investigating failures and issues if you can quickly access the Unity Editor log file.
-logfile <pathToWriteUnityEditorLogFile>此选项指定Unity编辑器应将其日志记录写入的文件名和文件路径。 这是可选的,但是如果您可以快速访问Unity Editor日志文件,那么在调查故障和问题时将非常有用。
-batchmode This option will force the Unity Editor to open in a headless mode. We use this option when we are only running player performance tests and there is no need to actually open the Unity Editor window. This can save time during automated tests execution. When this option is not used, the Unity Editor will open on the screen before executing the tests.
-batchmode此选项将强制Unity编辑器以无头模式打开。 当我们仅运行播放器性能测试并且不需要实际打开Unity Editor窗口时,可以使用此选项。 这样可以节省自动执行测试的时间。 不使用此选项时,将在执行测试之前在屏幕上打开Unity Editor。
At Unity we run our performance tests from the command line, often in batchmode, in our continuous integration system.
在Unity,我们在连续集成系统中通常以批处理模式从命令行运行性能测试。
Example: Running the UnityPerformanceBenchmark Tests from the Command Line
示例:从命令行运行UnityPerformanceBenchmark测试
在Unity编辑器中运行性能测试 (Running Performance Tests in the Unity Editor)
With the Unity Test Runner window open near the top when PlayMode is selected (PlayMode tests run in either the build player or in the playmode window of the Editor), we have
当选择PlayMode时,Unity Test Runner窗口在顶部附近打开(PlayMode测试在构建播放器或在Editor的playmode窗口中运行),
| Important Requirement |
Running performance tests prior to version 0.1.50 of the Performance Testing Extension in the Unity Editor from the Test Runner window will not produce a result .xml file needed for the Unity Performance Benchmark Reporter. However, if you’re using version 0.1.50 or later of the Performance Testing Extension, a results.xml file will be written to the Assets\StreamingAssets project folder. If you are using a version of the Performance Testing Extension earlier than version 0.1.50 and want to create a result .xml file when you’ve done your performance tests, you need to run the tests by launching Unity from the command line with the -runTests command line option. Be aware however, that when you’re running Unity with the -runTests command line option, the Editor will open and begin running the tests. The result .xml files will contain the results and metadata from the test runs that we’ll use with the Unity Performance Benchmark Reporter to create benchmark results and compare to subsequent test runs. |
| 重要要求 |
从“测试运行器”窗口在Unity编辑器中运行性能测试扩展版本0.1.50之前的性能测试不会产生Unity Performance Benchmark Reporter所需的结果.xml文件。 但是,如果您使用的是Performance Testing Extension的0.1.50或更高版本,则result.xml文件将被写入Assets\StreamingAssets项目文件夹。 如果您使用的性能测试扩展版本早于版本0.1.50,并且想要在完成性能测试后创建结果.xml文件,则需要通过使用以下命令从命令行启动Unity来运行测试: -runTests命令行选项。 但是请注意,当使用-runTests命令行选项运行Unity时,编辑器将打开并开始运行测试。 结果.xml文件将包含测试运行的结果和元数据,我们将它们与Unity Performance Benchmark Reporter一起使用以创建基准测试结果并与后续测试运行进行比较。 |
Example: Running Performance Tests in the Unity Editor
示例:在Unity编辑器中运行性能测试
查看性能测试结果 (Viewing Performance Test Results)
If we’re running these tests from within the editor, the aggregate values can be seen near the bottom of the Unity Test Runner window by selecting each test.
如果我们在编辑器中运行这些测试,则通过选择每个测试,可以在Unity Test Runner窗口底部附近看到汇总值。
Example: Viewing Performance Test Sample Aggregations from Unity Test Runner
示例:从Unity Test Runner查看性能测试样本聚合
If you want to see the results of running your Unity Performance Tests from the command line, you’ll need to use the Unity Performance Benchmark Reporter (or just open the result .xml file, but it’s not an easy read).
如果要从命令行查看运行Unity Performance Tests的结果,则需要使用Unity Performance Benchmark Reporter(或仅打开结果.xml文件,但这并不容易阅读)。
With that, let’s transition to talking about how we can use the Unity Performance Benchmark Reporter to view and compare results.
到此为止,让我们过渡到谈论如何使用Unity Performance Benchmark Reporter来查看和比较结果。
使用Unity Performance Benchmark Reporter (Using Unity Performance Benchmark Reporter)
Unity Performance Benchmark Reporter enables the comparison of performance metric baselines and subsequent performance metrics (as generated using the Unity Test Runner with the Unity Performance Testing Extension) in an html report with graphical visualizations.
利用Unity Performance Benchmark Reporter,可以在具有图形可视化效果的html报告中比较性能指标基准和后续性能指标(使用Unity Test Runner和Unity Performance Testing Extension生成 )。
The reporter is built as a .NET Core 2.x assembly so that it is compatible to run across different .NET supported platforms (Windows, OSX, etc). Therefore, to run it, you’ll need to ensure you have installed the .NET Core SDK.
该报告程序被构建为.NET Core 2.x程序集,因此可兼容在不同.NET支持的平台(Windows,OSX等)上运行。 因此,要运行它,您需要确保已安装.NET Core SDK 。
Executing the Unity Performance Benchmark reporter entails invoking the assembly with the dotnet command like this:
执行Unity Performance Benchmark报告程序需要使用dotnet命令调用程序集,如下所示:
|
1
2
3
|
dotnet UnityPerformanceBenchmarkReporter.dll
--baseline=D:\UnityPerf\baseline.xml
--results=D:\UnityPerf\results --reportdirpath=d:\UnityPerf
|
|
1
2
3
|
dotnet UnityPerformanceBenchmarkReporter . dll
-- baseline = D : \ UnityPerf \ baseline . xml
-- results = D : \ UnityPerf \ results -- reportdirpath = d : \ UnityPerf
|
After the reporter runs, a directory named UnityPerformanceBenchmark will be created with an html report and supporting .css, .js, and image files in it. Open the html report to view visualizations of the performance metrics captures in the .xml result files.
报告程序运行后,将创建一个名为UnityPerformanceBenchmark的目录,其中包含一个html报告并在其中支持.css,.js和图像文件。 打开html报告以查看.xml结果文件中捕获的性能指标的可视化。
命令行选项 (Command Line Options)
–results The path to a directory where we have one or more non-baseline result .xml files to be included in the html report.
–results html报告中包含一个或多个非基准结果.xml文件的目录的路径。
At least one –results value must be passed to the UnityPerformanceBenchmarkReporter.dll assembly. This is the only required field.
必须将至少一个-results值传递给UnityPerformanceBenchmarkReporter.dll程序集。 这是唯一必填字段。
This command line option also can be used to specify the path to a single .xml non-baseline result file. Additionally, you can specify several directories or files by repeating the option like this:
此命令行选项也可以用于指定单个.xml非基准结果文件的路径。 另外,您可以通过重复如下所示的选项来指定多个目录或文件:
|
1 |
--results=D:\UnityPerf\results --results=D:\UnityPerf\results.xml
|
|
1 |
-- results = D : \ UnityPerf \ results -- results = D : \ UnityPerf \ results . xml
|
–baseline The path to a result .xml file that will be used when comparing other results.
–baseline比较其他结果时将使用的结果.xml文件的路径。
–reportdirpath The path to a directory where the reporter will create the performance benchmark report. This is created in a UnityPerformanceBenchmark subdirectory.
–reportdirpath报告程序将在其中创建性能基准报告的目录的路径。 这是在UnityPerformanceBenchmark子目录中创建的。
If the report location is not specified, the UnityPerformanceBenchmark subdirectory will be created in the working directory that the UnityPerformanceBenchmarkReporter.dll was invoked.
如果未指定报告位置,则将在调用UnityPerformanceBenchmarkReporter.dll的工作目录中创建UnityPerformanceBenchmark子目录。
比较性能测试结果 (Comparing Performance Test Results)
Let’s compare some performance test results with the Performance Benchmark Reporter.
让我们将一些性能测试结果与Performance Benchmark Reporter进行比较。
Example: Experiment with Configuration Changes in a VR-enabled Gear VR Scene to Improve Frame Rate
示例:在启用VR的Gear VR场景中试验配置更改以提高帧速率
I have a Unity scene with the following complexity characteristics.
我有一个具有以下复杂性特征的Unity场景。

Our Gear VR Scene
我们的Gear VR场景
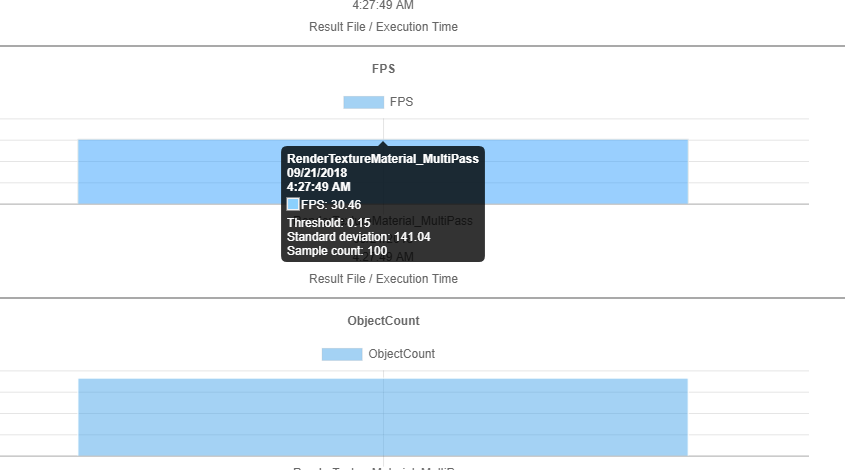
I ran a Unity Performance Test against this scene sampling metrics that would help me understand if I could sustain close to 60 FPS using Multi Pass Stereo Rendering. Next, I ran the Performance Benchmark Reporter with the results of my test.
我针对该场景采样指标运行了Unity性能测试,这将有助于我了解是否可以使用多通道立体声渲染来维持接近60 FPS的速度。 接下来,我用测试结果运行了Performance Benchmark Reporter。
What I found is that my FPS is closer to 30 FPS, half of what I’d like to be at.
我发现我的FPS接近30 FPS,仅为我想要的一半。
Next, I’m going to try using Single Pass Multiview Stereo Rendering to see how close to 60 FPS I can get. I’ll rerun my Performance Test with the configuration change, then create another Unity Performance Benchmark Report comparing my first results with the new ones.
接下来,我将尝试使用单通道多视图立体渲染,以了解我可以获得接近60 FPS的速度。 我将通过配置更改重新运行性能测试,然后创建另一个Unity性能基准报告,将我的第一个结果与新结果进行比较。
Results of Switching from Multi Pass to Single Pass Multiview Stereo Rendering.
从多通道切换到单通道多视图立体渲染的结果。
Looks like the configuration switch to Single Pass Multiview rendering improved our FPS to 37. We still need to be closer to 60 FPS if we want this scene to run without significant frame drop on Gear VR.
看起来,将配置切换为“单遍多视图”渲染可以将我们的FPS提升到37。如果我们希望该场景在Gear VR上运行而不会出现明显的帧丢失,那么我们仍然需要接近60 FPS。
The last thing I’m going to experiment with is reducing the number of rotating cubes in my scene to see if we can get FPS up.
我要试验的最后一件事是减少场景中旋转立方体的数量,以查看是否可以提高FPS。
After a couple of tries I’m able to improve performance to ~55 FPS. But I had to reduce the number of object in the scene from 732 to 31. That’s quite a bit.
经过几次尝试,我可以将性能提高到约55 FPS。 但是我不得不将场景中的对象数量从732减少到31。这相当多。
I’ll circle back on other improvements I can make for performance optimization, but for now, I’m going to use this as an FPS baseline. I’ll use this as my benchmark going forward, hoping to improve it if I can.
我将回头介绍我可以进行性能优化的其他改进,但是现在,我将使用它作为FPS基准。 我将以此为基准进行测试,并希望在可能的情况下进行改进。
Achieving a more acceptable FPS for the VR Scene.
为VR场景实现更可接受的FPS。
建立基准并跟踪绩效变化 (Establishing Benchmarks and Tracking Performance Changes)
Establishing benchmarks can mean many things depending on your project. In this context, running performance tests in Unity, we’re talking about establishing a baseline set of results, a last-known-good set of performance metrics that we can compare subsequent results to as we make changes. These become our benchmark.
建立基准可能意味着许多事情,具体取决于您的项目。 在这种情况下,在Unity中运行性能测试时,我们所谈论的是建立一组基准结果,即一组最近已知的良好性能指标,我们可以在进行更改时将后续结果进行比较。 这些成为我们的基准。
In the previous section I arrived at a configuration using Single Pass Multiview Stereo Rendering for Gear VR, and a decreased scene object count, that resulted in an “acceptable” FPS. At that point, I decide to use my test results as my benchmark. Let’s see an example of how we can use this benchmark as we make further changes to the player configuration.
在上一节中,我得出了一个针对Gear VR使用单次通过多视图立体声渲染的配置,并减少了场景对象数量,这导致了“可接受的” FPS。 那时,我决定将测试结果用作基准。 让我们看一个示例,说明在进一步更改播放器配置时如何使用此基准。
Example: Use Performance Benchmark to Detect Performance Regression with Configuration Changes
示例:使用性能基准来检测配置变化带来的性能下降
I’d like to enable antialiasing in my scene to smooth the appearance out. The default Quality Settings in Unity for Android disable antialiasing, but I’d like to see if we can enable it and still maintain an acceptable FPS for our Gear VR scene.
我想在场景中启用抗锯齿功能以使外观平滑。 Unity for Android中的默认“质量设置”禁用了抗锯齿功能,但是我想看看我们是否可以启用它,并仍然为Gear VR场景保持可接受的FPS。
First I set the antialiasing value in my IPrebuildSetup.Setup method to 4.
首先,我将IPrebuildSetup.Setup方法中的抗锯齿值设置为4。
|
1 |
QualitySettings.antiAliasing = 4;
|
|
1 |
QualitySettings . antiAliasing = 4 ;
|
Next I rerun the performance test from earlier on my Gear VR-enabled Android phone. I then use the Unity Performance Benchmark Reporter to compare this new run with my newly-established benchmark results.
接下来,我将在支持Gear VR的Android手机上重新运行性能测试。 然后,我使用Unity Performance Benchmark Reporter将此新运行与我新建立的基准测试结果进行比较。
Detecting Regression in FPS After Reconfiguring to use Antialiasing at 4.
重新配置为在4使用抗锯齿后,在FPS中检测回归。
But look, with the reconfiguration of my Unity player to use antialiasing at level 4, my FPS dropped to 32 FPS, which is about where I originally started out when I created this scene with 732 objects.
但是请注意,通过将Unity播放器重新配置为在4级使用抗锯齿功能,我的FPS下降到32 FPS,这与我最初创建包含732个对象的场景时的开始位置有关。
I’d like to experiment with a few lower antialiasing values to see if I can recover an acceptable FPS for the scene before I bail on this idea. So, I try with antialiasing set to 2, and then finally 1. The results are in the image below.
我想尝试使用一些较低的抗锯齿值,以了解在为这个想法保释之前是否可以为场景恢复可接受的FPS。 因此,我尝试将抗锯齿设置为2,最后设置为1。结果在下图中。
Experimenting with Decreasing Antialiasing Values To Recover Acceptable FPS For The Scene.
尝试减小抗锯齿值以恢复场景的可接受FPS。
In this reconfiguration scenario, using the performance benchmark I established earlier, I was able to experiment with changes in my Unity player settings and then verify the performance impacts before committing to them.
在这种重新配置方案中,使用我之前建立的性能基准,我能够试验Unity播放器设置中的更改,然后在对性能影响进行确认之前将其更改。
Even though I’m within my default 15% threshold of variance for FPS using antialiasing set to 1, FPS is now at 49, a bit too far from the 60 FPS for my VR-enabled scene that I’d like to be at. I don’t think I’ll commit to these changes today.
即使我在将抗锯齿设置为1的情况下,处于FPS的默认15%方差阈值之内,现在FPS仍为49,与我想要的启用VR的场景的60 FPS有点太远了。 我认为我今天不会致力于这些更改。
结论 (Conclusion)
Unity is putting a lot of focus on great performance by default. But the Unity Engine is only part of what ultimately results in users loving to play your games, enjoying a smooth and high performance experience across all the platforms they may play on. And SDKs, drivers, or Unity packages, for example, that work great without introducing performance regressions are critical to an overall great Performance experience for everyone.
默认情况下, Unity专注于出色的性能 。 但是,Unity Engine只是最终导致用户喜欢玩您的游戏,在他们可能使用的所有平台上享受流畅和高性能体验的部分内容。 例如,SDK,驱动程序或Unity程序包在不引入性能下降的情况下就可以很好地工作,这对于每个人都具有出色的整体性能体验至关重要。
I’ve introduced you to a couple of Unity tools that make it easier to start collecting performance metrics and creating benchmarks with them: the Unity Performance Testing Extension, and the Unity Performance Benchmark Reporter. I encourage you to experiment with what they can do for you and your performance-focused efforts.
我为您介绍了两个Unity工具:Unity Performance Testing Extension和Unity Performance Benchmark Reporter,这些工具使您可以更轻松地开始收集性能指标并使用它们创建基准。 我鼓励您尝试他们可以为您做的事情以及您对绩效的关注。
We looked at
我们看着
Establishing baselines for these metrics, and using them to create a benchmark for your scenes, game, SDK, driver, package, or other Unity integrations can be an effective way to start creating visibility into impacts your changes have. Good luck!
为这些指标建立基准,并使用它们为您的场景,游戏,SDK,驱动程序,程序包或其他Unity集成创建基准,可以是一种有效地开始查看更改影响的有效方法。 祝好运!
Many thanks and credit go to my Unity colleagues for their help contributing, brainstorming, experimenting, developing, and iterating on this work with me.
非常感谢我的Unity同事,感谢他们为我的这项工作做出的贡献,集思广益,试验,发展和迭代。
翻译自: https://blogs.unity3d.com/2018/09/25/performance-benchmarking-in-unity-how-to-get-started/
怎么在unity中测试游戏


 1027
1027

 被折叠的 条评论
为什么被折叠?
被折叠的 条评论
为什么被折叠?
 到【灌水乐园】发言


