


1. 安装
library(devtools)
devtools::install_github("Moonerss/CIBERSORT")
library(CIBERSORT)
library(ggplot2)
library(dplyr)
library(ggthemes)
library(pheatmap)
library(tibble)
library(tidyr)
library(ggpubr)
library(ggsci)
library(ggthemes)
2. 数据准备
需要两个数据:LM22和你需要分析的表达矩阵,我的是bulkRNA的表达矩阵,tpm标准化后的
#读取LM22文件(免疫细胞特征基因文件)
sig_matrix <- system.file("extdata", "LM22.txt", package = "CIBERSORT")
#表达矩阵文件
exp <- read.table(file="tpm_exp.txt",row.names = 1)
3. 运行
res <- cibersort(sig_matrix, tpm_exp, perm = 1000, QN = F)
#QN如果是芯片设置为T,如果是测序就设置为F
write.table(res, "res.txt",
            sep = "\t", row.names = T, col.names = T, quote = F)
4. 可视化
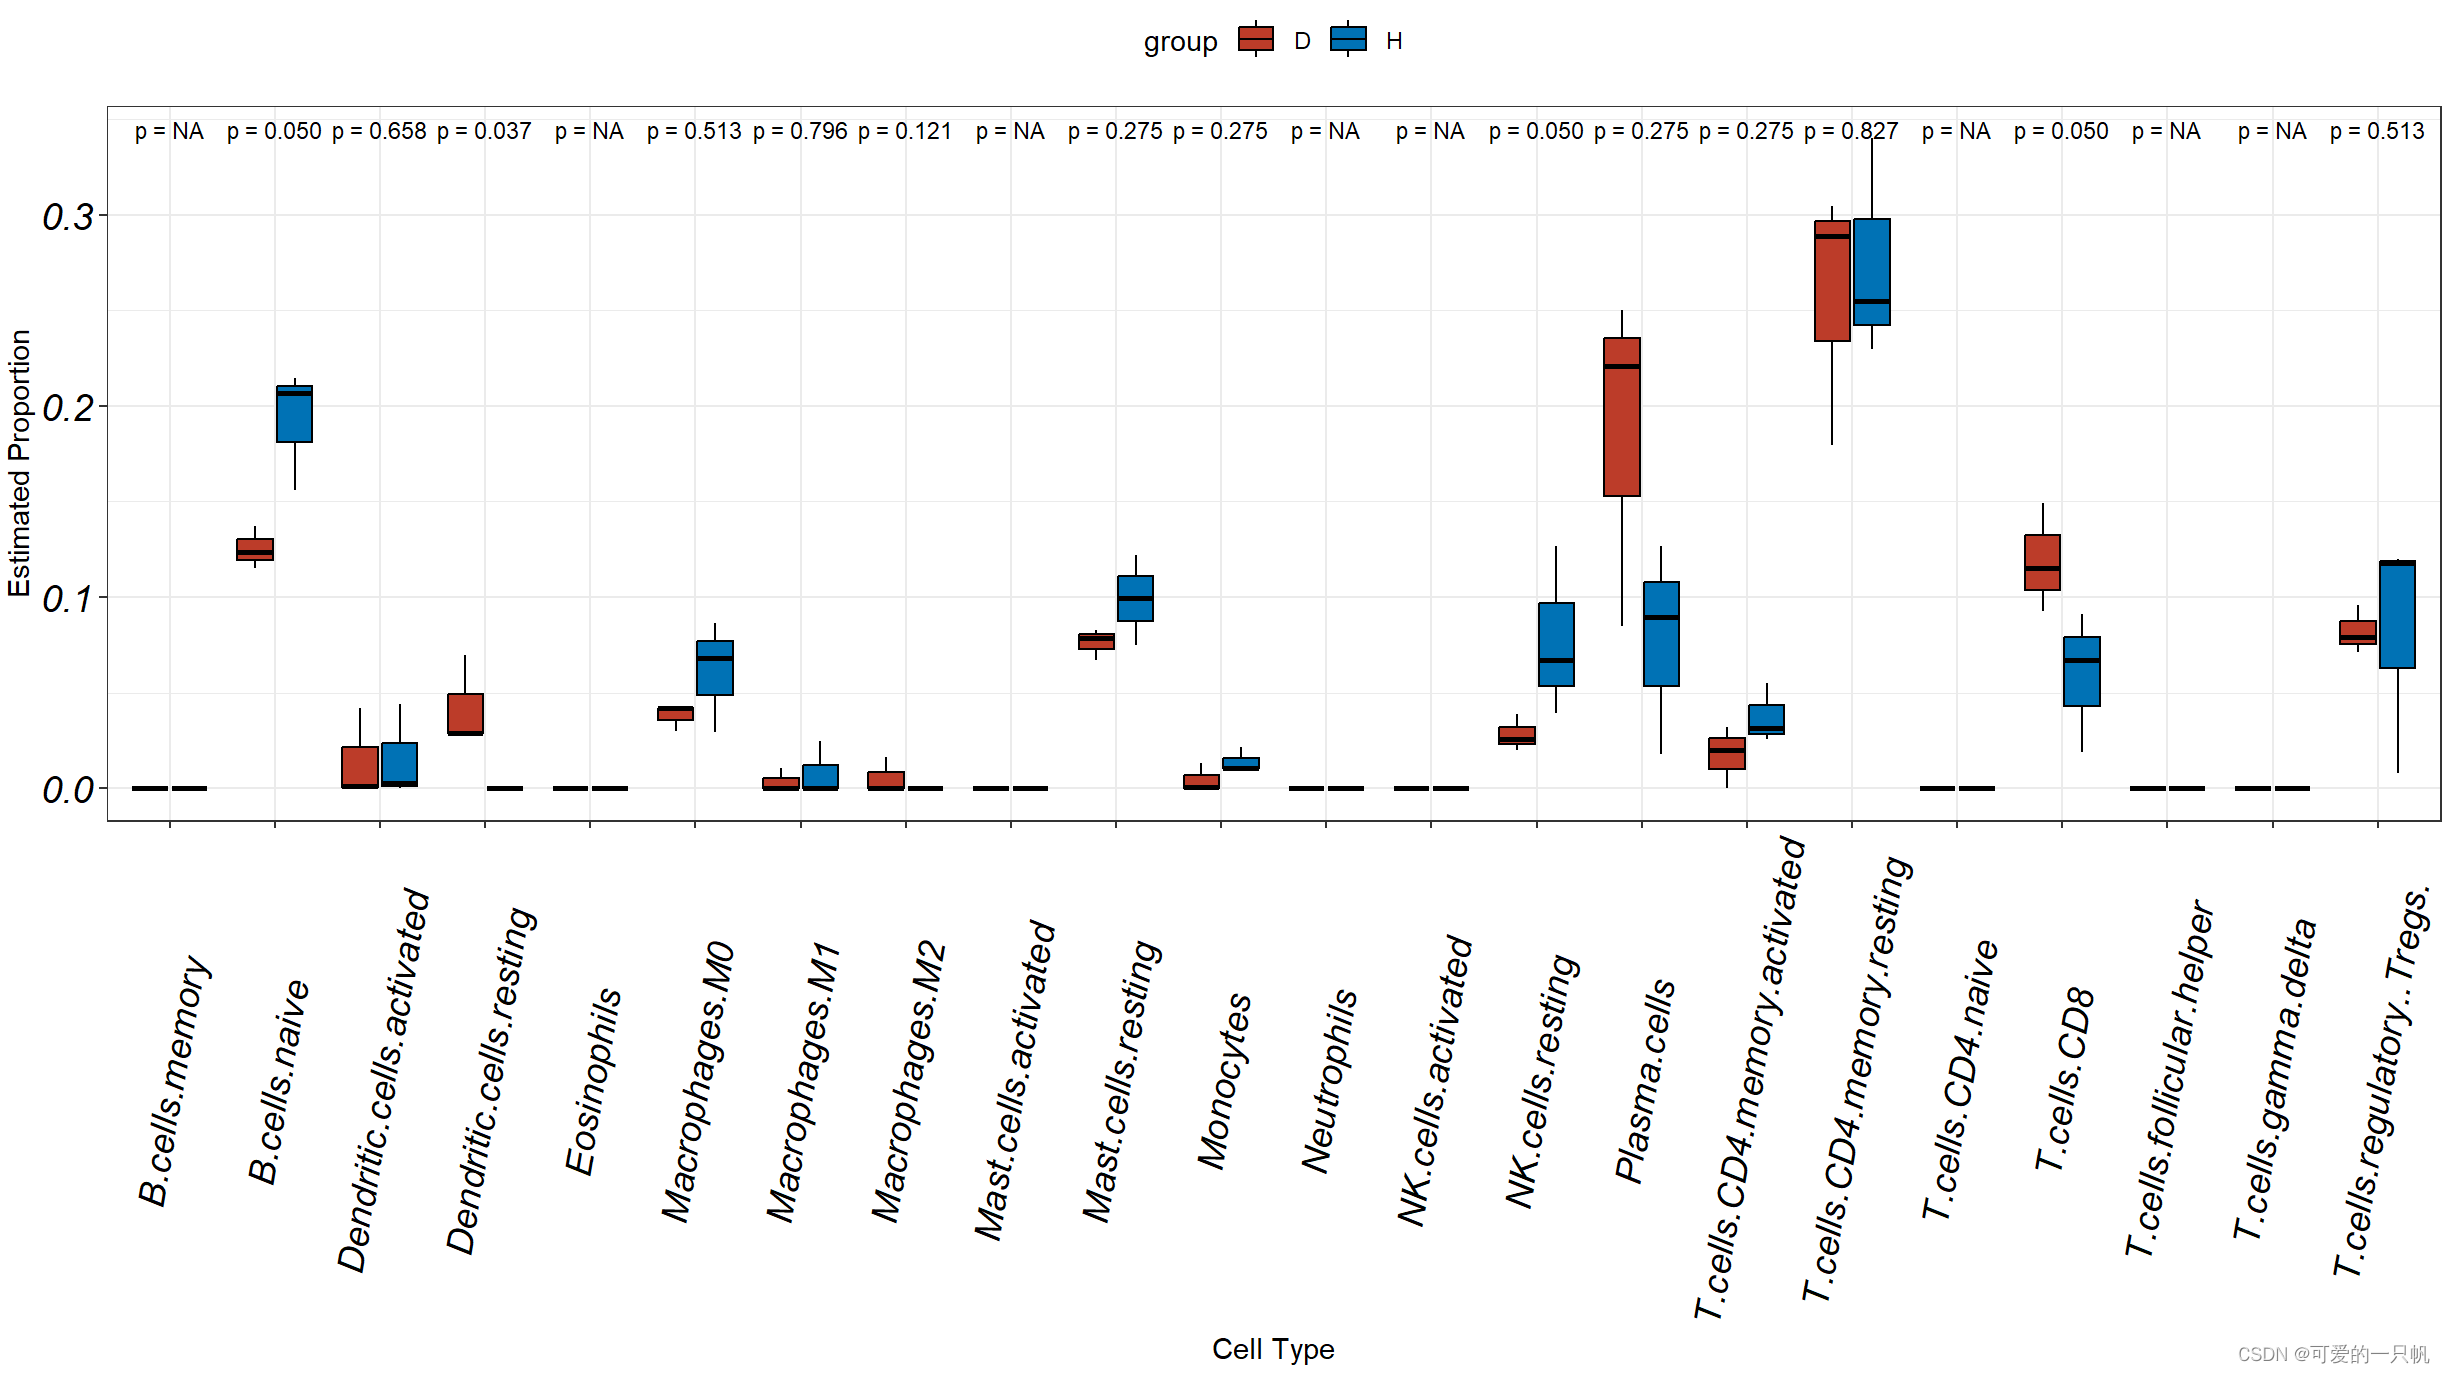
#1.H和D组箱线图
res1 <- data.frame(res[,1:22])%>%
  mutate(group = c(rep('H',3),rep('D',3)))%>%
  rownames_to_column("sample")%>%
  pivot_longer(cols = colnames(.)[2:23],
               names_to = "cell.type",
               values_to = 'value')

ggplot(res1,aes(cell.type,value,fill = group)) +
  geom_boxplot(outlier.shape = 21,color = "black") +
  theme_bw() +
  labs(x = "Cell Type", y = "Estimated Proportion") +
  theme(legend.position = "top") +
  theme(axis.text.x = element_text(angle=80,vjust = 0.5,size = 14,face = "italic",colour = 'black'),
        axis.text.y = element_text(face = "italic",size = 14,colour = 'black'))+
  scale_fill_nejm()+
  stat_compare_means(aes(group = group),label = "p.format",size=3,method = "kruskal.test")
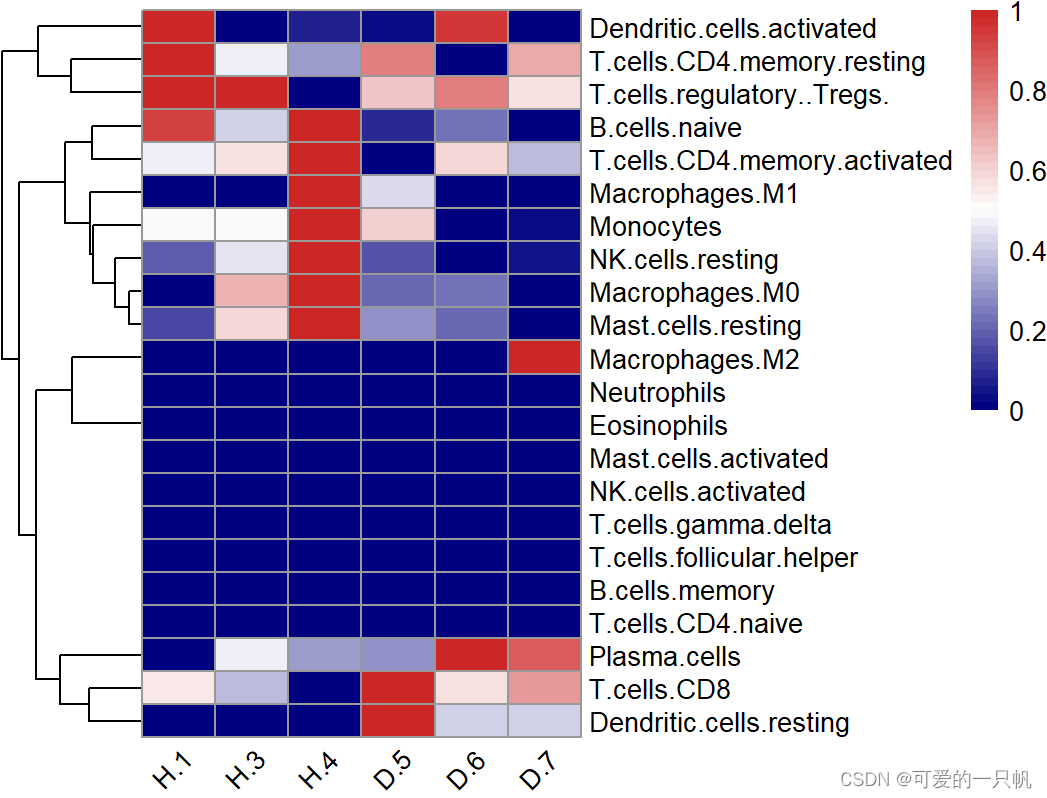
#2.热图
#展示所有的免疫细胞
normalize <- function(x) {
  if((max(x) - min(x)) == 0){
    return(mean(x))
  }else{
    return((x - min(x)) / (max(x) - min(x)))
  }
}
res1 <- res[,-(23:25)]
res2 <- apply(res1, 2,normalize)
res2 <- t(as.data.frame(res2))
pheatmap(res2,
         angle_col = "45",
         show_colnames = T,
         cluster_cols = F,
         color = colorRampPalette(c("navy", "white", "firebrick3"))(50))
#展示在一半以上样本里丰度大于0的免疫细胞
k <- apply(res1,2,function(x) {sum(x == 0) < nrow(exp)/2})
table(k)
#FALSE  TRUE
#11    11
res3 <- as.data.frame(t(res1[,k]))
pheatmap(res3,scale = "row",
         angle_col = "45",
         show_colnames = T,
         cluster_cols = F,
         color = colorRampPalette(c("navy", "white", "firebrick3"))(50))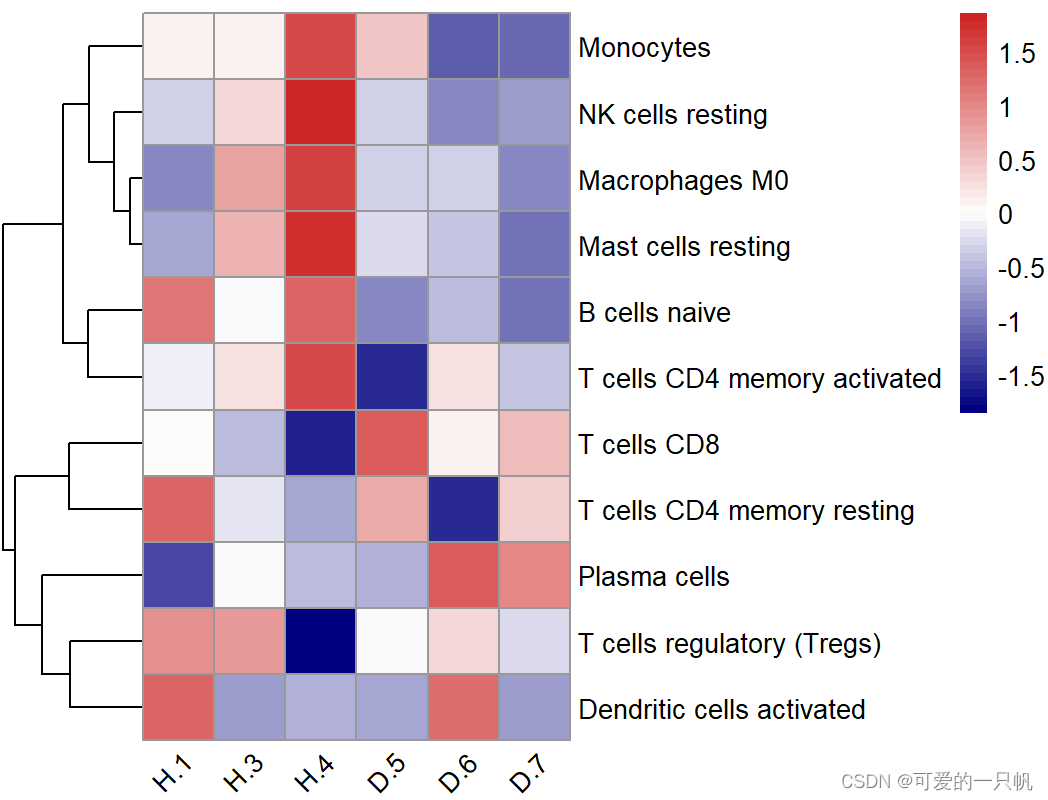
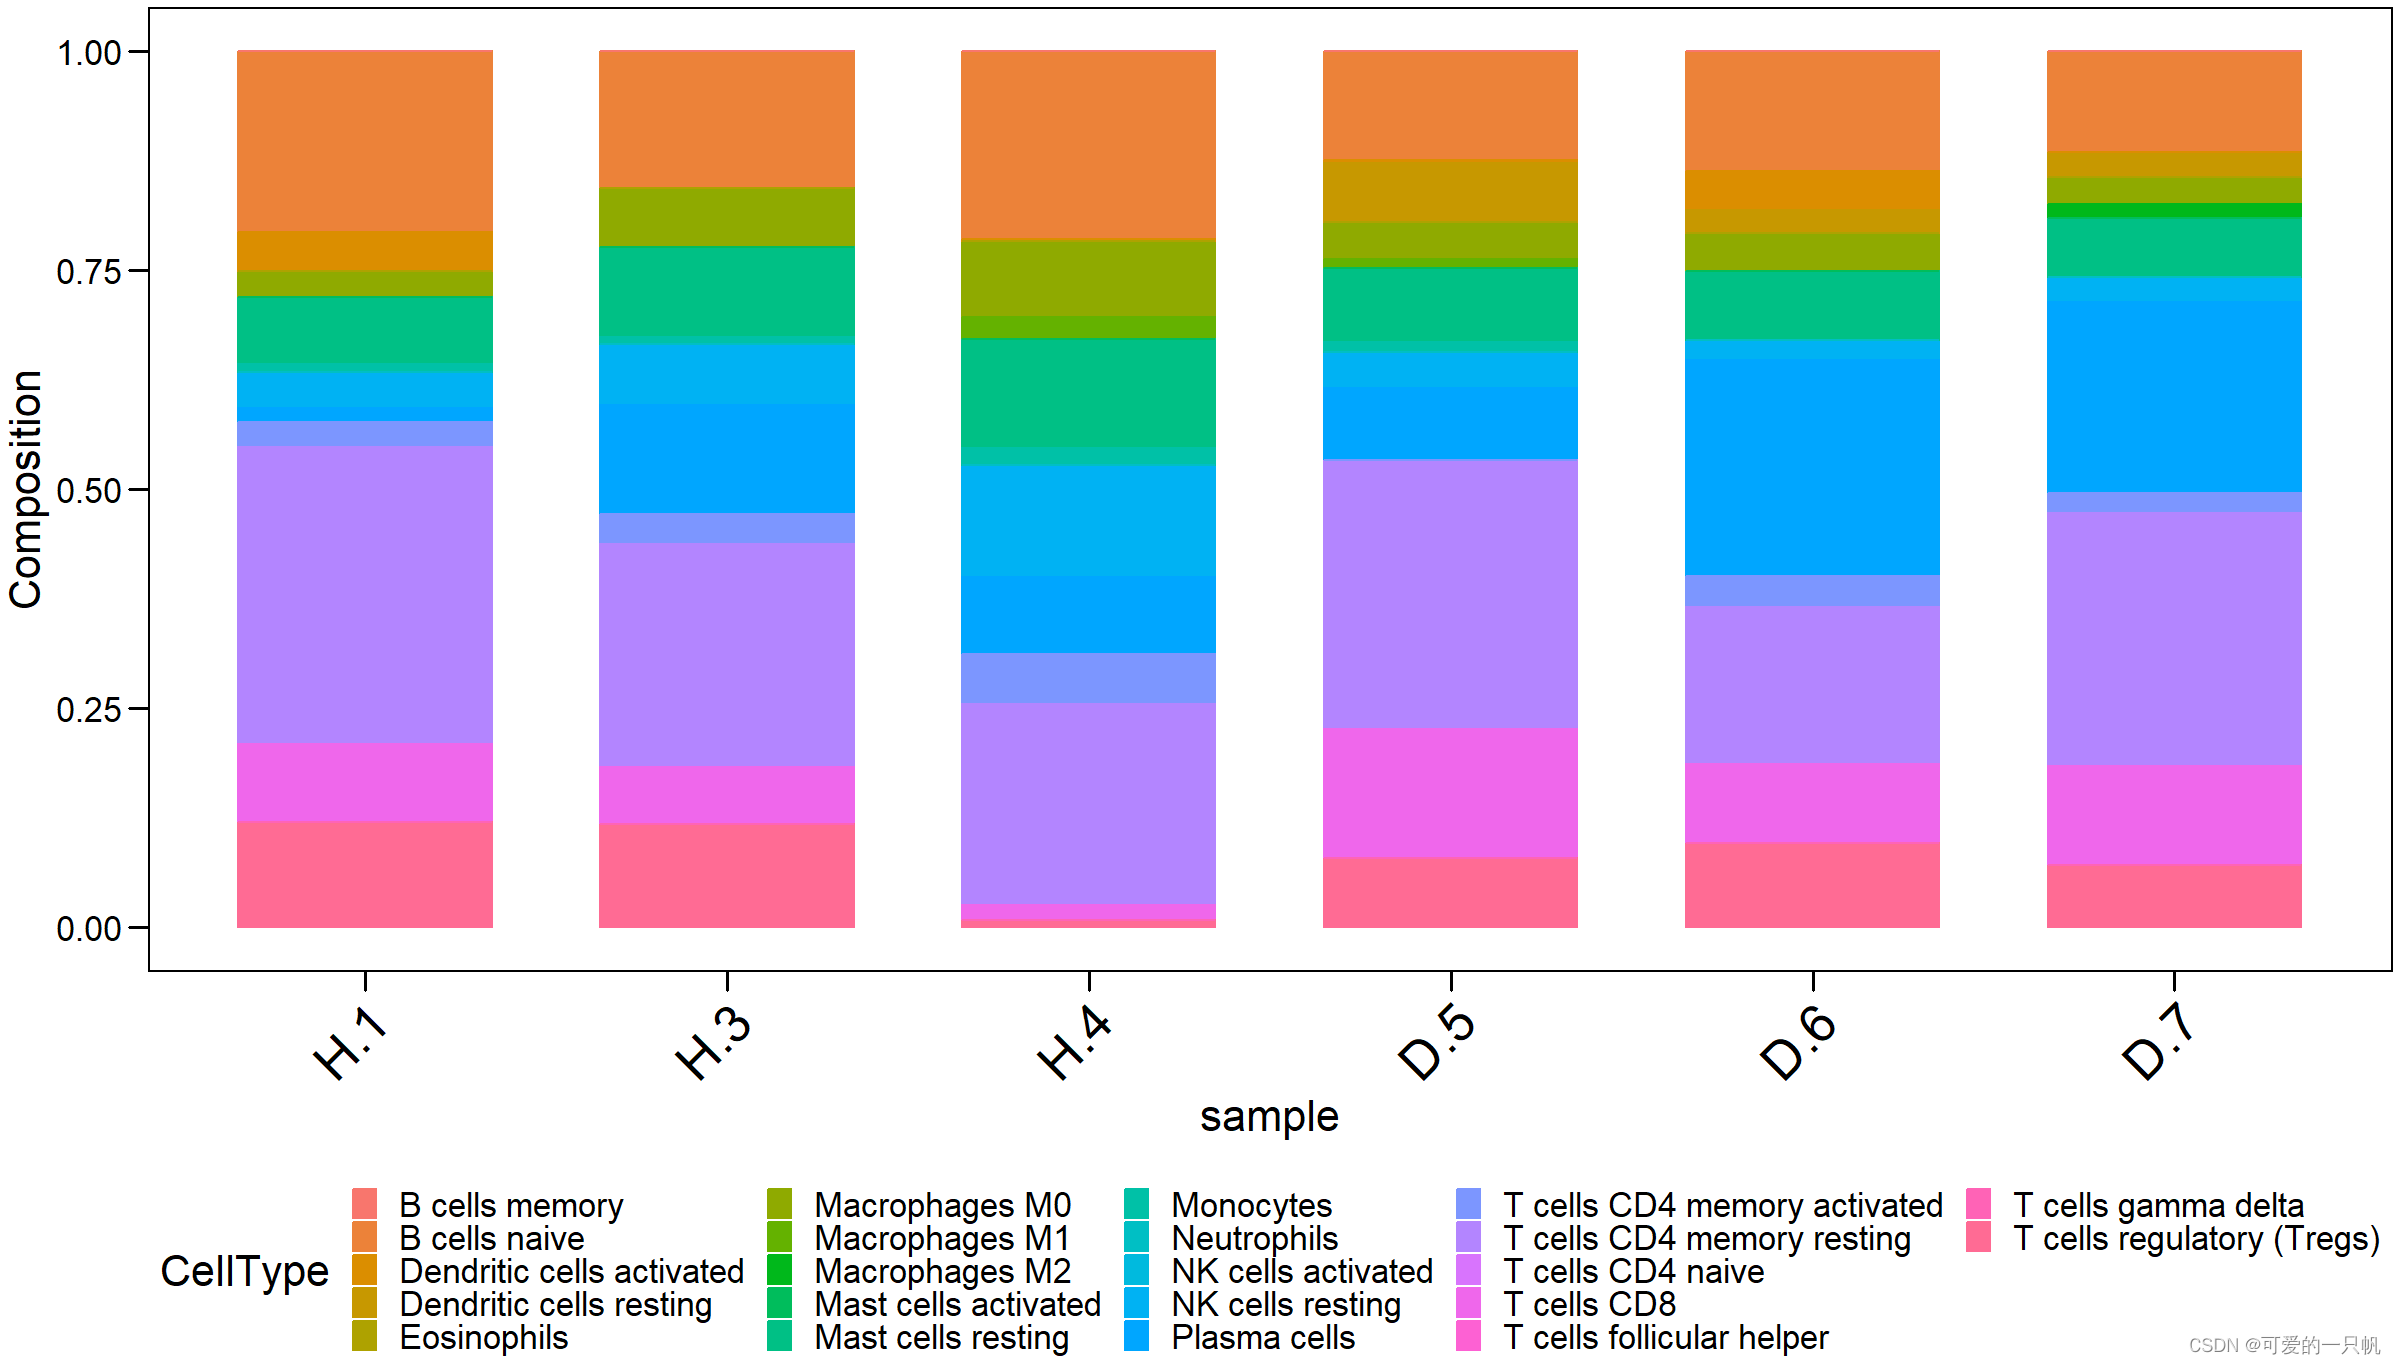
#3.柱状图
res4 <- exp %>%
  as.data.frame() %>%
  rownames_to_column("sample") %>%
  pivot_longer(cols = 2:23,
               names_to = "CellType",
               values_to = "Composition")
ggbarplot(
  res4,
  x = "sample",
  y = "Composition",
  size = 0.5,
  fill = "CellType",
  color = "CellType") +
  theme_base() +
  theme(axis.text.x = element_text(
      angle = 45,
      hjust = 1,
      vjust = 1,
      size = 20),
    legend.position = "bottom",
    legend.key.size = unit(10,"pt")
  )
参考:量化免疫浸润时CIBERSORT的注意事项。 · Issue #694 · gege-circle/home · GitHub


 1248
1248

 被折叠的 条评论
为什么被折叠?
被折叠的 条评论
为什么被折叠?
 到【灌水乐园】发言


