


MATLAB联合标定工具使用
引言
激光雷达-摄像机校准包括将激光雷达传感器和摄像机的数据转换到同一坐标系。这样就能融合两个传感器的数据,准确识别场景中的物体。
总结步骤如下:
- 采集同步数据:ROS录制(推荐),或者代码同步触发采集
- ROS同步解包:一一对应的图片和点云数据
- 相机内参标定
- 激光雷达与相机外参标定
- 标定信息标准化文件生成
- 点云与图像配准映射
参考链接🔗:
1. 激光雷达和相机联合标定保姆级教程
2. 激光雷达和相机联合标定(一)——ROS同步解包
3. MATLAB安装参考链接🔗:https://mp.weixin.qq.com/s/y1VMqjHStq_e1UL0TbAD9w
参考文档下载:单相机校准程序中文.pdf
链接: https://pan.baidu.com/s/1bV1iRvYVxMdkwL30pUXlHg?pwd=2410

MATLAB标定工具包括如下:
- Camera Calibrator 单目相机标定
- Lidar Camera Calibrator 激光雷达-相机联合标定
- Stereo Camera Calibrator 双目相机联合标定
1 MATLAB 样例标定(lidar+camera)
1.1 官网数据集准备
打开MATLAB R2024a安装路径,找到~\MATLAB\R2024a\toolbox\lidar\lidardata\lcc文件夹,复制到自己的文件夹下面

1.2 激光雷达相机联合校准
MATLAB官方链接:
(1)打开 Lidar Camera Calibrator App
激光雷达相机校准器(Lidar Camera Calibrator)应用程序可使用相机和激光雷达传感器分别捕获的图像和点云进行交互式校准,以估算它们之间的刚性变换。便于使用变换矩阵融合激光雷达和相机数据,或将激光雷达点投射到图像上。
该应用程序功能如下:
- 从图像和点云数据中检测、提取和可视化棋盘式特征。
- 利用特征检测结果估算相机和激光雷达之间的刚性变换。
- 使用校准结果融合两个传感器的数据,可以直观地看到投射到图像上的点云数据,以及图像与点云数据融合后的彩色或灰度信息。
- 查看绘制的校准误差指标,可以使用阈值线移除异常值,并重新校准剩余数据。
- 在棋盘格周围定义感兴趣区域 (ROI),以减少变换估算过程所需的计算资源。
- 将变换和误差度量数据导出为工作区变量或 MAT 文件,还可以为整个工作流程创建 MATLAB脚本。
(2)导入数据
使用vip16文件夹下的数据,根据官方提供的测试数据,棋盘格单元尺寸为81mm


(3)编辑感兴趣区域 Edit ROI

通过调整感兴趣区域,缩小范围,减少计算量

(4)选择棋盘格位置 Select Checkerboard

在点云数据中框选棋盘格位置

(5)Detect 和Calibrate


1.3 导出标定结果
导出结果Export

三种选择
- Export Parameters to Workspace
- Export Parameters to File
- Generate MATLAB Script
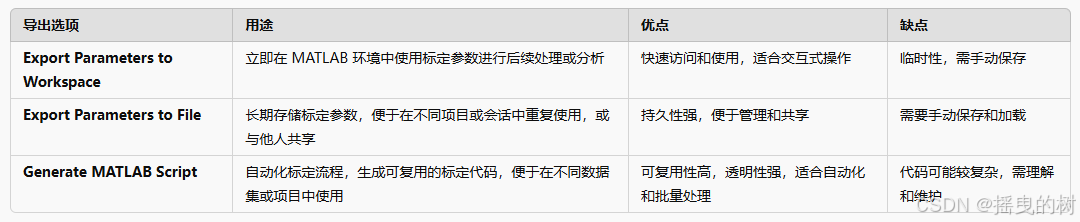
1.3.1 Export Parameters to Workspace(导出参数到工作区)如图所示
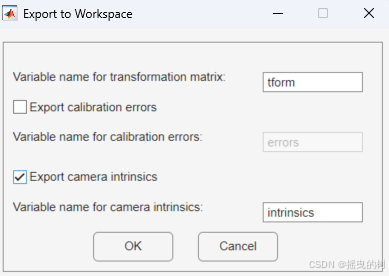
导出方式:将标定得到的参数作为变量直接导出到 MATLAB 的当前工作区(Workspace)。
导出内容:通常包括一个或多个 cameraParameters 对象,这些对象包含相机的内参(Intrinsic Parameters)和畸变系数(Distortion Coefficients)等信息,临时保存。

相机内参信息

外参信息

在命令行窗口输入参数变量即可显示具体的值

1.3.2 Export Parameters to File (导出参数到文件)推荐
导出方式:将标定参数保存到外部文件中,通常为 .mat 格式,也可能支持其他格式(如 .json、.xml 等)。
导出内容:包含相机的内参、畸变系数、旋转向量、平移向量等完整的标定信息,长久保存。

1.3.3 Generate MATLAB Script**(生成 MATLAB 脚本)
自动化标定流程,生成可复用的标定代码,使于在不同数据集或项目中使用
% Auto-generated by LidarCameraCalibrator app on 2024-10-05
%-------------------------------------------------------
%

%% Image files
imageFilePaths = { 'C:\Users\Alian\Documents\MATLAB\lcc\vlp16\images\0001.png'; ...
    'C:\Users\Alian\Documents\MATLAB\lcc\vlp16\images\0002.png'; ...
    'C:\Users\Alian\Documents\MATLAB\lcc\vlp16\images\0003.png'; ...
    'C:\Users\Alian\Documents\MATLAB\lcc\vlp16\images\0004.png'; ...
    'C:\Users\Alian\Documents\MATLAB\lcc\vlp16\images\0005.png'; ...
    'C:\Users\Alian\Documents\MATLAB\lcc\vlp16\images\0006.png'; ...
    'C:\Users\Alian\Documents\MATLAB\lcc\vlp16\images\0007.png'; ...
    'C:\Users\Alian\Documents\MATLAB\lcc\vlp16\images\0008.png'; ...
    'C:\Users\Alian\Documents\MATLAB\lcc\vlp16\images\0009.png'; ...
    'C:\Users\Alian\Documents\MATLAB\lcc\vlp16\images\0010.png'; ...
    'C:\Users\Alian\Documents\MATLAB\lcc\vlp16\images\0011.png'  };

%% Point cloud files
ptcFilePaths = { 'C:\Users\Alian\Documents\MATLAB\lcc\vlp16\pointCloud\0001.pcd'; ...
    'C:\Users\Alian\Documents\MATLAB\lcc\vlp16\pointCloud\0002.pcd'; ...
    'C:\Users\Alian\Documents\MATLAB\lcc\vlp16\pointCloud\0003.pcd'; ...
    'C:\Users\Alian\Documents\MATLAB\lcc\vlp16\pointCloud\0004.pcd'; ...
    'C:\Users\Alian\Documents\MATLAB\lcc\vlp16\pointCloud\0005.pcd'; ...
    'C:\Users\Alian\Documents\MATLAB\lcc\vlp16\pointCloud\0006.pcd'; ...
    'C:\Users\Alian\Documents\MATLAB\lcc\vlp16\pointCloud\0007.pcd'; ...
    'C:\Users\Alian\Documents\MATLAB\lcc\vlp16\pointCloud\0008.pcd'; ...
    'C:\Users\Alian\Documents\MATLAB\lcc\vlp16\pointCloud\0009.pcd'; ...
    'C:\Users\Alian\Documents\MATLAB\lcc\vlp16\pointCloud\0010.pcd'; ...
    'C:\Users\Alian\Documents\MATLAB\lcc\vlp16\pointCloud\0011.pcd'  };

%% Load initial parameters
squareSize = 81;
padding = [0 0 0 0];

%% Compute camera intrinsics
% Detect calibration pattern
[imagePoints, boardSize] = detectCheckerboardPoints(imageFilePaths);

% Generate world coordinates of the corners of the squares
worldPoints = generateCheckerboardPoints(boardSize, squareSize);

% Calibrate the camera
I = imread(imageFilePaths{1});
imageSize = [size(I, 1), size(I, 2)];
params = estimateCameraParameters(imagePoints, worldPoints, 'ImageSize', imageSize);
intrinsics = params.Intrinsics;

%% Estimate 3D checkerboard points from images
minCornerMetric = 0.150000;
imageCorners3d = nan(4,3,numel(imageFilePaths));
[validImageCorners3d, planeDimension, imgDataUsed] = estimateCheckerboardCorners3d(imageFilePaths, intrinsics, squareSize, 'Padding', padding, 'MinCornerMetric', minCornerMetric);
imageCorners3d(:,:,imgDataUsed) = validImageCorners3d;

% Get the data pairs rejected by the user
isRejectedByUser = [false false false false false false false false false false false]';

%% Detect plane segment from point clouds
minDistance = 0.500000;
roi = [[0 10 -5 5 -2 2]; [0 10 -5 5 -2 2]; [0 10 -5 5 -2 2]; [0 10 -5 5 -2 2]; [0 10 -5 5 -2 2]; [0 10 -5 5 -2 2]; [0 10 -5 5 -2 2]; [0 10 -5 5 -2 2]; [0 10 -5 5 -2 2]; [0 10 -5 5 -2 2]; [0 10 -5 5 -2 2]];
dimTol = 0.050000;
removeGround = true;
rng('default');
detectionResults = struct();

for i = 1:numel(ptcFilePaths)
    [detectionResults(i).lidarCheckerboardPlane, detectionResults(i).ptCloudUsed] = detectRectangularPlanePoints(ptcFilePaths{i}, planeDimension, 'RemoveGround', removeGround, 'ROI', roi(i,:), 'DimensionTolerance', dimTol, 'MinDistance', minDistance);
    if detectionResults(i).ptCloudUsed
        lidarCheckerboardPlanes(i) = detectionResults(i).lidarCheckerboardPlane;
    else
        lidarCheckerboardPlanes(i) = pointCloud(nan(1,3));
    end
end

%% Filter the data
validIdx = transpose([detectionResults.ptCloudUsed]) & imgDataUsed & ~isRejectedByUser;

% Filter images and point clouds
imageFilePaths = imageFilePaths(validIdx);
ptcFilePaths = ptcFilePaths(validIdx);

% Filter 3-D image corners
imageCorners3d = imageCorners3d(:,:,validIdx);

% Filter lidar checkerboard planes
lidarCheckerboardPlanes = lidarCheckerboardPlanes(validIdx);

%% Estimate transformation between lidar point cloud and image 3-D corners
initialTransform = rigidtform3d( ...
    [1 0 0;0 1 0;0 0 1], ...
    [0 0 0]);
[tform, errors] = estimateLidarCameraTransform(lidarCheckerboardPlanes, imageCorners3d, intrinsics,'InitialTransform', initialTransform, 'verbose', true);

%% Project lidar points to an image
figure
im = imread(imageFilePaths{1});
im = undistortImage(im, intrinsics);
imPts = projectLidarPointsOnImage(lidarCheckerboardPlanes(1),intrinsics, tform);
im = insertMarker(im ,imPts,'*','color','blue','size', 3);
imshow(im);

%% Plot the errors
figure
subplot(1,3,1);
h1 = bar(errors.TranslationError, 0.4);
subplot(1,3,2);
h2 = bar(errors.RotationError, 0.4);
subplot(1,3,3);
h3 = bar(errors.ReprojectionError, 0.4);
t1 = title(h1.Parent, 'Translation Errors', 'Units', 'normalized');
t2 = title(h2.Parent, 'Rotation Errors', 'Units', 'normalized');
t3 = title(h3.Parent, 'Reprojection Errors', 'Units', 'normalized');
set(t1, 'Position', get(t1, 'Position')+[0 0.04 0]);
set(t2, 'Position', get(t2, 'Position')+[0 0.04 0]);
set(t3, 'Position', get(t3, 'Position')+[0 0.04 0]);
xlabel(h1.Parent, 'Image - Point Cloud Pairs');
xlabel(h2.Parent, 'Image - Point Cloud Pairs');
xlabel(h3.Parent, 'Image - Point Cloud Pairs');
ylabel(h1.Parent, 'Error (meters)');
ylabel(h2.Parent, 'Error (degrees)');
ylabel(h3.Parent, 'Error (pixels)');
2 标定信息标准化文件生成
标定信息最终是为了能够在自定义3D目标检测数据集上使用的,参考KITTI标定文件的格式(如下图),将标定信息导出为txt文件

创建matlab脚本mat2txt.m,代码如下:
% 加载 results.mat 文件
data = load('results.mat');

% 创建 results.txt 文件并写入参数
fid = fopen('0001.txt', 'w');

% 获取相机内参
intrinsics = data.intrinsics;
focalLength = intrinsics.FocalLength;        % [fx, fy]
principalPoint = intrinsics.PrincipalPoint;  % [cx, cy]

% 获取变换矩阵
tform = data.tform;
R = tform.R;                                  % 3x3 旋转矩阵
t = tform.Translation;                        % [tx, ty, tz]

% 将旋转矩阵和位移向量转换为齐次坐标形式
% Tr_velo_to_cam = [R, t';0, 0, 0, 1];
Tr_velo_to_cam = tform.A;
% 计算相机投影矩阵 P0, P1, P2, P3
P = [focalLength(1), 0, principalPoint(1), 0;
     0, focalLength(2), principalPoint(2), 0;
     0, 0, 1, 0];

% 定义写入矩阵的函数
function writeMatrix(fid, label, matrix)
    fprintf(fid, '%s: %e %e %e %e %e %e %e %e %e %e %e %e\n', label, ...
        matrix(1,1), matrix(1,2), matrix(1,3), matrix(1,4), ...
        matrix(2,1), matrix(2,2), matrix(2,3), matrix(2,4), ...
        matrix(3,1), matrix(3,2), matrix(3,3), matrix(3,4));
end

% 写入 P0, P1, P2, P3
for i = 0:3
    writeMatrix(fid, ['P' num2str(i)], P);
end

% 写入 R0_rect(假设为单位矩阵)
R0_rect = eye(3);
fprintf(fid, 'R0_rect: %e %e %e %e %e %e %e %e %e\n', R0_rect');

% 写入 Tr_velo_to_cam
writeMatrix(fid, 'Tr_velo_to_cam', Tr_velo_to_cam);

% 写入 Tr_imu_to_velo(需要您根据实际情况进行计算和定义)
fprintf(fid, 'Tr_imu_to_velo: %e %e %e %e %e %e %e %e %e %e %e %e\n', ...
    zeros(1, 12)); % 示例

fclose(fid);
生成的txt标定文件如下:

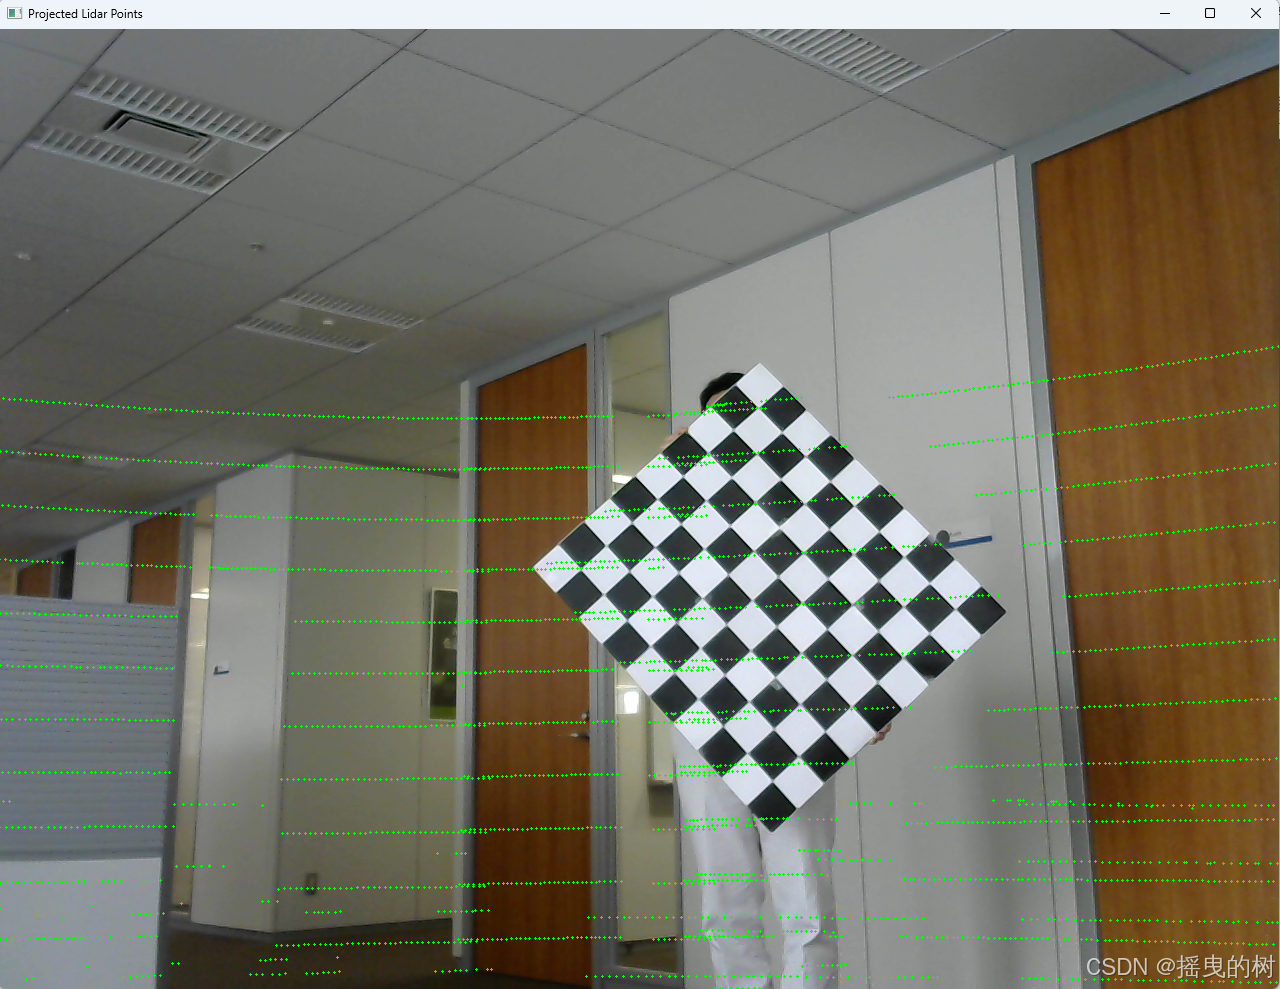
3 点云与图像配准映射
创建python脚本lidar2img.py,代码如下:
import numpy as np
import cv2
import open3d as o3d
import argparse

# 读取标定文件
def read_calibration_file(filename):
    parameters = {}
    with open(filename, 'r') as f:
        for line in f:
            parts = line.strip().split(':')
            if len(parts) == 2:
                key = parts[0].strip()
                values = np.fromstring(parts[1].strip(), sep=' ')
                parameters[key] = values
    return parameters

# 读取点云文件(支持 .pcd 和 .bin)
def read_point_cloud(filename):
    if filename.endswith('.pcd'):
        pcd = o3d.io.read_point_cloud(filename)
        return np.asarray(pcd.points)
    elif filename.endswith('.bin'):
        points = np.fromfile(filename, dtype=np.float32).reshape(-1, 4)[:, :3]
        return points
    else:
        raise ValueError("Unsupported point cloud file format: {}".format(filename))

# 主函数
def main():
    # 设置命令行参数解析
    parser = argparse.ArgumentParser(description='将 KITTI 点云投影到图像上并可视化。')
    parser.add_argument('--calib', type=str, default='0001.txt', help='校正文件路径')
    parser.add_argument('--image', type=str, default='0001.png', help='图像文件路径')
    parser.add_argument('--point_cloud', type=str, default='0001.pcd', help='点云文件路径')
    parser.add_argument('--output', type=str, default='0001.jpg', help='输出图像文件路径')
    parser.add_argument('--color', type=str, default='0,255,0', help='投影点颜色,格式为 R,G,B')
    parser.add_argument('--size', type=int, default=2, help='投影点大小')

    args = parser.parse_args()

    # 从标定文件中提取参数
    calib_params = read_calibration_file(args.calib)
    P0 = calib_params['P0'].reshape(3, 4)
    Tr_velo_to_cam = calib_params['Tr_velo_to_cam'].reshape(3, 4)

    # 读取点云文件
    points = read_point_cloud(args.point_cloud)

    # 读取图像
    image = cv2.imread(args.image)
    image_height, image_width = image.shape[:2]

    # 将点云坐标从点云坐标系转换到相机坐标系
    points_homogeneous = np.hstack((points, np.ones((points.shape[0], 1))))  # 变为齐次坐标
    cam_points = Tr_velo_to_cam @ points_homogeneous.T
    cam_points = cam_points.T[:, :3]  # 只取前3列

    # 投影点云到图像平面
    # 使用相机内参 P0 进行投影
    u = cam_points[:, 0] / cam_points[:, 2] * P0[0, 0] + P0[0, 2]  # x 坐标
    v = cam_points[:, 1] / cam_points[:, 2] * P0[1, 1] + P0[1, 2]  # y 坐标

    # 过滤在图像外的点
    valid_mask = (u >= 0) & (u < image_width) & (v >= 0) & (v < image_height)
    u = u[valid_mask].astype(int)
    v = v[valid_mask].astype(int)

    # 解析颜色
    color = [int(c) for c in args.color.split(',')]

    # 绘制标记点
    for i in range(len(u)):
        cv2.drawMarker(image, (u[i], v[i]), color=color, markerType=cv2.MARKER_CROSS, markerSize=args.size)

    # 保存投影结果
    cv2.imwrite(args.output, image)

    # 展示结果
    cv2.imshow('Projected Lidar Points', image)
    cv2.waitKey(0)
    cv2.destroyAllWindows()

if __name__ == "__main__":
    main()


 63
63

 被折叠的 条评论
为什么被折叠?
被折叠的 条评论
为什么被折叠?
 到【灌水乐园】发言


