


> go <- read.csv("go.csv",header = T) #Go 条目一般只选择最显著的前10个或20个Term来绘图#
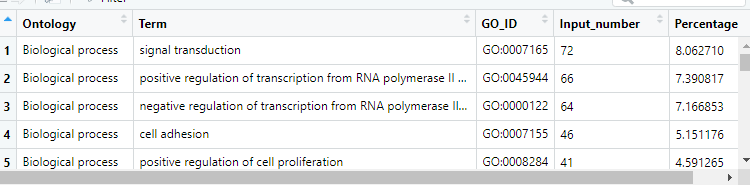
> head(go)
Ontology
1 Biological process
2 Biological process
3 Biological process
4 Biological process
5 Biological process
6 Biological process
Term GO_ID
1 signal transduction GO:0007165
2 positive regulation of transcription from RNA polymerase II promoter GO:0045944
3 negative regulation of transcription from RNA polymerase II promoter GO:0000122
4 cell adhesion GO:0007155
5 positive regulation of cell proliferation GO:0008284
6 positive regulation of transcription, DNA-templated GO:0045893
Input_number Percentage
1 72 8.062710
2 66 7.390817
3 64 7.166853
4 46 5.151176
5 41 4.591265
6 40 4.47928

> library(ggplot2)
> go_sort <- go[order(go$Ontology,-go$Percentage),]#根据go$Percentage和go$Percentage排序
> m <- go_sort[go_sort$Ontology=="Molecular function",][1:10,]
> head(m)
Ontology
31 Molecular function
32 Molecular function
33 Molecular function
34 Molecular function
35 Molecular function
36 Molecular function
Term GO_ID
31 protein binding GO:0005515
32 protein homodimerization activity GO:0042803
33 transcription factor activity, sequence-specific DNA binding GO:0003700
34 calcium ion binding GO:0005509
35 identical protein binding GO:0042802
36 sequence-specific DNA binding GO:0043565
Input_number Percentage
31 455 50.951848
32 60 6.718925
33 59 6.606943
34 58 6.494961
35 49 5.487122
36 41 4.591265
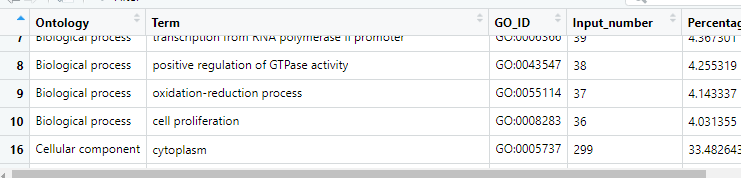
> c <- go_sort[go_sort$Ontology=="Cellular component",][1:10,]
> b <- go_sort[go_sort$Ontology=="Biological process",][1:10,]
> slimgo <- rbind(b,c,m) #把b,c,m合并到了一起#
> slimgo$Term = factor(slimgo$Term,levels = slimgo$Term) # 将term列转换为因子#
> class(slimgo$Term)
[1] "factor"
> colnames(slimgo)  #ggplot2用到好多列名,先输出来#
[1] "Ontology"     "Term"         "GO_ID"        "Input_number" "Percentage"

> pp <- ggplot(data = slimgo,mapping = aes(x=Term,y=Percentage,fill=Ontology))
#fill=Ontology,意为Ontology为填充色#
> pp

> pp+geom_bar(stat = "identity")

> pp+geom_bar(stat = "identity")+coord_flip() #Term太多了,反转一下x,y轴#

#term是从小到大排列,习惯从大到小排列#
> pp+geom_bar(stat = "identity")+coord_flip()+scale_x_discrete(limits=rev(levels(slimgo$Term)))

> pp+geom_bar(stat = "identity")+coord_flip()+scale_x_discrete(limits=rev(levels(slimgo$Term)))+guides(fill=FALSE)
#去掉了图列#

> pp+geom_bar(stat = "identity")+coord_flip()+scale_x_discrete(limits=rev(levels(slimgo$Term)))+guides(fill=FALSE)+theme_bw()
#切换成黑白背景的主题#

链接:https://pan.baidu.com/s/1Yp4XMHxGrjfaOPNM-PCg_w
提取码:gw3x
复制这段内容后打开百度网盘手机App,操作更方便哦
《R语言与生物信息绘图》课程笔记


 7125
7125


 被折叠的 条评论
为什么被折叠?
被折叠的 条评论
为什么被折叠?
 到【灌水乐园】发言


