


devtools::install_github("xmc811/Scillus", ref = "development")
画图类的包和函数记得用?看帮助文档里的parameter
- initial step
(1)sample data
输入格式多样,可以是10x输出的标准三文件,也可以是分群注释好的Seurat object,本次以读入csv.gz为例。
(2)meta data
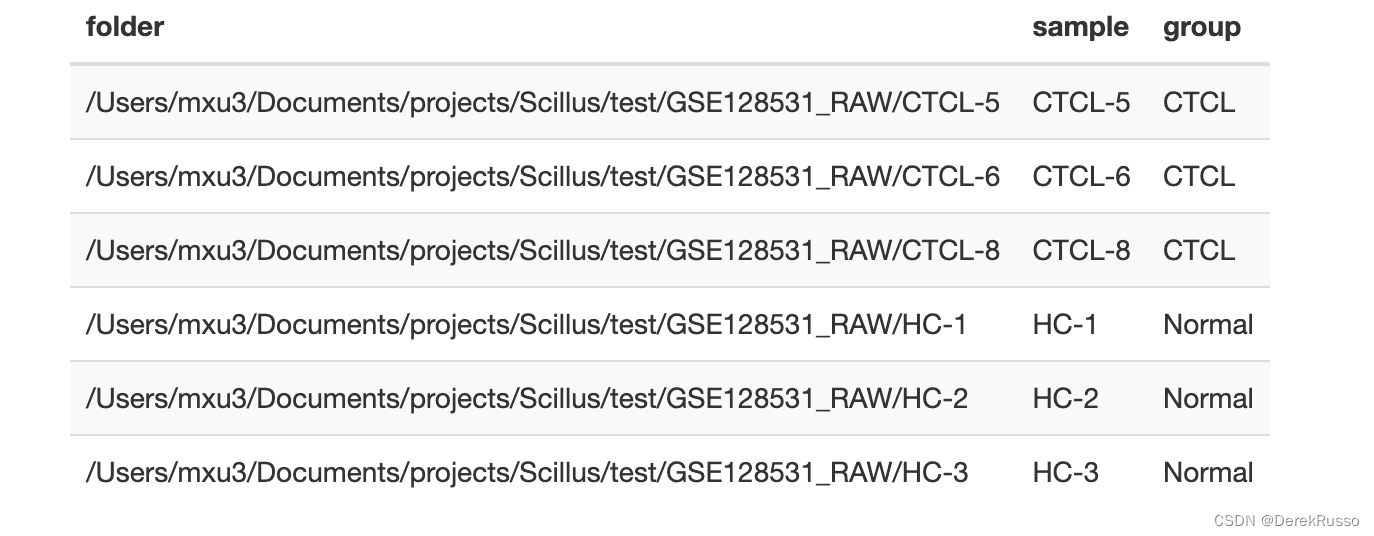
一般scRNA会有多样品、多组的各自文件,scillus在导入他们的时候会生成对应的多个Seurat object,所以需要对此做一个meta data frame。至少两列,一列sample,一列file or folder。
library(tidyverse)

a <- list.files("your/path/to/sample/data/GSE128531_RAW", full.names = TRUE)
m <- tibble(file = a,
            sample = stringr::str_remove(basename(a), ".csv.gz"),
            group = rep(c("CTCL", "Normal"), each = 3)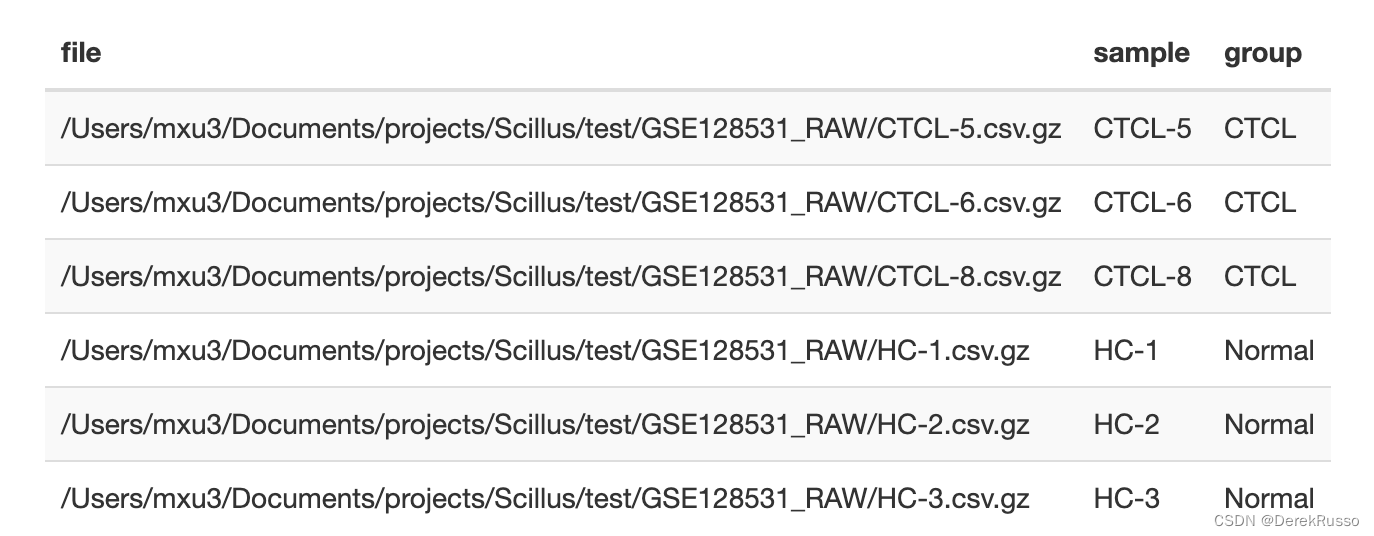
或者(如果有sex等其他变量一样可以加进来)
(3)pallate set up
保证前后色调的统一性
pal <- tibble(var = c("sample", "group","seurat_clusters"),
pal = c("Set2","Set1","Paired"))- data processing
(1)loading raw data
library(Scillus)
library(tidyverse)
library(Seurat)
library(magrittr)

scRNA <- load_scfile(m)

#结果是一个list,每个object都是seurat object
#自动计算了线粒体基因含量

length(scRNA)
(2)plotting qc metrics
The resulting plot can be further customized (axis.title, theme, etc.) using ggplot grammar.
此外,function中还有三个optional parameter:
1, plot_type:默认是小提琴图和箱线图混合,可以改为“box”"violin""density"
2,group_by:默认是metadata里的sample,可以指定metadata里的其他列,例如group,sex
3,pal_setup:可以有三种输入,一是前面设置好的pal dataframe,二是RColorBrewer palette name,三是manually specified color vector.
plot_qc(scRNA, metrics = "nFeature_RNA")plot_qc(scRNA, metrics = "percent.mt")plot_qc(scRNA, metrics = "nCount_RNA")#注意加号后面的ggplot2语法
plot_qc(scRNA, metrics = "nCount_RNA", plot_type = "density") + scale_x 最低0.47元/天 解锁文章


 1166
1166


 被折叠的 条评论
为什么被折叠?
被折叠的 条评论
为什么被折叠?
 到【灌水乐园】发言


