


 Unity 5.0引入了一个简单的帧调试器,允许开发者在游戏视图中逐步查看帧渲染过程,包括绘制调用、阴影贴图、渲染目标等。这个工具无需外部软件,直接在编辑器中即可使用,简化了对图形问题的排查。虽然它仅限于编辑器内使用,但仍然是解决游戏图形问题的有效辅助工具。
Have you ever looked at some graphics issue in Unity, and thought “if only I could see how the final frame is rendered, step-by-step?”. I know I do want that, all the time.
您是否曾经看过Unity中的一些图形问题,并想过“如果我能一步一步地看到最终帧的渲染方式吗?”。 我知道自己想要的是, 所有的时间 。
You can achieve that with some external tools, especially if you’re on Windows. Build a standalone player, run it through Visual Studio graphics debugger, Intel GPA, RenderDoc, NVIDIA NSight or AMD GPU PerfStudio, then capture a frame of rendering, and step through the draw calls and other rendering events to see what’s going on.
您可以使用一些外部工具来实现这一点,尤其是在Windows上。 构建一个独立的播放器,通过Visual Studio图形调试器 , Intel GPA , RenderDoc , NVIDIA NSight或AMD GPU PerfStudio运行它,然后捕获渲染帧,并逐步执行绘制调用和其他渲染事件以查看发生了什么。
The above is a very powerful approach, since these tools can provide you with a lot of information to really drill down. It’s also very involved; you need to build a player and launch external tool.
上面是一种非常强大的方法,因为这些工具可以为您提供大量信息,以供您深入研究。 它也非常参与; 您需要构建一个播放器并启动外部工具。
During one hack week we thought: “hey, can we build something really simple, but really quick to use in Unity?”… So we did.
在一个黑客周中,我们认为:“ 嘿,我们可以构建一些非常简单但又可以很快在Unity中使用的东西吗? ”…我们做到了。
输入帧调试器 (Enter Frame Debugger)
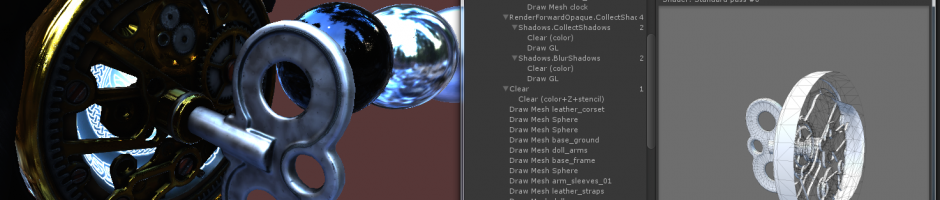
You select Frame Debugger from the Window menu and you see a list of draw calls made during that frame. Step through them and see what was rendered up to that point. Inspect shadow maps, temporary render textures, deferred g-buffer and whatnot.
您从“窗口”菜单中选择“帧调试器”,然后看到在该帧期间进行的绘图调用的列表。 逐步浏览它们,看看到那时为止呈现了什么。 检查阴影贴图,临时渲染纹理,延迟的g缓冲区等。
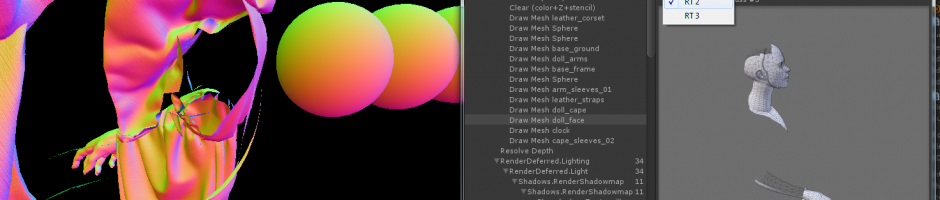
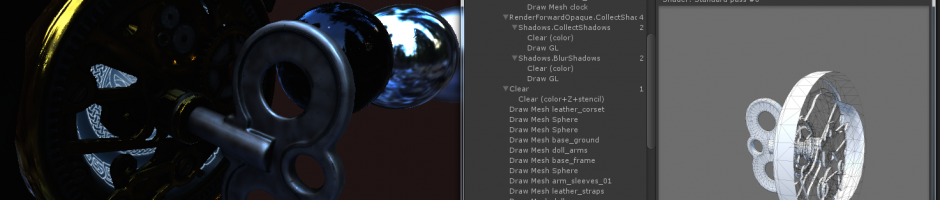
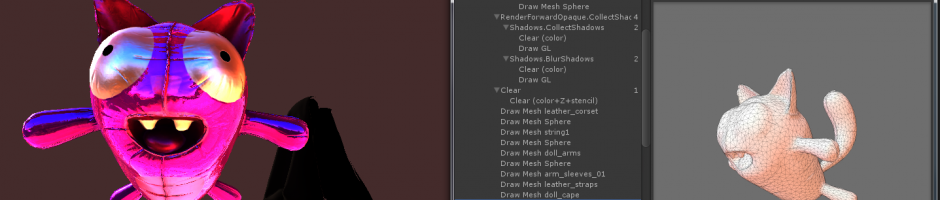
The UI for the frame debugger is pretty simple. There’s a tree of draw calls and other interesting events on the right and details about selected event on the left. Most draw calls display a mesh preview and highlight object being drawn in the hierarchy.
框架调试器的用户界面非常简单。 右侧有一棵抽奖电话和其他有趣事件的树,而左侧则是有关选定事件的详细信息。 大多数绘图调用会显示网格预览并突出显示层次结构中正在绘制的对象。
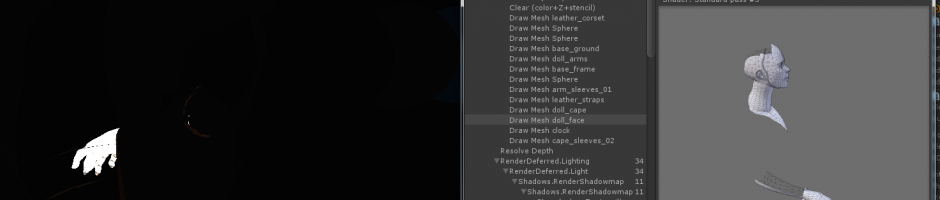
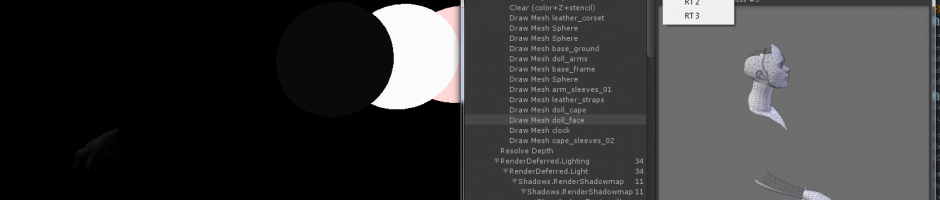
Here we are stepping through the draw calls of depth texture creation, in glorious animated GIF form:
在这里,我们以光彩的GIF动画形式逐步完成深度纹理创建的绘制调用:
And later on in the frame, a light is rendering it’s shadow map:
然后在框架中,灯光渲染了它的阴影贴图:
Even later on, image post-processing effects start. You can see the bloom & flares effect downscaling the image, blurring it and adding it back, followed by a brief flash of a tonemapper:
甚至以后,图像后处理效果也会开始。 您会看到“光晕与闪光”效果会缩小图像的比例,使其模糊并添加回去,然后短暂闪烁一个色调映射器:
渲染目标显示选项 (Render target display options)
For some effects, it is convenient to see individual channels of a render target. Here’s a screenspace buffer produced by Unity’s directional light shadows:
对于某些效果,可以方便地查看渲染目标的各个通道。 这是由Unity的定向光影产生的屏幕空间缓冲区:
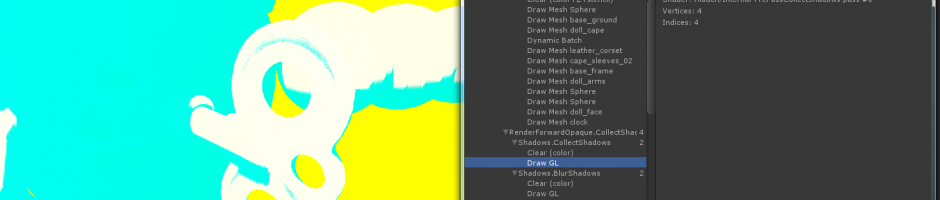
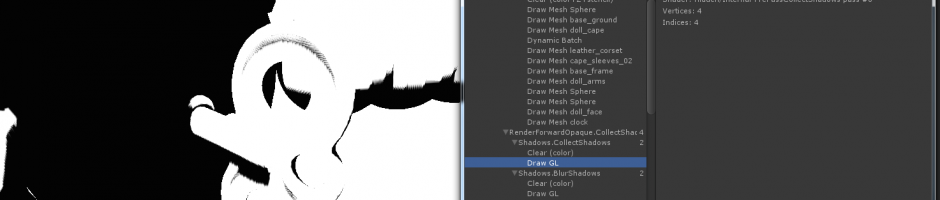
And here’s only the red channel displayed:
这只是显示的红色通道:
The range of colors displayed can be tweaked via a Levels slider in the toolbar. This is particularly useful for HDR rendering:
可以通过工具栏中的“色阶”滑块来调整显示的颜色范围。 这对于HDR渲染特别有用:
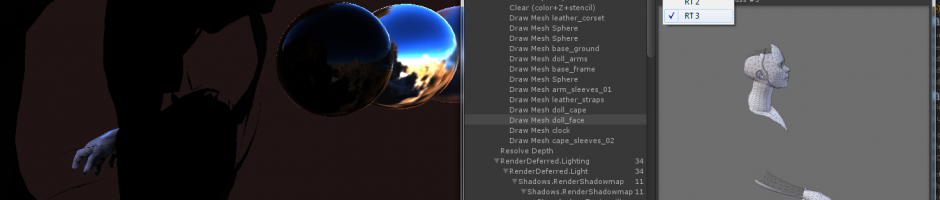
When rendering into multiple render targets at once you can select which one to display in the game view. Shown here are the diffuse, specular, normals and emission/lighting buffers in 5.0 deferred shading mode, respectively:
一次渲染到多个渲染目标时,您可以选择在游戏视图中显示哪个目标。 此处分别显示了5.0延迟着色模式下的漫反射,镜面反射,法线和发射/照明缓冲区:
实施说明 (Implementation notes)
The current implementation of the Frame Debugger could be seen as a cute hack (we weren’t quite sure ourselves whether it would work at all). There’s no actual “frame capture” going on; pretty much all we do is stop rendering after some number of draw calls. So if you’re looking at a frame that would have 100 objects rendered and you’re looking at object #10 right now, then we just skip rendering the remaining 90. If at that point in time we happen to be rendering into a render texture, then we display it on the screen.
可以将Frame Debugger的当前实现视为一个可爱的技巧(我们不太确定自己是否可以使用) 。 没有实际的“帧捕获”。 我们几乎要做的就是在一定数量的绘制调用之后停止渲染 。 因此,如果您正在查看一个将渲染100个对象的框架,并且现在正在查看对象#10,那么我们将跳过渲染其余90个对象的过程。如果在那时,我们恰好正在渲染到一个渲染器中纹理,然后将其显示在屏幕上。
This means the implementation is simple; getting functionality working was only a few days of work (and then a few weeks iterating on the UI). The downsides of this approach is that it only works in the Editor. If actual rendering changes while you’re debugging the frame (e.g. you disable some objects, or resize game view), then you’ll suddenly start looking at a different list of draw calls. However, even with these limitations we think it can be a very useful tool for tracking down graphics issues in your games.
这意味着实现很简单; 使功能正常工作仅需要几天的工作(然后在UI上迭代需要几周的时间) 。 这种方法的缺点是仅在编辑器中有效。 如果在调试框架时实际渲染发生了变化(例如,禁用了某些对象或调整了游戏视图的大小) ,那么您将突然开始查看其他绘制调用列表。 但是,即使有这些限制,我们仍认为它对于跟踪游戏中的图形问题可能是非常有用的工具。
Happy frame debugging!
快乐的框架调试!
翻译自: https://blogs.unity3d.com/2014/07/29/frame-debugger-in-unity-5-0/


 3628
3628

 被折叠的 条评论
为什么被折叠?
被折叠的 条评论
为什么被折叠?
 到【灌水乐园】发言


