


 这篇博客展示了如何利用GIS库创建一个图像,其中每个像素的坐标以分钟为单位表示经纬度。通过修改代码中的乘数,可以控制是按度还是按分钟绘制网格,并通过设置颜色和透明度来突出显示经纬线。最终结果是一个清晰的经纬网格,可用于地理数据分析或地图可视化。
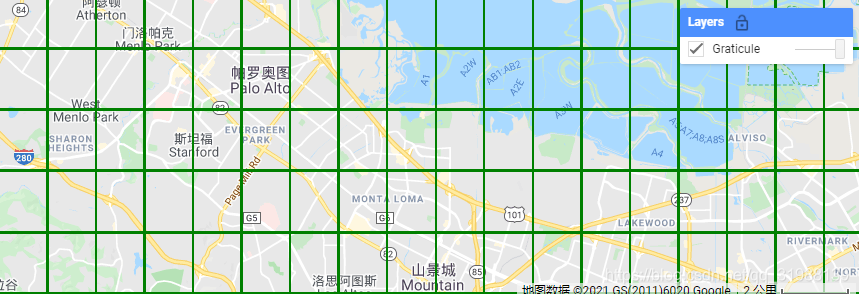
按分来绘制全球的经纬网
创建一个图像,其中每个像素的值是其 以分钟为单位的坐标。结果图形如下:
代码展示:
// 使用 pixelLonLat() 函数每度绘制 60 条纬度/经度线。
// 创建一个图像,其中每个像素的值是其
// 以分钟为单位的坐标。
var img = ee.Image.pixelLonLat().multiply(60.0);

// 获取小数部分并检查它是否小于一个小增量。
img = img.subtract(img.floor()).lt(0.05);

// 两个方向上小于 delta 的像素是的网格。
var grid = img.select('latitude').or(img.select('longitude'));

// Draw the grid.
Map.setCenter(-122.09228, 37.42330, 12);
Map.addLayer(grid.updateMask(grid), {palette: '008000'}, 'Graticule');
先展示图形:
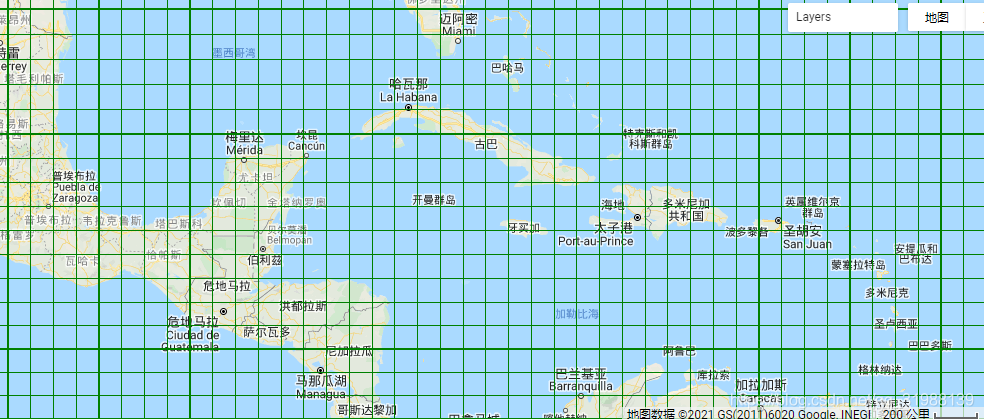 If you want to divide the world by degrees, you can use the following code:
//将下面的multiply(60.0)去掉或者改为1.0
var img = ee.Image.pixelLonLat().multiply(1.0);

// Get the decimal part and check if it's less than a small delta.
img = img.subtract(img.floor()).lt(0.05);

// The pixels less than the delta are the grid, in both directions.
var grid = img.select('latitude').or(img.select('longitude'));

// Draw the grid.
Map.setCenter(-122.09228, 37.42330, 12);
Map.addLayer(grid.updateMask(grid), {palette: '008000'}, 'Graticule');


 2329
2329

 被折叠的 条评论
为什么被折叠?
被折叠的 条评论
为什么被折叠?
 到【灌水乐园】发言


