


代谢产物差异分析 | 生信菜鸟团 http://www.bio-info-trainee.com/8512.html
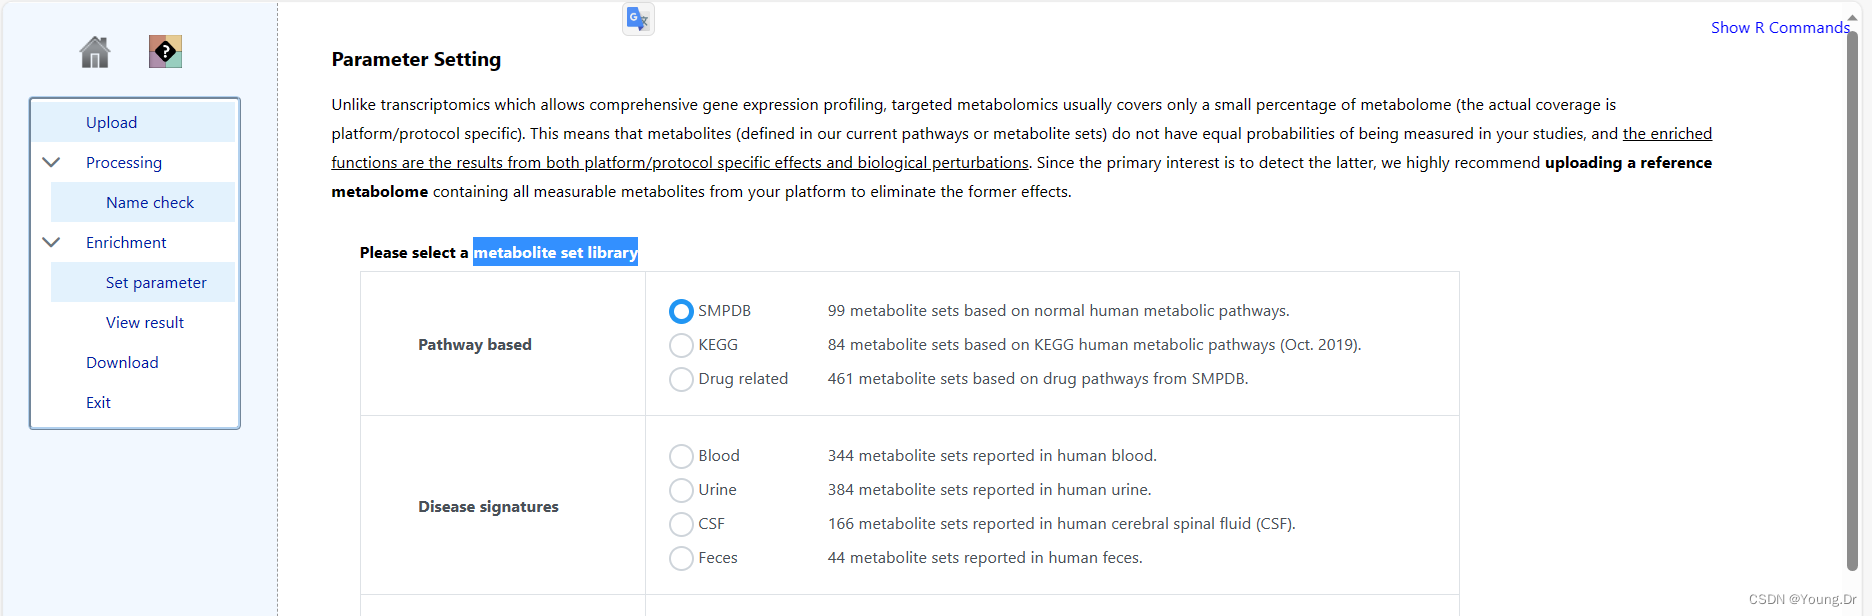
step1 enrichment 富集分析部分
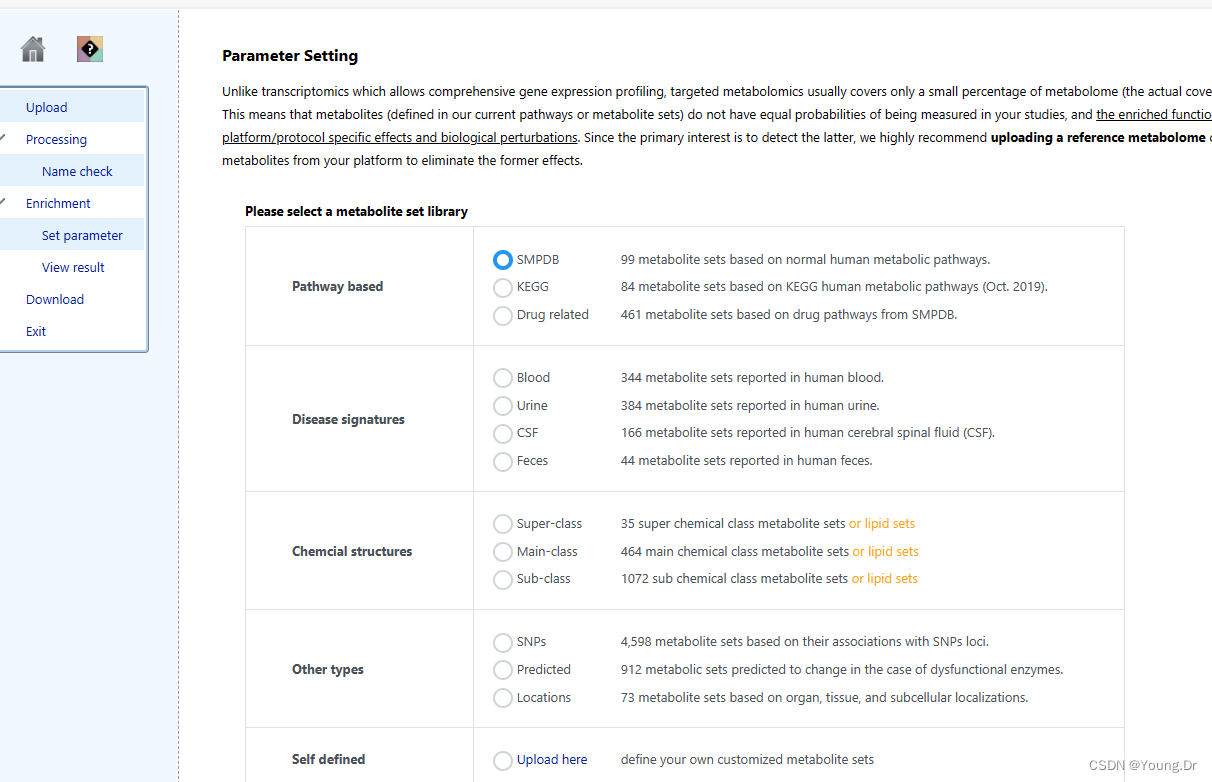
富集分析 smpd数据库
# PID of current job: 1816221
mSet<-InitDataObjects("conc", "msetora", FALSE)
cmpd.vec<-c("Acetoacetic acid","Beta-Alanine","Creatine","Dimethylglycine","Fumaric acid","Glycine","Homocysteine","L-Cysteine","L-Isolucine","L-Phenylalanine","L-Serine","L-Threonine","L-Tyrosine","L-Valine","Phenylpyruvic acid","Propionic acid","Pyruvic acid","Sarcosine")
mSet<-Setup.MapData(mSet, cmpd.vec);
mSet<-CrossReferencing(mSet, "name");
mSet<-CreateMappingResultTable(mSet)
mSet<-SetMetabolomeFilter(mSet, F);
mSet<-SetCurrentMsetLib(mSet, "smpdb_pathway", 2);
mSet<-CalculateHyperScore(mSet)
mSet<-PlotORA(mSet, "ora_0_", "net", "png", 72, width=NA)
mSet<-PlotEnrichDotPlot(mSet, "ora", "ora_dot_0_", "png", 72, width=NA)
mSet<-CalculateHyperScore(mSet)
mSet<-PlotORA(mSet, "ora_1_", "net", "png", 72, width=NA)
mSet<-PlotEnrichDotPlot(mSet, "ora", "ora_dot_1_", "png", 72, width=NA)
mSet<-SaveTransformedData(mSet)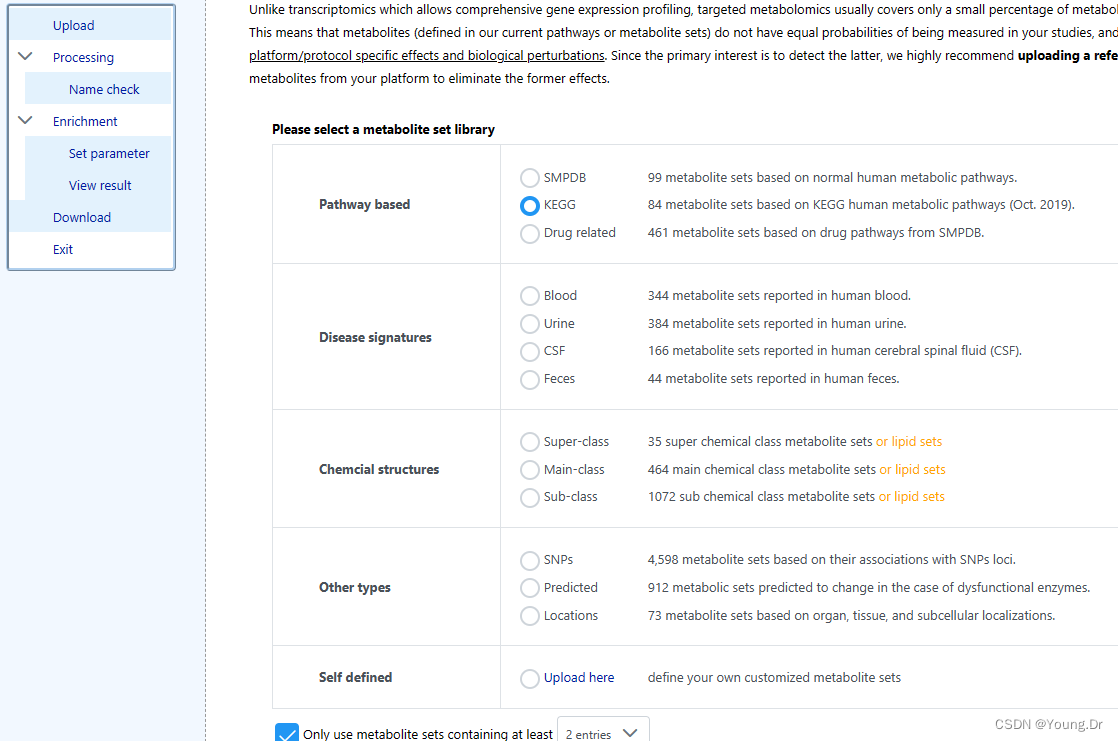
富集分析kegg数据库
# PID of current job: 1893472
mSet<-InitDataObjects("conc", "msetora", FALSE)
cmpd.vec<-c("Acetoacetic acid","Beta-Alanine","Creatine","Dimethylglycine","Fumaric acid","Glycine","Homocysteine","L-Cysteine","L-Isolucine","L-Phenylalanine","L-Serine","L-Threonine","L-Tyrosine","L-Valine","Phenylpyruvic acid","Propionic acid","Pyruvic acid","Sarcosine")
mSet<-Setup.MapData(mSet, cmpd.vec);
mSet<-CrossReferencing(mSet, "name");
mSet<-CreateMappingResultTable(mSet)
mSet<-SetMetabolomeFilter(mSet, F);
mSet<-SetCurrentMsetLib(mSet, "kegg_pathway", 2);
mSet<-CalculateHyperScore(mSet)
mSet<-PlotORA(mSet, "ora_0_", "net", "png", 72, width=NA)
mSet<-PlotEnrichDotPlot(mSet, "ora", "ora_dot_0_", "png", 72, width=NA)
mSet<-CalculateHyperScore(mSet)
mSet<-PlotORA(mSet, "ora_1_", "net", "png", 72, width=NA)
mSet<-PlotEnrichDotPlot(mSet, "ora", "ora_dot_1_", "png", 72, width=NA)
mSet<-SaveTransformedData(mSet)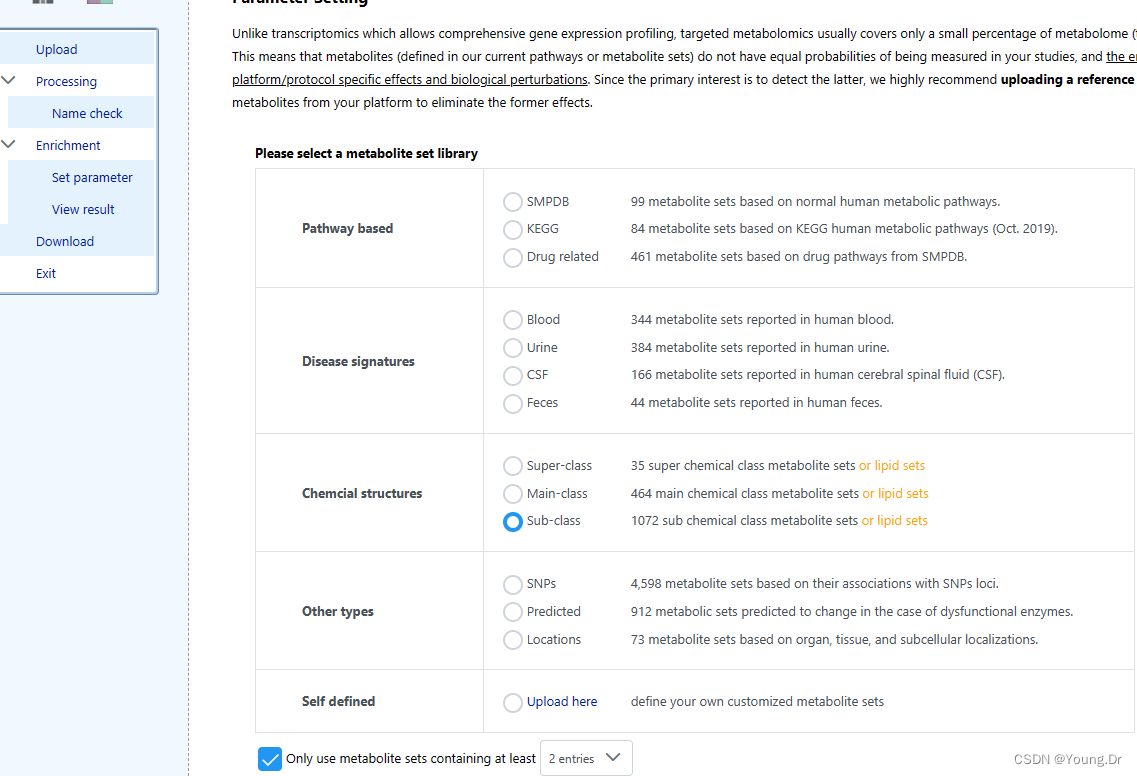
富集分析Sub-class
sub_class 注意单词的拼写
mSet<-SetCurrentMsetLib(mSet, "sub_class", 2);
mSet<-CalculateHyperScore(mSet)
mSet<-PlotORA(mSet, "ora_3_", "net", "png", 72, width=NA)
mSet<-PlotEnrichDotPlot(mSet, "ora", "ora_dot_3_", "png", 72, width=NA)
mSet<-PlotEnrichPieChart(mSet, "ora", "ora_pie_0_", "png", 72)
mSet<-CalculateHyperScore(mSet)
mSet<-PlotORA(mSet, "ora_4_", "net", "png", 72, width=NA)
mSet<-PlotEnrichDotPlot(mSet, "ora", "ora_dot_4_", "png", 72, width=NA)
mSet<-PlotEnrichPieChart(mSet, "ora", "ora_pie_1_", "png", 72)
mSet<-SaveTransformedData(mSet)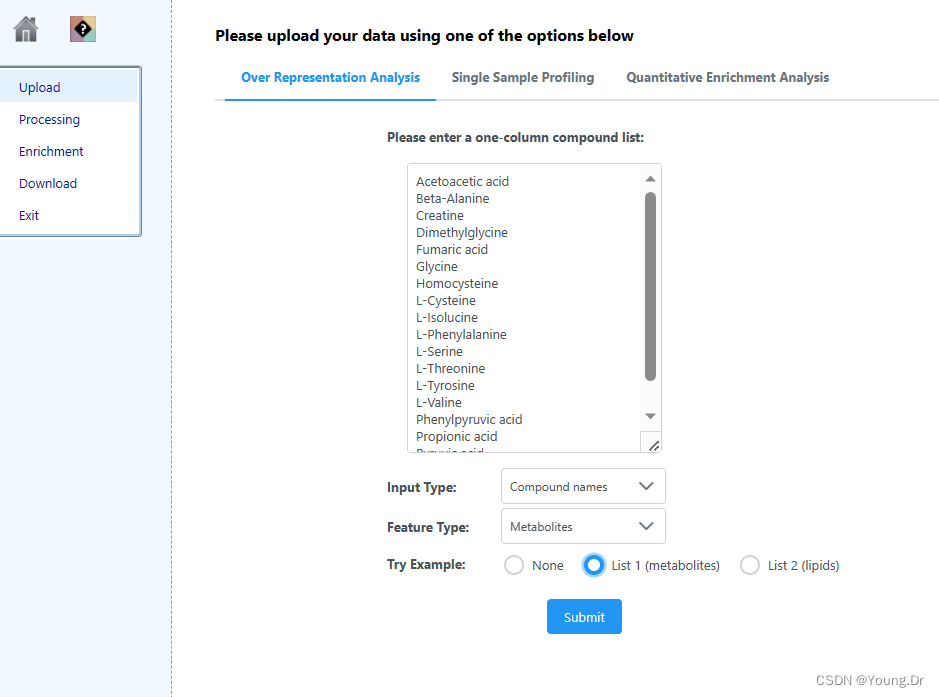
smpdb main_class
mSet<-InitDataObjects("conc", "msetora", FALSE)
cmpd.vec<-c("HMDB0001322","HMDB0005006","HMDB0013018","HMDB0033573","HMDB0037555","HMDB0038143","HMDB0043190","HMDB0044009","HMDB0045470","HMDB0251752","HMDB0257287","HMDB0257502","HMDB0257871","HMDB0263092","HMDB0280214","HMDB0290906","HMDB0291307","HMDB0293494","HMDB0293534","HMDB0293815","HMDB0001069","HMDB0004051","HMDB0008547","HMDB0012986","HMDB0015540","HMDB0015676","HMDB0033267","HMDB0033965","HMDB0035745","HMDB0036296","HMDB0038971","HMDB0039272","HMDB0042632","HMDB0055518","HMDB0056216","HMDB0061092","HMDB0115057","HMDB0116157","HMDB0247477","HMDB0247765","HMDB0248586","HMDB0248840","HMDB0249107","HMDB0249177","HMDB0249524","HMDB0249749","HMDB0250606","HMDB0252329","HMDB0252999","HMDB0253546","HMDB0254101","HMDB0254359","HMDB0254424","HMDB0256376","HMDB0257120","HMDB0257574","HMDB0258261","HMDB0260089","HMDB0281985","HMDB0294368","HMDB0303433","HMDB0303683","HMDB0304366","HMDB0029507","HMDB0244744","HMDB0252958","HMDB0252982","HMDB0253112","HMDB0256356","HMDB0257352","HMDB0000207","HMDB0031126","HMDB0035167","HMDB0035180","HMDB0035445","HMDB0036295","HMDB0038117","HMDB0040714","HMDB0060158","HMDB0241035","HMDB0244604","HMDB0248617","HMDB0250196","HMDB0250586","HMDB0251900","HMDB0252401","HMDB0252592","HMDB0254025","HMDB0258296","HMDB0277261","HMDB0303193")
mSet<-Setup.MapData(mSet, cmpd.vec);
mSet<-CrossReferencing(mSet, "hmdb");
mSet<-CreateMappingResultTable(mSet)
mSet<-PerformDetailMatch(mSet, "HMDB0037555");
mSet<-GetCandidateList(mSet);
mSet<-PerformDetailMatch(mSet, "HMDB0293815");
mSet<-GetCandidateList(mSet);
mSet<-PerformDetailMatch(mSet, "HMDB0037555");
mSet<-GetCandidateList(mSet);
mSet<-SetMetabolomeFilter(mSet, F);
mSet<-SetCurrentMsetLib(mSet, "smpdb_pathway", 2);
mSet<-CalculateHyperScore(mSet)
mSet<-SetMetabolomeFilter(mSet, F);


mSet<-SetCurrentMsetLib(mSet, "main_class", 2);

mSet<-CalculateHyperScore(mSet)
mSet<-PlotORA(mSet, "ora_1_", "net", "png", 72, width=NA)
mSet<-PlotEnrichDotPlot(mSet, "ora", "ora_dot_1_", "png", 72, width=NA)
mSet<-PlotEnrichPieChart(mSet, "ora", "ora_pie_0_", "png", 72)

mSet<-CalculateHyperScore(mSet)
mSet<-PlotORA(mSet, "ora_2_", "net", "png", 72, width=NA)
mSet<-PlotEnrichDotPlot(mSet, "ora", "ora_dot_2_", "png", 72, width=NA)
mSet<-PlotEnrichPieChart(mSet, "ora", "ora_pie_1_", "png", 72)
mSet<-SaveTransformedData(mSet)
super_class
# PID of current job: 3489344
mSet<-InitDataObjects("conc", "msetora", FALSE)
cmpd.vec<-c("Acetoacetic acid","Beta-Alanine","Creatine","Dimethylglycine","Fumaric acid","Glycine","Homocysteine","L-Cysteine","L-Isolucine","L-Phenylalanine","L-Serine","L-Threonine","L-Tyrosine","L-Valine","Phenylpyruvic acid","Propionic acid","Pyruvic acid","Sarcosine")
mSet<-Setup.MapData(mSet, cmpd.vec);
mSet<-CrossReferencing(mSet, "name");
mSet<-CreateMappingResultTable(mSet)
mSet<-SetMetabolomeFilter(mSet, F);
mSet<-SetCurrentMsetLib(mSet, "super_class", 2);
mSet<-CalculateHyperScore(mSet)
mSet<-PlotORA(mSet, "ora_0_", "net", "png", 72, width=NA)
mSet<-PlotEnrichDotPlot(mSet, "ora", "ora_dot_0_", "png", 72, width=NA)
mSet<-PlotEnrichPieChart(mSet, "ora", "ora_pie_0_", "png", 72)

mSet<-CalculateHyperScore(mSet)
mSet<-PlotORA(mSet, "ora_1_", "net", "png", 72, width=NA)
mSet<-PlotEnrichDotPlot(mSet, "ora", "ora_dot_1_", "png", 72, width=NA)
mSet<-PlotEnrichPieChart(mSet, "ora", "ora_pie_1_", "png", 72)


mSet<-SetMetabolomeFilter(mSet, F);
mSet<-SetCurrentMsetLib(mSet, "drug", 2);
mSet<-CalculateHyperScore(mSet)
mSet<-PlotORA(mSet, "ora_2_", "net", "png", 72, width=NA)
mSet<-PlotEnrichDotPlot(mSet, "ora", "ora_dot_2_", "png", 72, width=NA)
mSet<-CalculateHyperScore(mSet)
mSet<-PlotORA(mSet, "ora_3_", "net", "png", 72, width=NA)
mSet<-PlotEnrichDotPlot(mSet, "ora", "ora_dot_3_", "png", 72, width=NA)
mSet<-PrepareSifDownloads(mSet)
mSet<-SetMetabolomeFilter(mSet, F);


mSet<-SetCurrentMsetLib(mSet, "predicted", 2);
mSet<-CalculateHyperScore(mSet)
mSet<-PlotORA(mSet, "ora_4_", "net", "png", 72, width=NA)
mSet<-PlotEnrichDotPlot(mSet, "ora", "ora_dot_4_", "png", 72, width=NA)
mSet<-CalculateHyperScore(mSet)
mSet<-PlotORA(mSet, "ora_5_", "net", "png", 72, width=NA)
mSet<-PlotEnrichDotPlot(mSet, "ora", "ora_dot_5_", "png", 72, width=NA)
mSet<-SetMetabolomeFilter(mSet, F);


mSet<-SetCurrentMsetLib(mSet, "location", 2);
mSet<-CalculateHyperScore(mSet)
mSet<-PlotORA(mSet, "ora_6_", "net", "png", 72, width=NA)
mSet<-PlotEnrichDotPlot(mSet, "ora", "ora_dot_6_", "png", 72, width=NA)
mSet<-CalculateHyperScore(mSet)
mSet<-PlotORA(mSet, "ora_7_", "net", "png", 72, width=NA)
mSet<-PlotEnrichDotPlot(mSet, "ora", "ora_dot_7_", "png", 72, width=NA)
mSet<-SaveTransformedData(mSet)
#####通路分析
# PID of current job: 905071
mSet<-InitDataObjects("conc", "pathora", FALSE)
cmpd.vec<-c("ALL","HMDB0001322","HMDB0005006","HMDB0013018","HMDB0033573","HMDB0037555","HMDB0038143","HMDB0043190","HMDB0044009","HMDB0045470","HMDB0251752","HMDB0257287","HMDB0257502","HMDB0257871","HMDB0263092","HMDB0280214","HMDB0290906","HMDB0291307","HMDB0293494","HMDB0293534","HMDB0293815","HMDB0001069","HMDB0004051","HMDB0008547","HMDB0012986","HMDB0015540","HMDB0015676","HMDB0033267","HMDB0033965","HMDB0035745","HMDB0036296","HMDB0038971","HMDB0039272","HMDB0042632","HMDB0055518","HMDB0056216","HMDB0061092","HMDB0115057","HMDB0116157","HMDB0247477","HMDB0247765","HMDB0248586","HMDB0248840","HMDB0249107","HMDB0249177","HMDB0249524","HMDB0249749","HMDB0250606","HMDB0252329","HMDB0252999","HMDB0253546","HMDB0254101","HMDB0254359","HMDB0254424","HMDB0256376","HMDB0257120","HMDB0257574","HMDB0258261","HMDB0260089","HMDB0281985","HMDB0294368","HMDB0303433","HMDB0303683","HMDB0304366","HMDB0029507","HMDB0244744","HMDB0252958","HMDB0252982","HMDB0253112","HMDB0256356","HMDB0257352","HMDB0000207","HMDB0031126","HMDB0035167","HMDB0035180","HMDB0035445","HMDB0036295","HMDB0038117","HMDB0040714","HMDB0060158","HMDB0241035","HMDB0244604","HMDB0248617","HMDB0250196","HMDB0250586","HMDB0251900","HMDB0252401","HMDB0252592","HMDB0254025","HMDB0258296","HMDB0277261","HMDB0303193")
mSet<-Setup.MapData(mSet, cmpd.vec);
mSet<-CrossReferencing(mSet, "hmdb");
mSet<-CreateMappingResultTable(mSet)
mSet<-SetKEGG.PathLib(mSet, "rno", "current")
mSet<-SetMetabolomeFilter(mSet, F);
mSet<-CalculateOraScore(mSet, "rbc", "hyperg")
mSet<-PlotPathSummary(mSet, F, "path_view_0_", "png", 72, width=NA, NA, NA )
mSet<-PlotKEGGPath(mSet, "Biosynthesis of unsaturated fatty acids",576, 480, "png", NULL)
mSet<-RerenderMetPAGraph(mSet, "zoom1689756142292.png",576.0, 480.0, 100.0)
mSet<-RerenderMetPAGraph(mSet, "zoom1689756245682.png",576.0, 480.0, 100.0)
mSet<-RerenderMetPAGraph(mSet, "zoom1689756246506.png",593.0, 494.0, 102.91666666666666)
mSet<-RerenderMetPAGraph(mSet, "zoom1689756248854.png",576.0, 480.0, 100.0)
mSet<-SaveTransformedData(mSet)
# PID of current job: 781822
mSet<-InitDataObjects("conc", "pathora", FALSE)
cmpd.vec<-c("Acetoacetic acid","Beta-Alanine","Creatine","Dimethylglycine","Fumaric acid","Glycine","Homocysteine","L-Cysteine","L-Isolucine","L-Phenylalanine","L-Serine","L-Threonine","L-Tyrosine","L-Valine","Phenylpyruvic acid","Propionic acid","Pyruvic acid","Sarcosine")

mSet<-Setup.MapData(mSet, cmpd.vec);
mSet<-CrossReferencing(mSet, "name");
mSet<-CreateMappingResultTable(mSet)
mSet<-SetKEGG.PathLib(mSet, "rno", "current")
mSet<-SetMetabolomeFilter(mSet, F);
mSet<-CalculateOraScore(mSet, "rbc", "hyperg")
mSet<-PlotPathSummary(mSet, F, "path_view_0_", "png", 72, width=NA, NA, NA )

mSet<-SaveTransformedData(mSet)
mSet<-PlotKEGGPath(mSet, "Phenylalanine, tyrosine and tryptophan biosynthesis",576, 480, "png", NULL)
mSet<-RerenderMetPAGraph(mSet, "zoom1689754804669.png",576.0, 480.0, 100.0)
mSet<-PlotKEGGPath(mSet, "Phenylalanine, tyrosine and tryptophan biosynthesis",576, 480, "png", NULL)
mSet<-RerenderMetPAGraph(mSet, "zoom1689754809845.png",576.0, 480.0, 100.0)
mSet<-SaveTransformedData(mSet)
############=联合分析 --联合通路分析
metabolic pathways
# PID of current job: 3936457
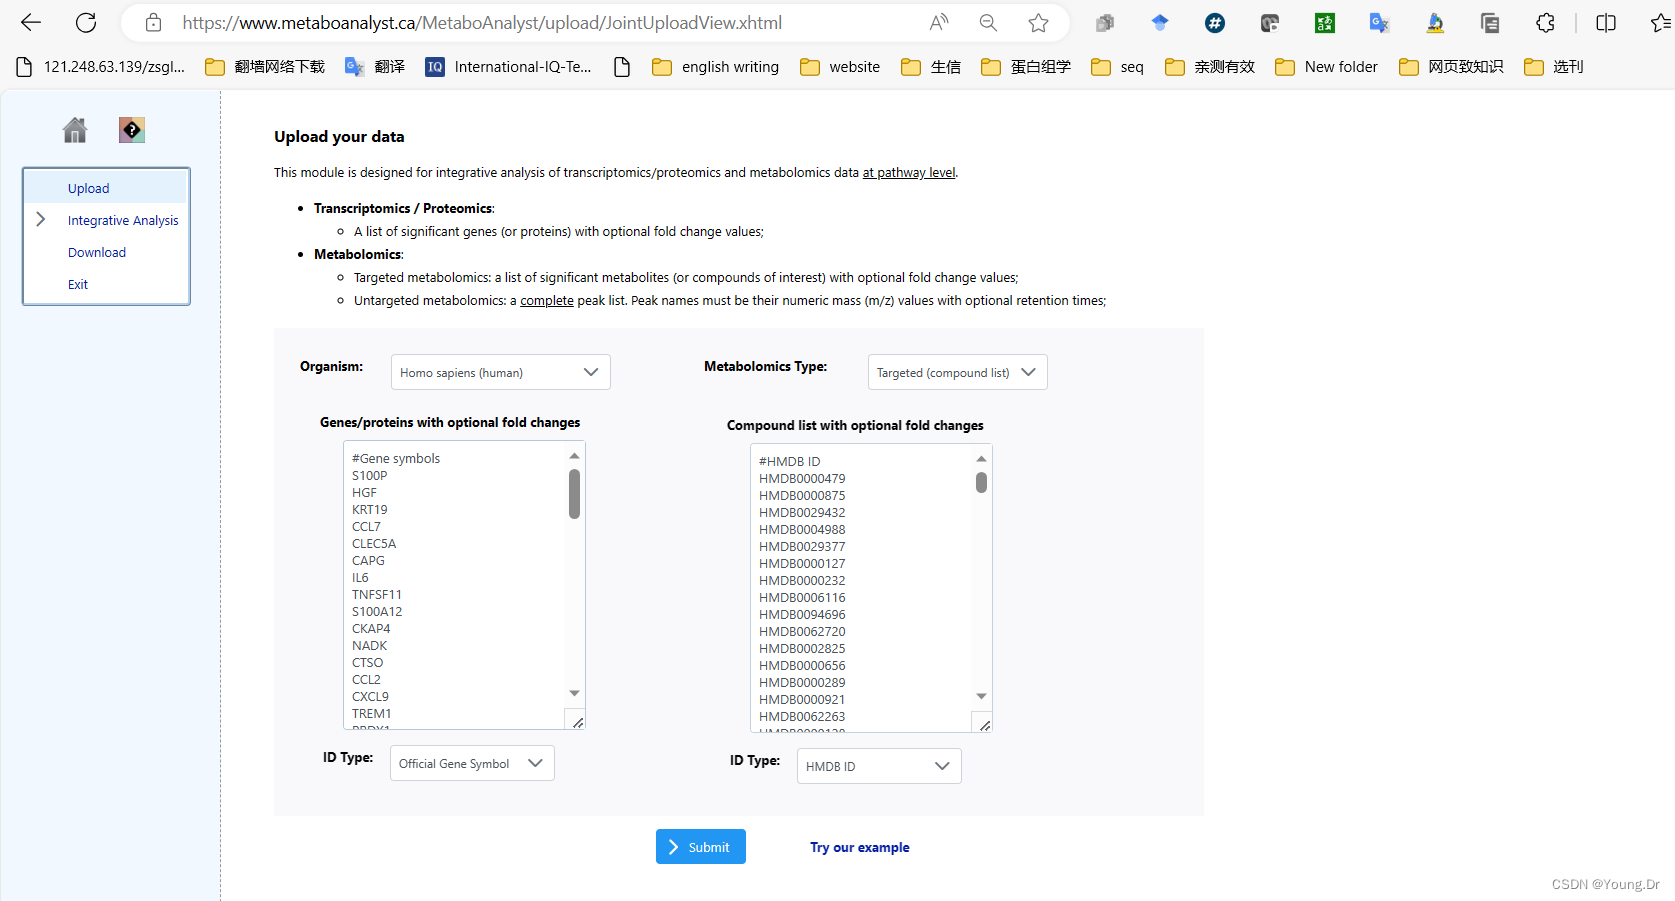
mSet<-InitDataObjects("conc", "pathinteg", FALSE)
mSet<-SetOrganism(mSet, "hsa")
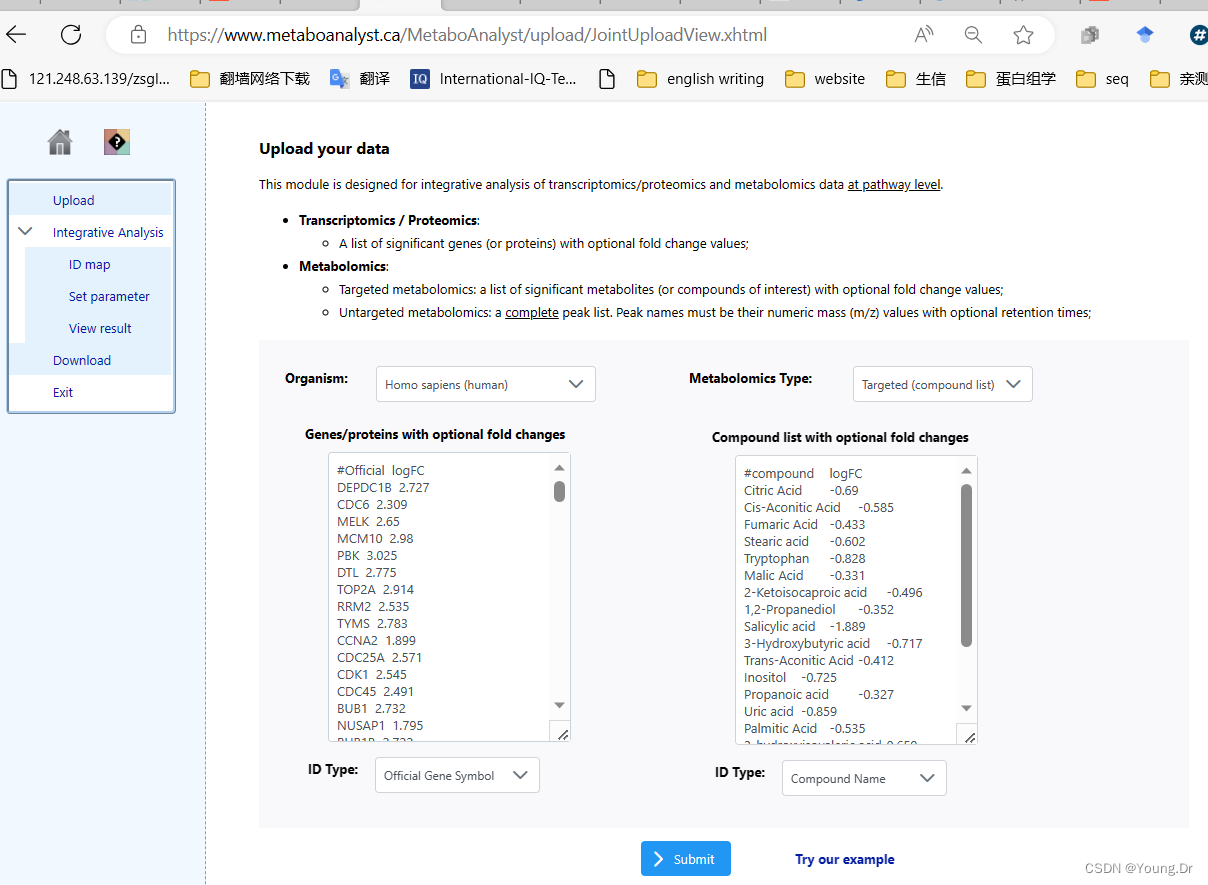
geneListFile<-"replace_with_your_file_name"
geneList<-readChar(geneListFile, file.info(geneListFile)$size)
mSet<-PerformGeneMapping(mSet, geneList, "hsa", "symbol");
cmpdListFile<-"replace_with_your_file_name"
cmpdList<-readChar(cmpdListFile, file.info(cmpdListFile)$size)
mSet<-PerformCmpdMapping(mSet, cmpdList, "hsa", "name");
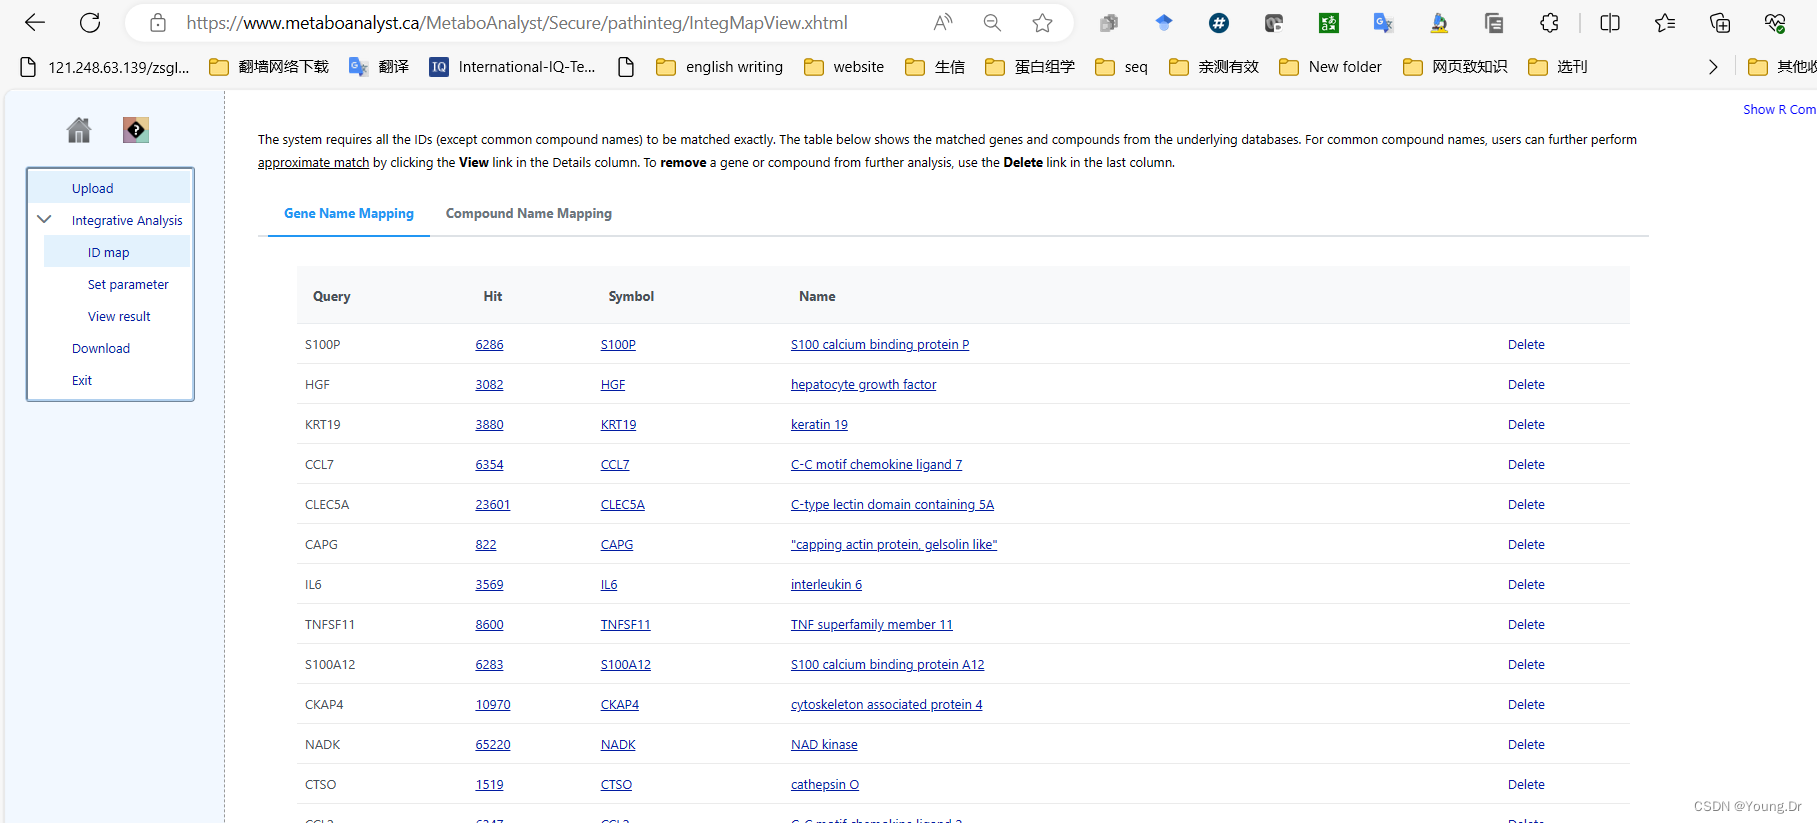
mSet<-CreateMappingResultTable(mSet)
mSet<-PrepareIntegData(mSet);
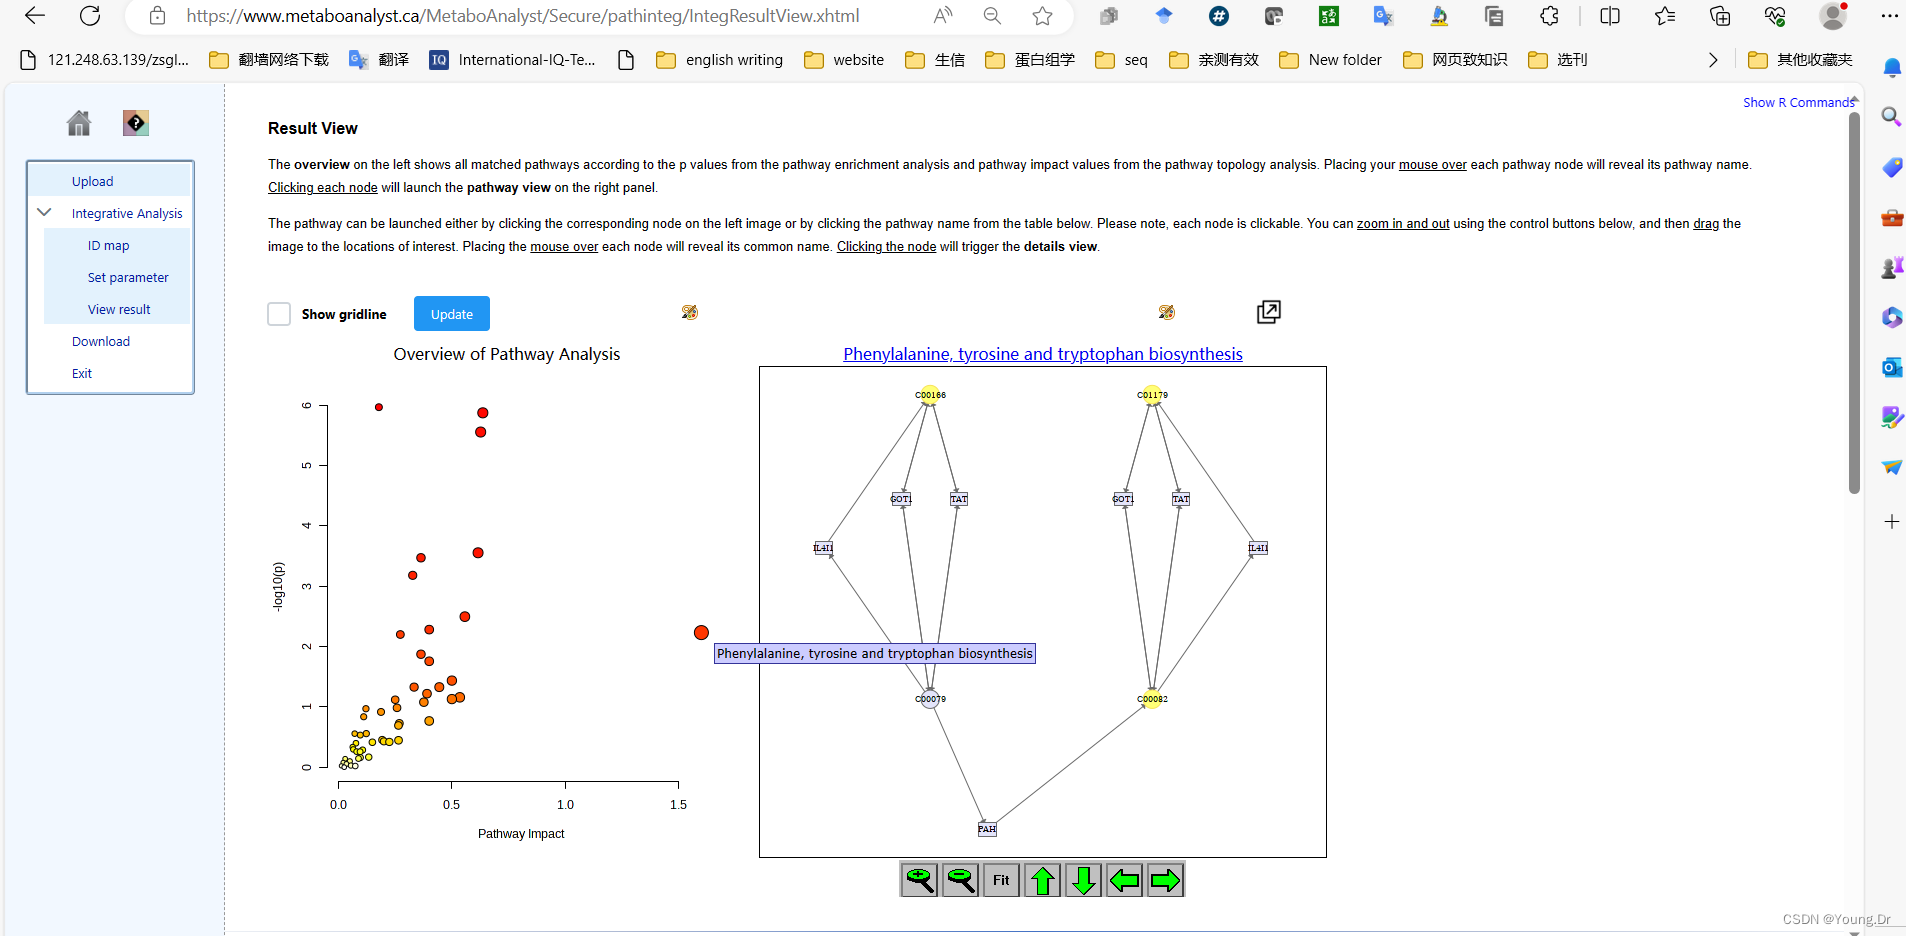
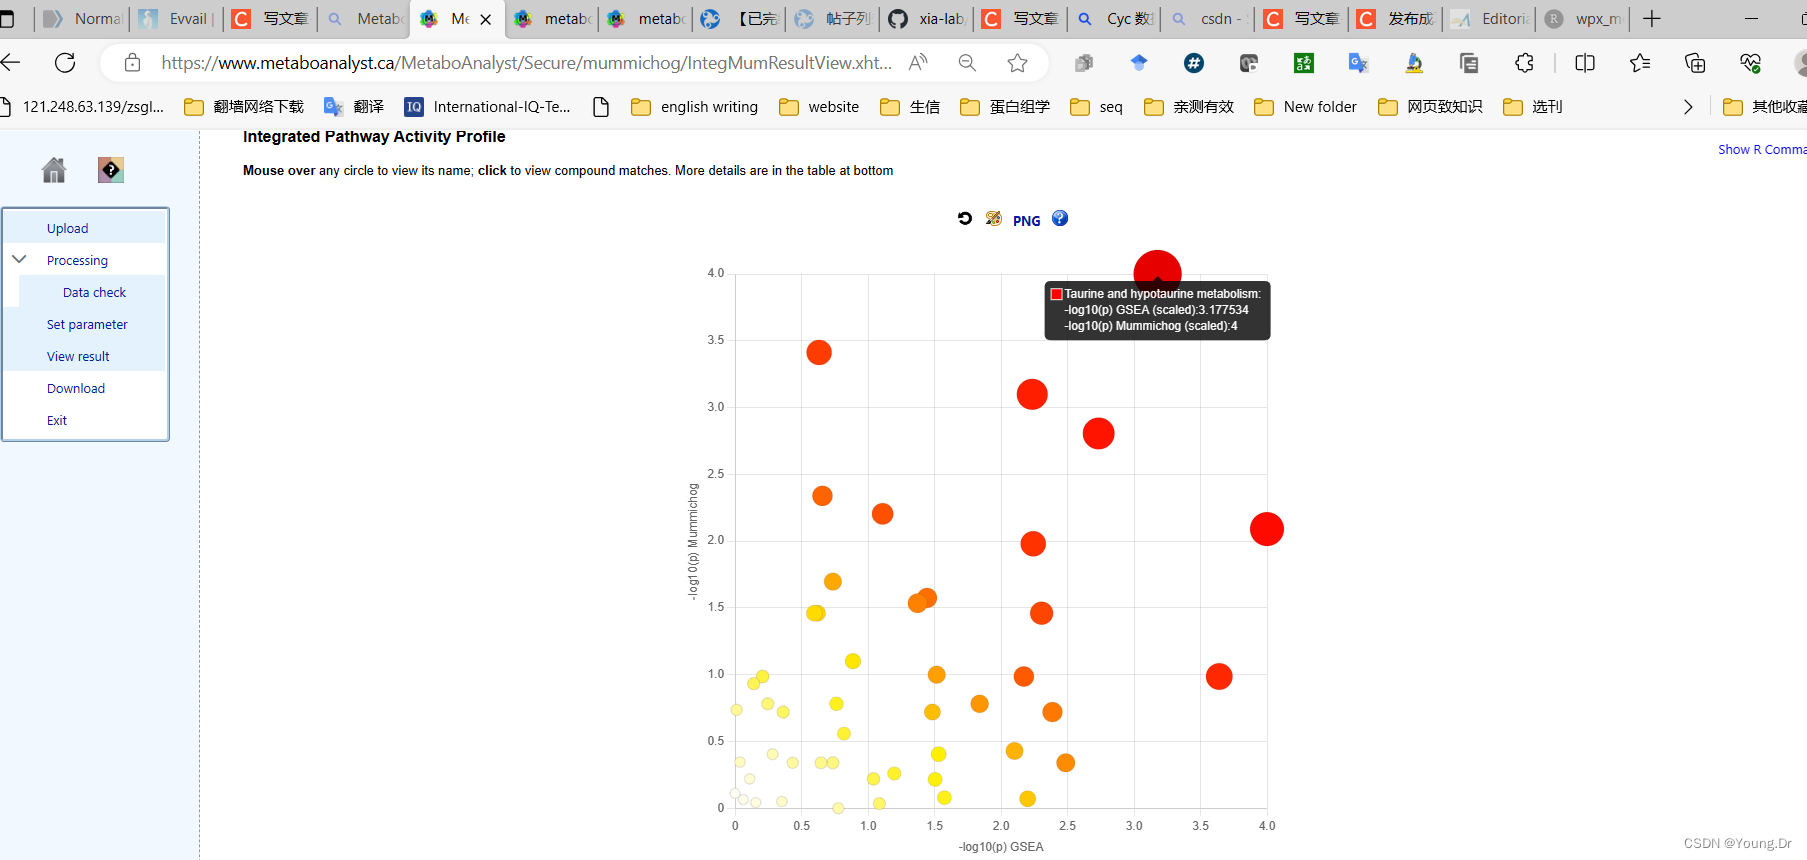
mSet<-PerformIntegPathwayAnalysis(mSet, "dc", "hyper", "integ", "query");
mSet<-PlotPathSummary(mSet, F, "path_view_0_", "png", 72, width=NA, NA, NA )
mSet<-CreateIntegMatchingTable(mSet);
mSet<-PlotKEGGPath(mSet, "Fatty acid degradation",566, 490, "png", NULL)
mSet<-RerenderMetPAGraph(mSet, "zoom1689738608119.png",566.0, 490.0, 100.0)
mSet<-PlotKEGGPath(mSet, "Fatty acid degradation",566, 490, "png", NULL)
mSet<-RerenderMetPAGraph(mSet, "zoom1689738617217.png",582.0, 504.0, 102.85714285714285)
mSet<-RerenderMetPAGraph(mSet, "zoom1689738617785.png",588.0, 509.0, 103.87755102040816)
mSet<-RerenderMetPAGraph(mSet, "zoom1689738618510.png",605.0, 524.0, 106.93877551020408)
mSet<-PlotKEGGPath(mSet, "Fatty acid degradation",NA, NA, "png", 300)
mSet<-PlotKEGGPath(mSet, "Fatty acid degradation",12, 12, "png", 300)
mSet<-SaveTransformedData(mSet)基因和代谢物联合分析
# PID of current job: 2977288
mSet<-InitDataObjects("conc", "pathinteg", FALSE)
mSet<-SetOrganism(mSet, "rno")
mSet<-SetOrganism(mSet, "rno")
geneListFile<-"replace_with_your_file_name"
geneList<-readChar(geneListFile, file.info(geneListFile)$size)
mSet<-PerformGeneMapping(mSet, geneList, "rno", "symbol");
cmpdListFile<-"replace_with_your_file_name"
cmpdList<-readChar(cmpdListFile, file.info(cmpdListFile)$size)
mSet<-PerformCmpdMapping(mSet, cmpdList, "rno", "hmdb");
mSet<-CreateMappingResultTable(mSet)
mSet<-PrepareIntegData(mSet);
mSet<-PerformIntegPathwayAnalysis(mSet, "dc", "hyper", "integ", "query");
mSet<-PlotPathSummary(mSet, F, "path_view_0_", "png", 72, width=NA, NA, NA )
mSet<-CreateIntegMatchingTable(mSet);
mSet<-PlotPathSummary(mSet, T, "path_view_1_", "png", 72, width=NA, NA, NA )
mSet<-PlotKEGGPath(mSet, "Thiamine metabolism",566, 490, "png", NULL)
mSet<-RerenderMetPAGraph(mSet, "zoom1689751276101.png",566.0, 490.0, 100.0)
mSet<-SaveTransformedData(mSet)
蛋白和代谢物联合分析
# PID of current job: 3109015
mSet<-InitDataObjects("conc", "pathinteg", FALSE)
mSet<-SetOrganism(mSet, "rno")
geneListFile<-"replace_with_your_file_name"
geneList<-readChar(geneListFile, file.info(geneListFile)$size)
mSet<-PerformGeneMapping(mSet, geneList, "rno", "uniprot");
cmpdListFile<-"replace_with_your_file_name"
cmpdList<-readChar(cmpdListFile, file.info(cmpdListFile)$size)
mSet<-PerformCmpdMapping(mSet, cmpdList, "rno", "hmdb");
mSet<-CreateMappingResultTable(mSet)
mSet<-PrepareIntegData(mSet);
mSet<-PerformIntegPathwayAnalysis(mSet, "dc", "hyper", "integ", "query");
mSet<-PlotPathSummary(mSet, F, "path_view_0_", "png", 72, width=NA, NA, NA )
mSet<-CreateIntegMatchingTable(mSet);
mSet<-PlotKEGGPath(mSet, "alpha-Linolenic acid metabolism",566, 490, "png", NULL)
mSet<-RerenderMetPAGraph(mSet, "zoom1689828045728.png",566.0, 490.0, 100.0)
mSet<-SaveTransformedData(mSet)
or all pathways.
# PID of current job: 3936457
mSet<-InitDataObjects("conc", "pathinteg", FALSE)
mSet<-SetOrganism(mSet, "hsa")
geneListFile<-"replace_with_your_file_name"
geneList<-readChar(geneListFile, file.info(geneListFile)$size)
mSet<-PerformGeneMapping(mSet, geneList, "hsa", "symbol");
cmpdListFile<-"replace_with_your_file_name"
cmpdList<-readChar(cmpdListFile, file.info(cmpdListFile)$size)
mSet<-PerformCmpdMapping(mSet, cmpdList, "hsa", "name");
mSet<-CreateMappingResultTable(mSet)
mSet<-PrepareIntegData(mSet);
mSet<-PerformIntegPathwayAnalysis(mSet, "dc", "hyper", "integ", "query");
mSet<-PlotPathSummary(mSet, F, "path_view_0_", "png", 72, width=NA, NA, NA )
mSet<-CreateIntegMatchingTable(mSet);
mSet<-PlotKEGGPath(mSet, "Fatty acid degradation",566, 490, "png", NULL)
mSet<-RerenderMetPAGraph(mSet, "zoom1689738608119.png",566.0, 490.0, 100.0)
mSet<-PlotKEGGPath(mSet, "Fatty acid degradation",566, 490, "png", NULL)
mSet<-RerenderMetPAGraph(mSet, "zoom1689738617217.png",582.0, 504.0, 102.85714285714285)
mSet<-RerenderMetPAGraph(mSet, "zoom1689738617785.png",588.0, 509.0, 103.87755102040816)
mSet<-RerenderMetPAGraph(mSet, "zoom1689738618510.png",605.0, 524.0, 106.93877551020408)
mSet<-PlotKEGGPath(mSet, "Fatty acid degradation",NA, NA, "png", 300)
mSet<-PlotKEGGPath(mSet, "Fatty acid degradation",12, 12, "png", 300)
mSet<-SaveTransformedData(mSet)
mSet<-PerformIntegPathwayAnalysis(mSet, "dc", "hyper", "all", "query");
mSet<-PlotPathSummary(mSet, F, "path_view_1_", "png", 72, width=NA, NA, NA )
mSet<-CreateIntegMatchingTable(mSet);
mSet<-PlotKEGGPath(mSet, "One carbon pool by folate",566, 490, "png", NULL)
mSet<-RerenderMetPAGraph(mSet, "zoom1689738776279.png",566.0, 490.0, 100.0)
mSet<-PlotKEGGPath(mSet, "One carbon pool by folate",566, 490, "png", NULL)
mSet<-SaveTransformedData(mSet)
# PID of current job: 164558
mSet<-InitDataObjects("conc", "msetora", FALSE)
cmpd.vec<-c("Acetoacetic acid","Beta-Alanine","Creatine","Dimethylglycine","Fumaric acid","Glycine","Homocysteine","L-Cysteine","L-Isolucine","L-Phenylalanine","L-Serine","L-Threonine","L-Tyrosine","L-Valine","Phenylpyruvic acid","Propionic acid","Pyruvic acid","Sarcosine")
mSet<-Setup.MapData(mSet, cmpd.vec);
mSet<-CrossReferencing(mSet, "name");
mSet<-CreateMappingResultTable(mSet)
mSet<-SetMetabolomeFilter(mSet, F);
mSet<-SetCurrentMsetLib(mSet, "kegg_pathway", 2);
mSet<-CalculateHyperScore(mSet)
mSet<-PlotORA(mSet, "ora_2_", "net", "png", 72, width=NA)
mSet<-PlotEnrichDotPlot(mSet, "ora", "ora_dot_2_", "png", 72, width=NA)
mSet<-CalculateHyperScore(mSet)
mSet<-PlotORA(mSet, "ora_3_", "net", "png", 72, width=NA)
mSet<-PlotEnrichDotPlot(mSet, "ora", "ora_dot_3_", "png", 72, width=NA)
mSet<-SaveTransformedData(mSet)
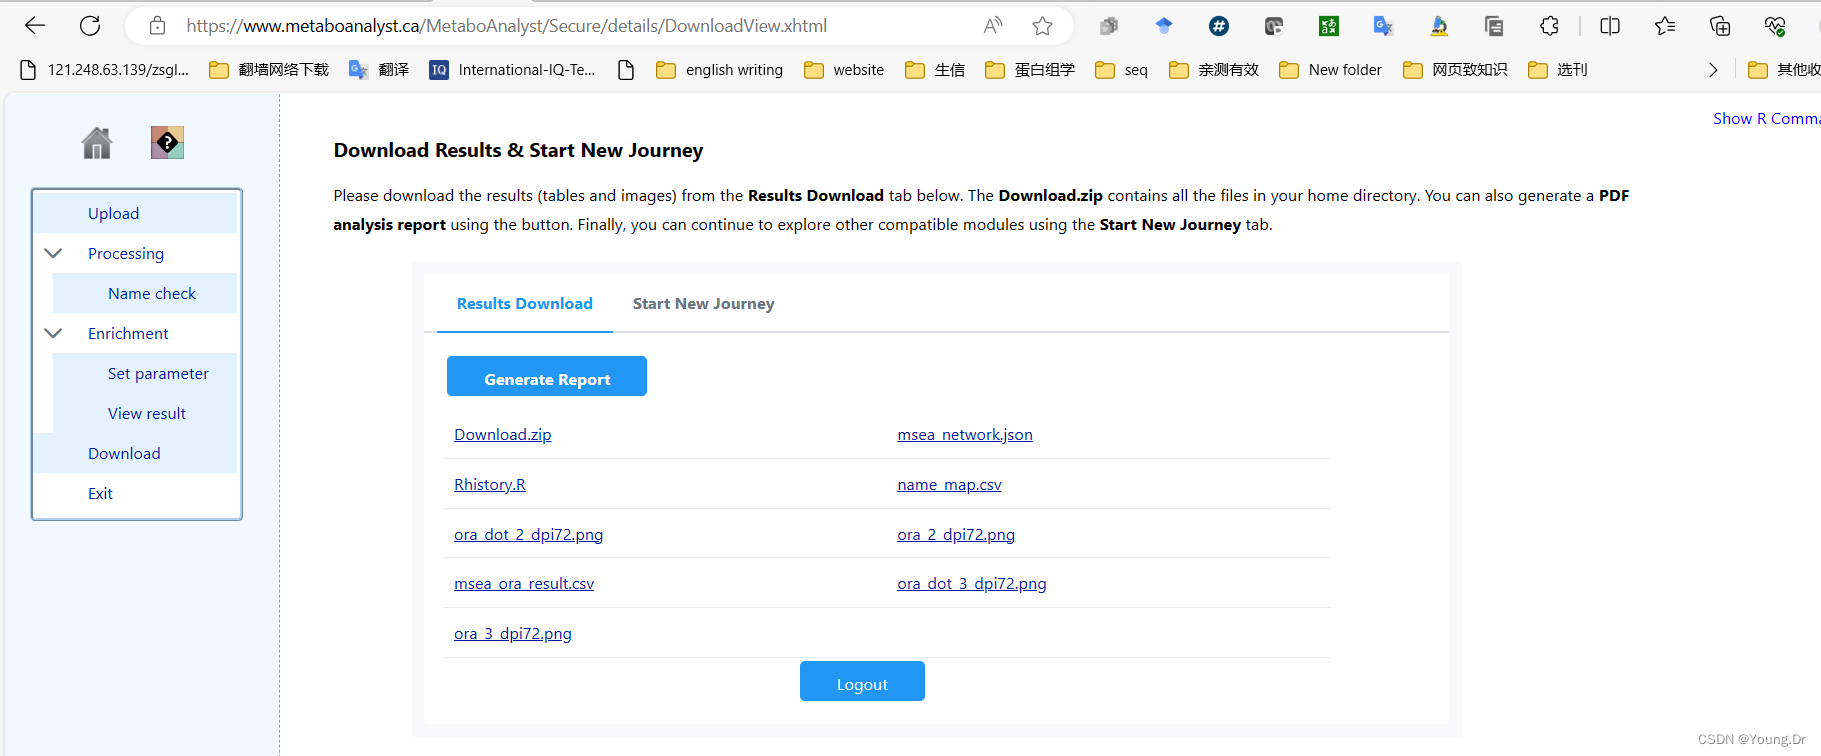
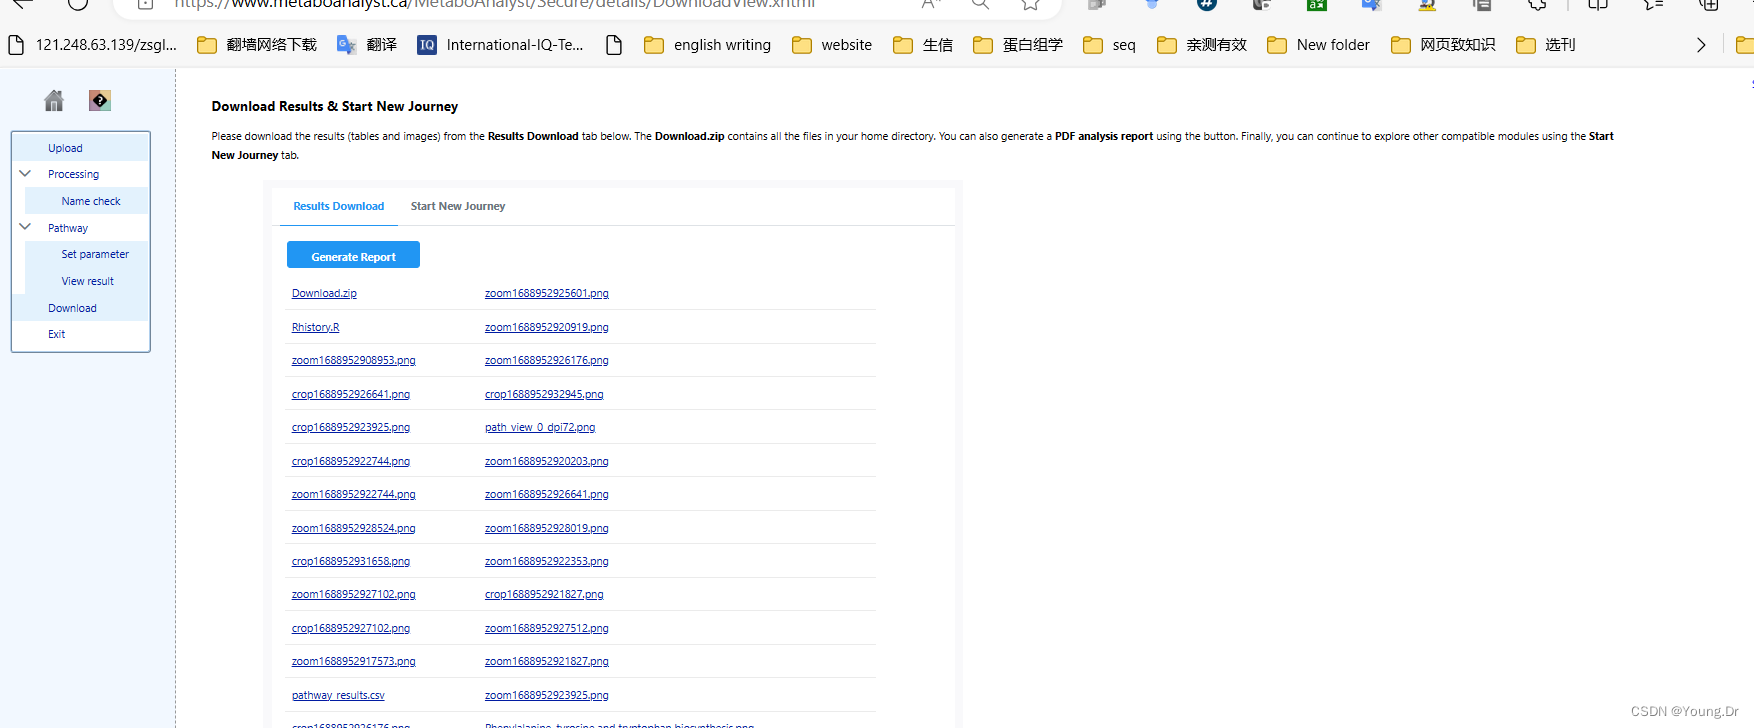
mSet<-PreparePDFReport(mSet, "guest8108257609163143447")
step2 通路富集

# PID of current job: 665556
mSet<-InitDataObjects("conc", "pathora", FALSE)
cmpd.vec<-c("Acetoacetic acid","Beta-Alanine","Creatine","Dimethylglycine","Fumaric acid","Glycine","Homocysteine","L-Cysteine","L-Isolucine","L-Phenylalanine","L-Serine","L-Threonine","L-Tyrosine","L-Valine","Phenylpyruvic acid","Propionic acid","Pyruvic acid","Sarcosine")
mSet<-Setup.MapData(mSet, cmpd.vec);
mSet<-CrossReferencing(mSet, "name");
mSet<-CreateMappingResultTable(mSet)
mSet<-SetKEGG.PathLib(mSet, "rno", "current")
mSet<-SetMetabolomeFilter(mSet, F);
mSet<-CalculateOraScore(mSet, "rbc", "hyperg")
mSet<-PlotPathSummary(mSet, F, "path_view_0_", "png", 72, width=NA, NA, NA )
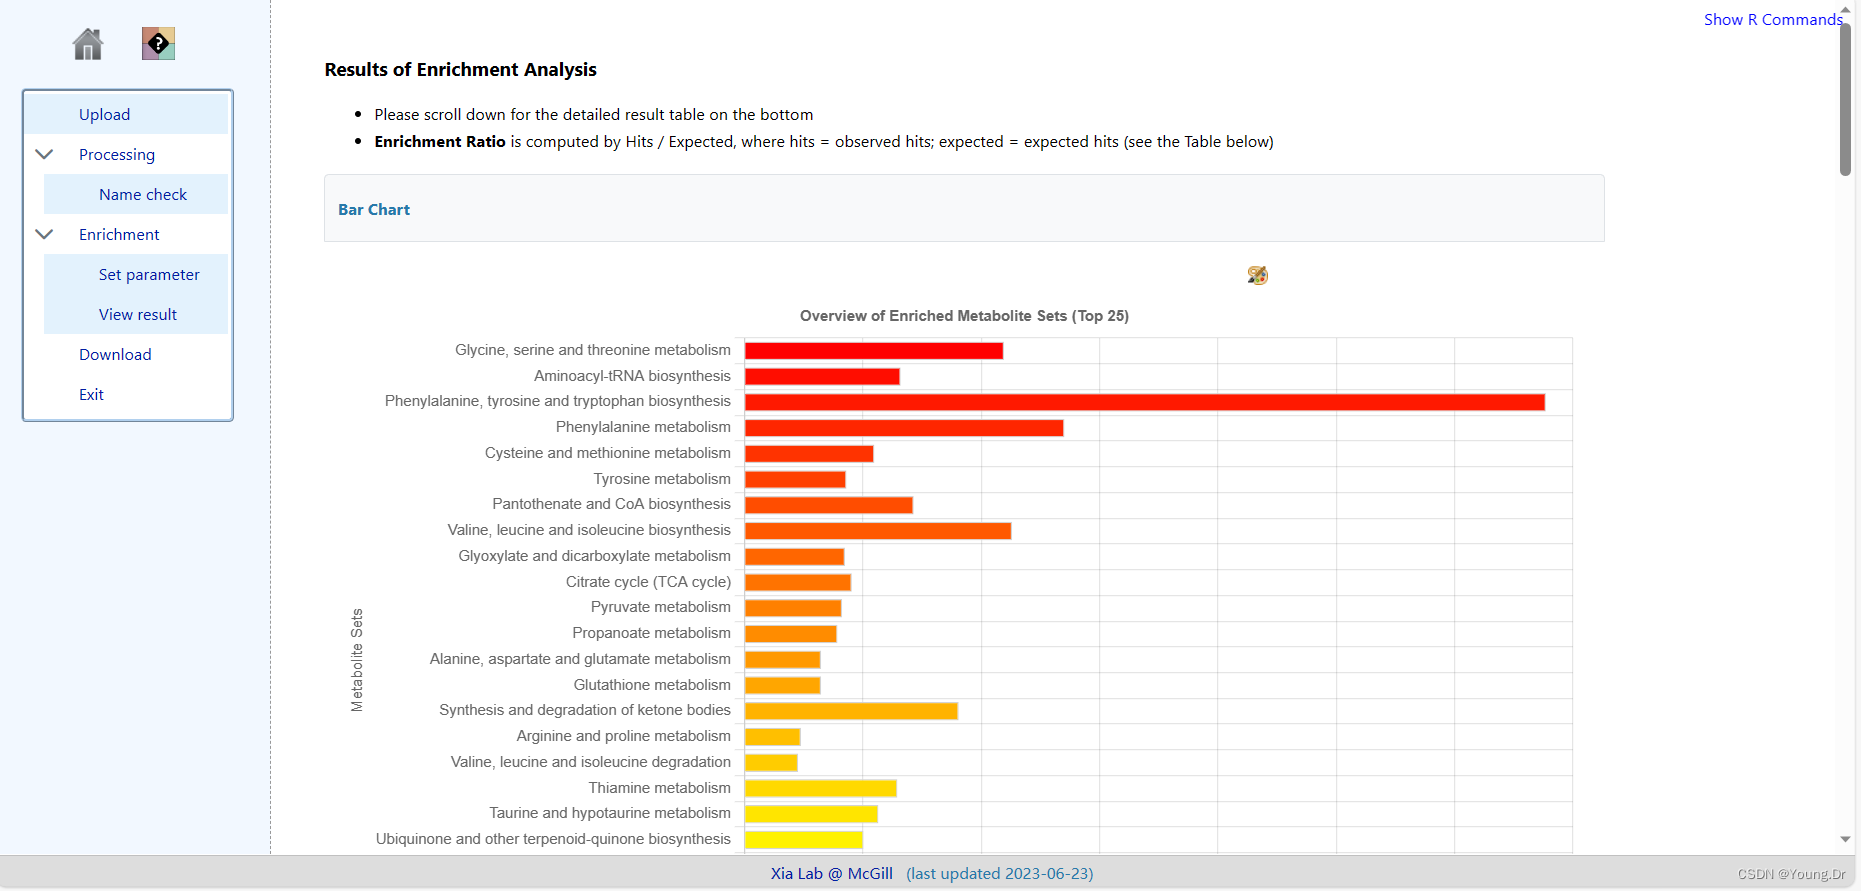
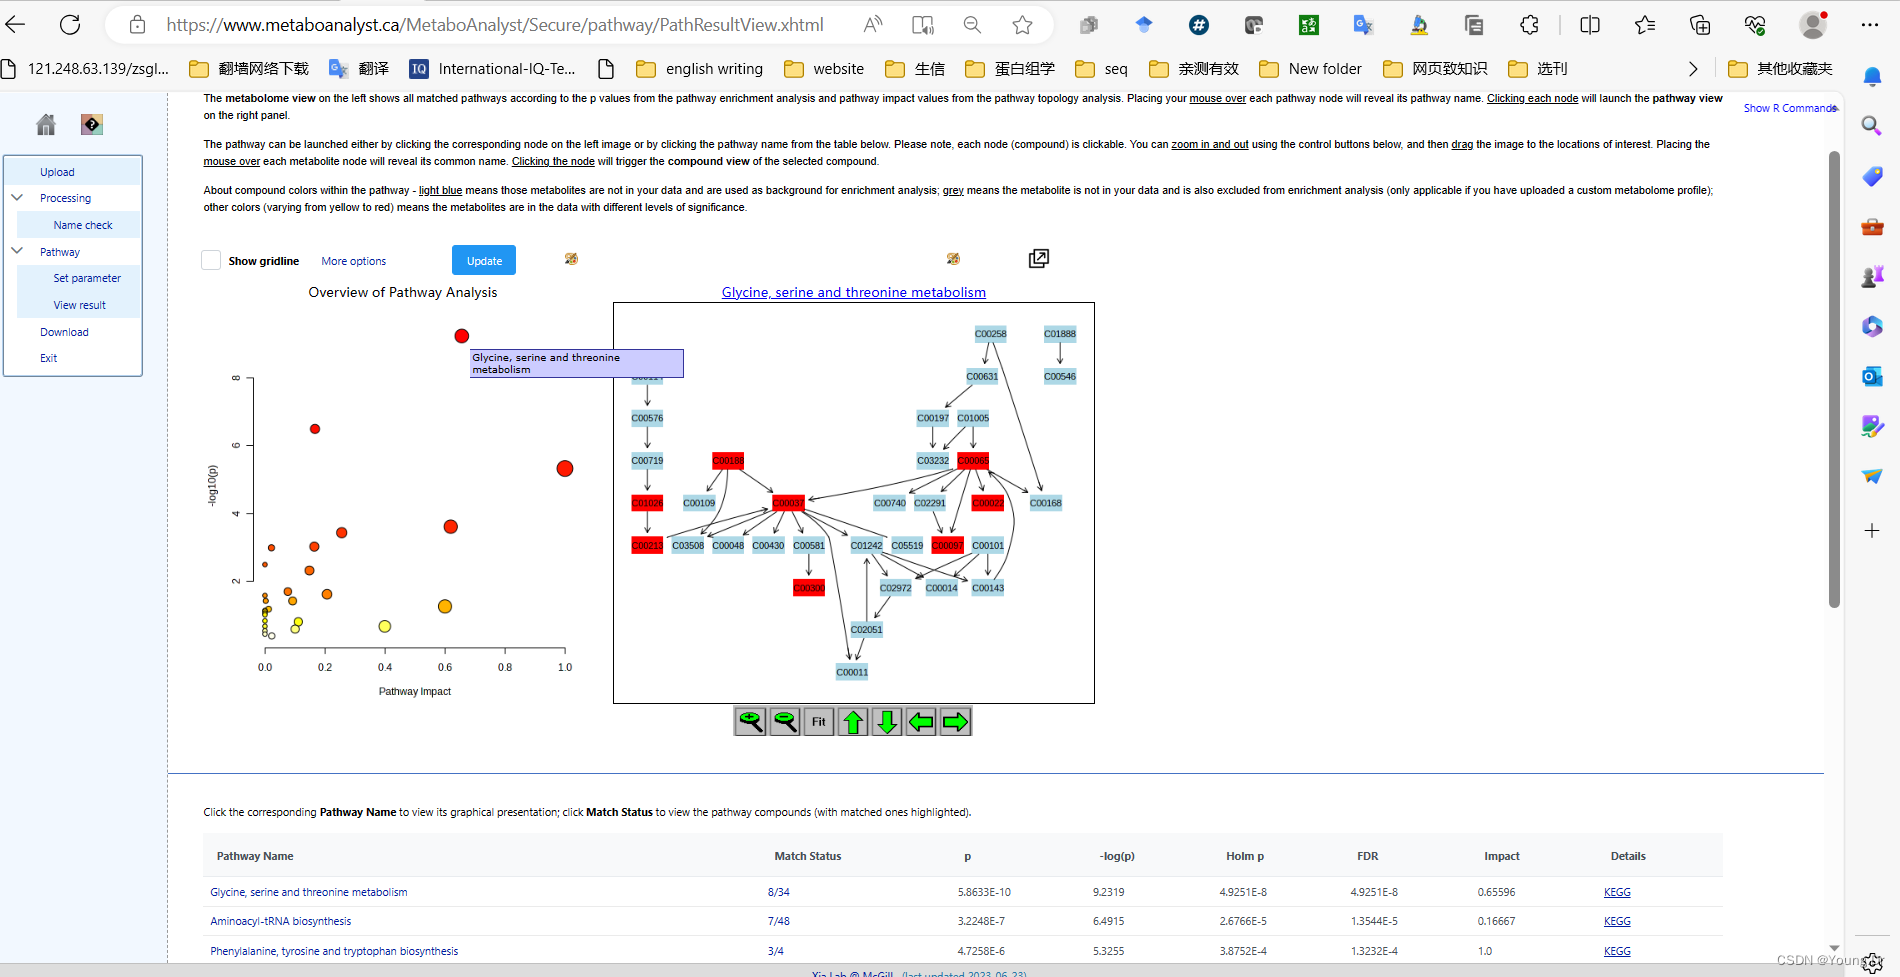
mSet<-PlotKEGGPath(mSet, "Glycine, serine and threonine metabolism",576, 480, "png", NULL)
mSet<-RerenderMetPAGraph(mSet, "zoom1688953688357.png",576.0, 480.0, 100.0)# PID of current job: 325220
mSet<-InitDataObjects("conc", "pathora", FALSE)
cmpd.vec<-c("Acetoacetic acid","Beta-Alanine","Creatine","Dimethylglycine","Fumaric acid","Glycine","Homocysteine","L-Cysteine","L-Isolucine","L-Phenylalanine","L-Serine","L-Threonine","L-Tyrosine","L-Valine","Phenylpyruvic acid","Propionic acid","Pyruvic acid","Sarcosine")
mSet<-Setup.MapData(mSet, cmpd.vec);
mSet<-CrossReferencing(mSet, "name");
mSet<-CreateMappingResultTable(mSet)
mSet<-SetKEGG.PathLib(mSet, "rno", "current")
mSet<-SetMetabolomeFilter(mSet, F);
mSet<-CalculateOraScore(mSet, "rbc", "hyperg")
mSet<-PlotPathSummary(mSet, F, "path_view_0_", "png", 72, width=NA, NA, NA )
mSet<-PlotKEGGPath(mSet, "Glycine, serine and threonine metabolism",576, 480, "png", NULL)
mSet<-RerenderMetPAGraph(mSet, "zoom1688952908953.png",576.0, 480.0, 100.0)
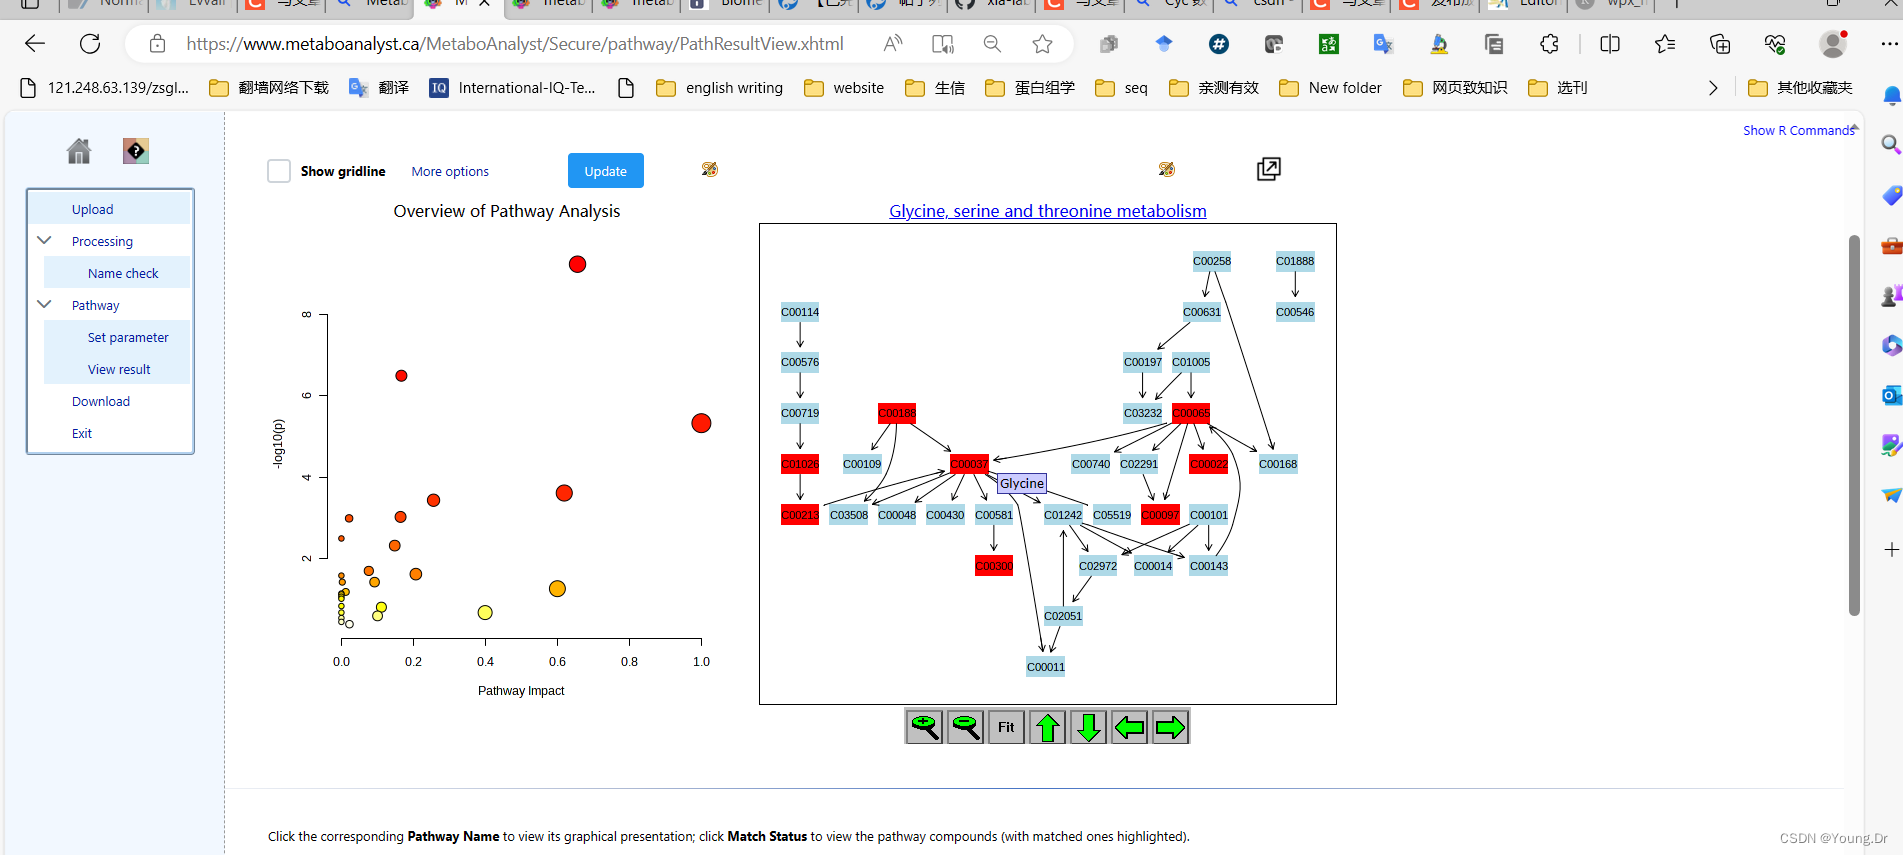
mSet<-PlotKEGGPath(mSet, "Phenylalanine, tyrosine and tryptophan biosynthesis",576, 480, "png", NULL)
mSet<-PlotKEGGPath(mSet, "Phenylalanine, tyrosine and tryptophan biosynthesis",576, 480, "png", NULL)
mSet<-RerenderMetPAGraph(mSet, "zoom1688952917573.png",576.0, 480.0, 100.0)
mSet<-RerenderMetPAGraph(mSet, "zoom1688952920203.png",593.0, 494.0, 102.91666666666666)
mSet<-RerenderMetPAGraph(mSet, "zoom1688952920919.png",610.0, 508.0, 105.83333333333333)
mSet<-RerenderMetPAGraph(mSet, "zoom1688952921827.png",593.0, 494.0, 102.91666666666666)
mSet<-RerenderMetPAGraph(mSet, "zoom1688952922353.png",587.0, 489.0, 101.875)
mSet<-RerenderMetPAGraph(mSet, "zoom1688952922744.png",587.0, 489.0, 101.875)
mSet<-RerenderMetPAGraph(mSet, "zoom1688952923406.png",605.0, 504.0, 105.0)
mSet<-RerenderMetPAGraph(mSet, "zoom1688952923925.png",622.0, 518.0, 107.91666666666666)
mSet<-RerenderMetPAGraph(mSet, "zoom1688952925601.png",656.0, 547.0, 113.95833333333334)
mSet<-RerenderMetPAGraph(mSet, "zoom1688952926176.png",673.0, 561.0, 116.875)
mSet<-RerenderMetPAGraph(mSet, "zoom1688952926641.png",679.0, 566.0, 117.91666666666667)
mSet<-RerenderMetPAGraph(mSet, "zoom1688952927102.png",673.0, 561.0, 116.875)
mSet<-RerenderMetPAGraph(mSet, "zoom1688952927512.png",667.0, 556.0, 115.83333333333334)
mSet<-RerenderMetPAGraph(mSet, "zoom1688952928019.png",667.0, 556.0, 115.83333333333334)
mSet<-RerenderMetPAGraph(mSet, "zoom1688952928524.png",667.0, 556.0, 115.83333333333334)
mSet<-RerenderMetPAGraph(mSet, "zoom1688952929928.png",576.0, 480.0, 100.0)
mSet<-RerenderMetPAGraph(mSet, "zoom1688952931658.png",576.0, 480.0, 100.0)
mSet<-RerenderMetPAGraph(mSet, "zoom1688952932945.png",576.0, 480.0, 100.0)
mSet<-PlotKEGGPath(mSet, "Phenylalanine, tyrosine and tryptophan biosynthesis",576, 480, "png", NULL)
mSet<-PlotKEGGPath(mSet, "Glycine, serine and threonine metabolism",576, 480, "png", NULL)
mSet<-SaveTransformedData(mSet)step3 联合分析
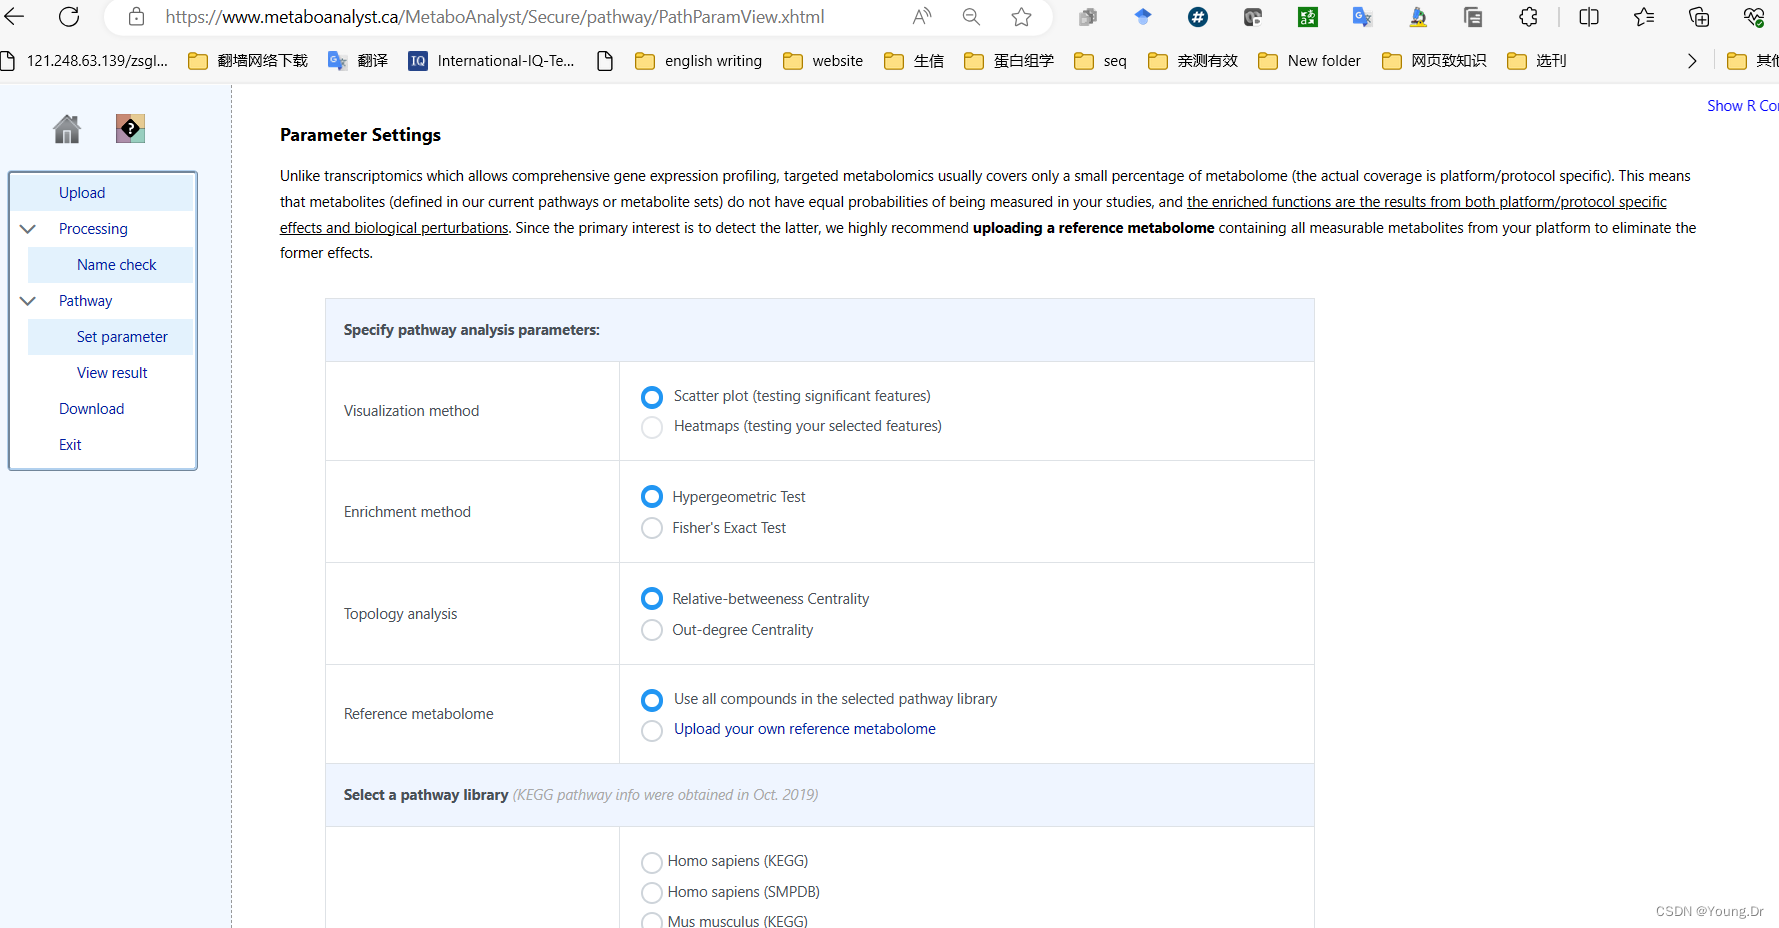
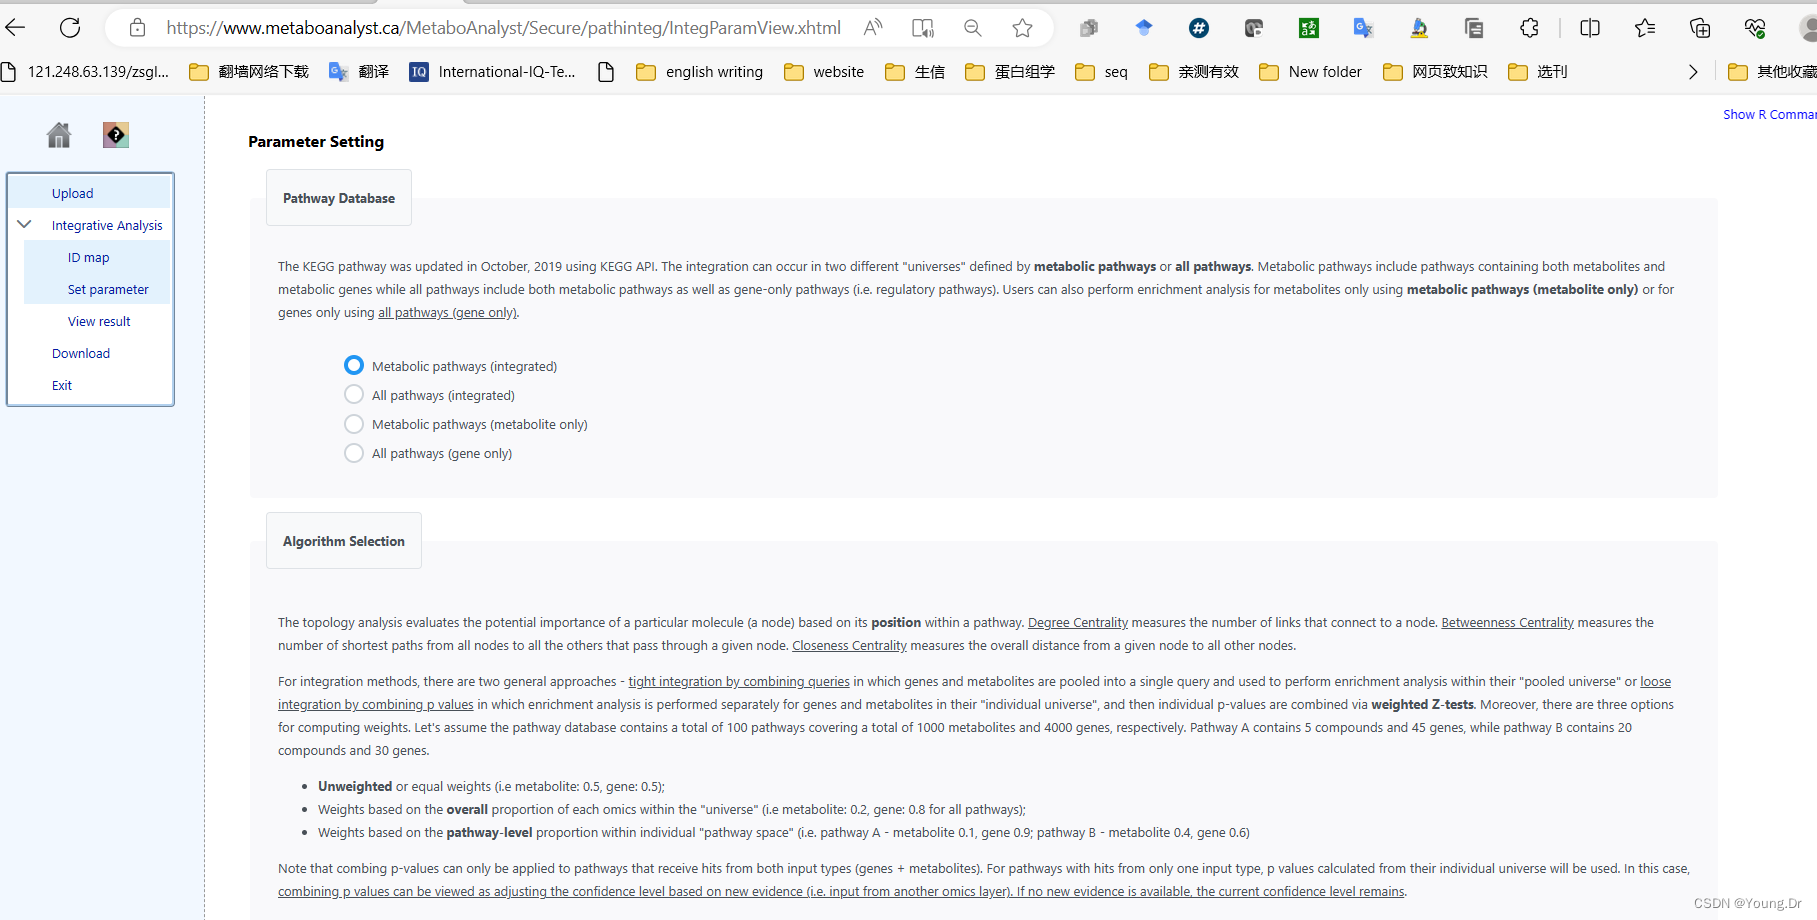
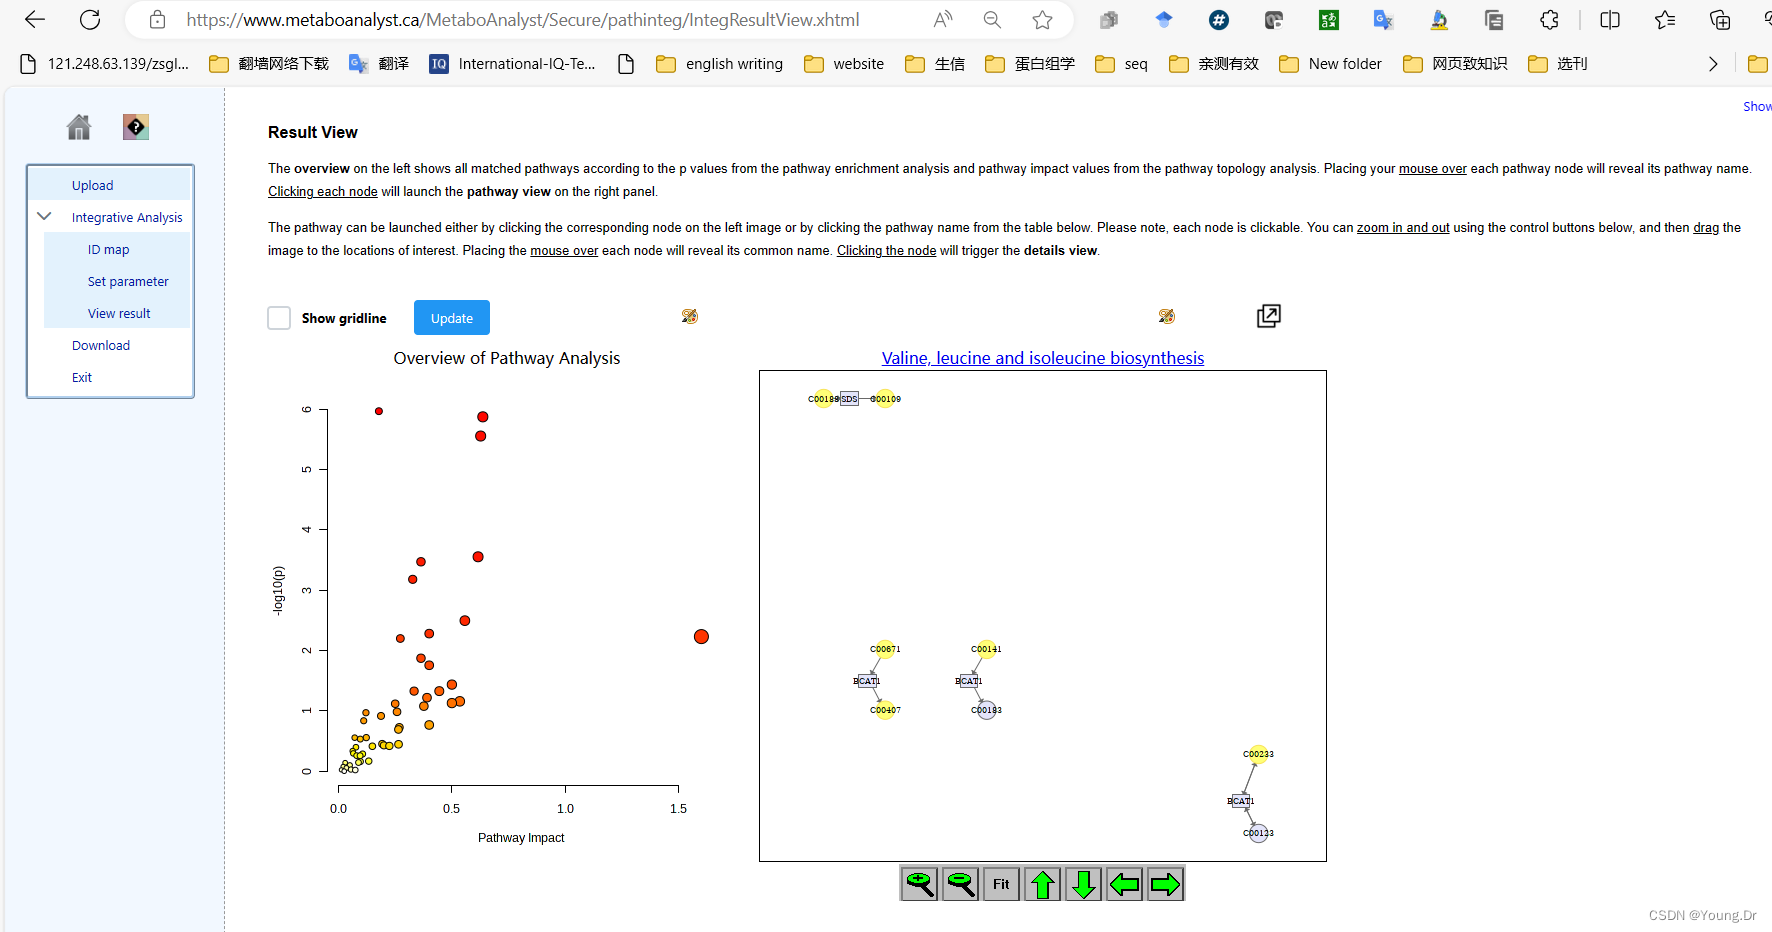
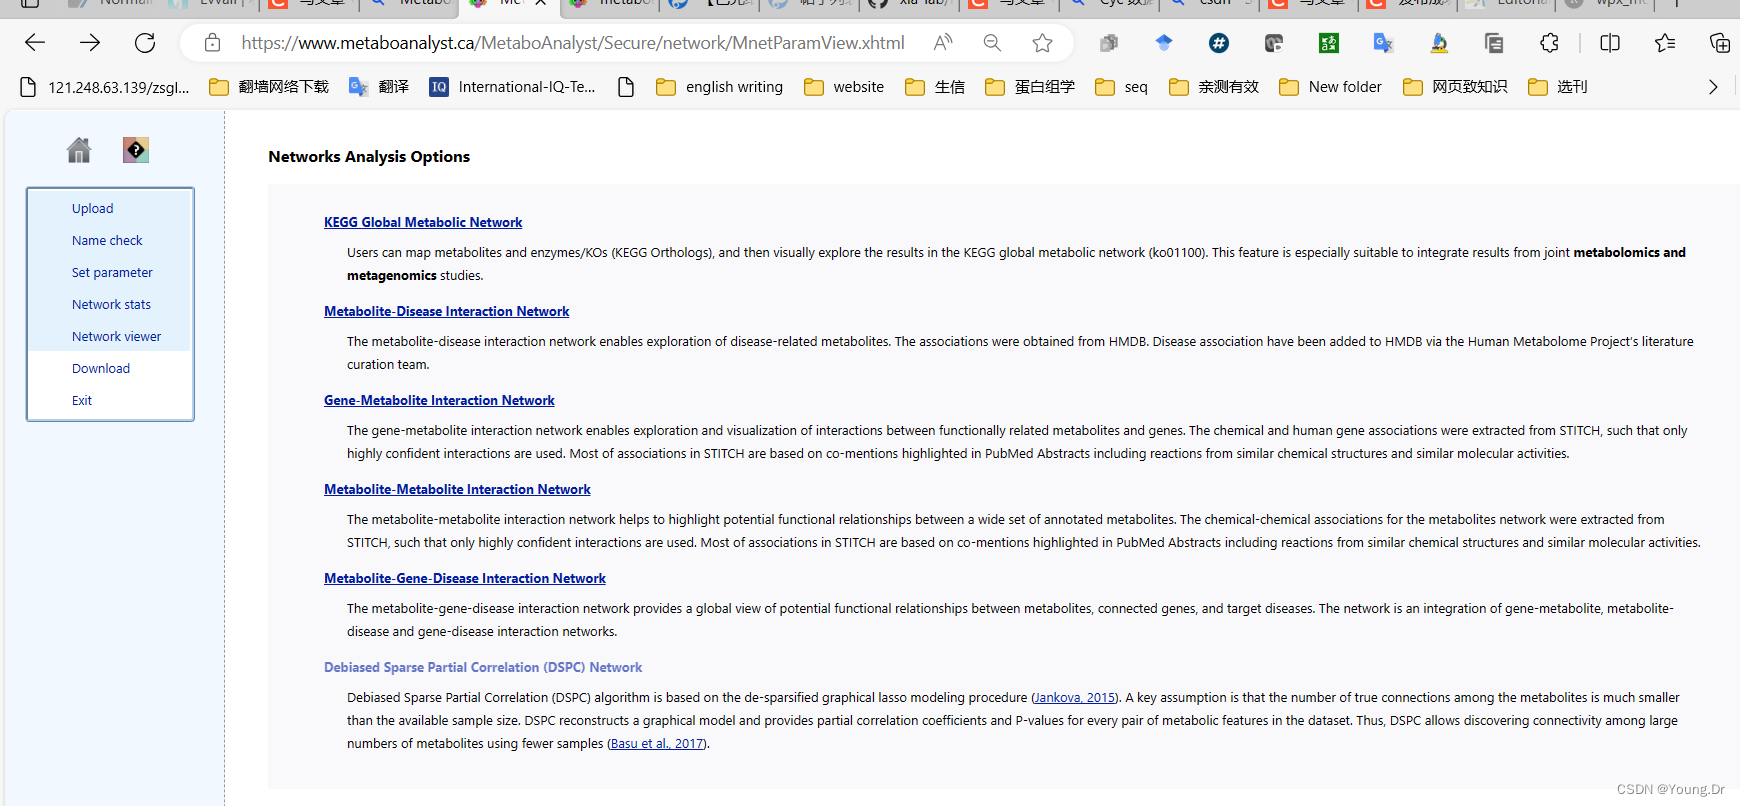
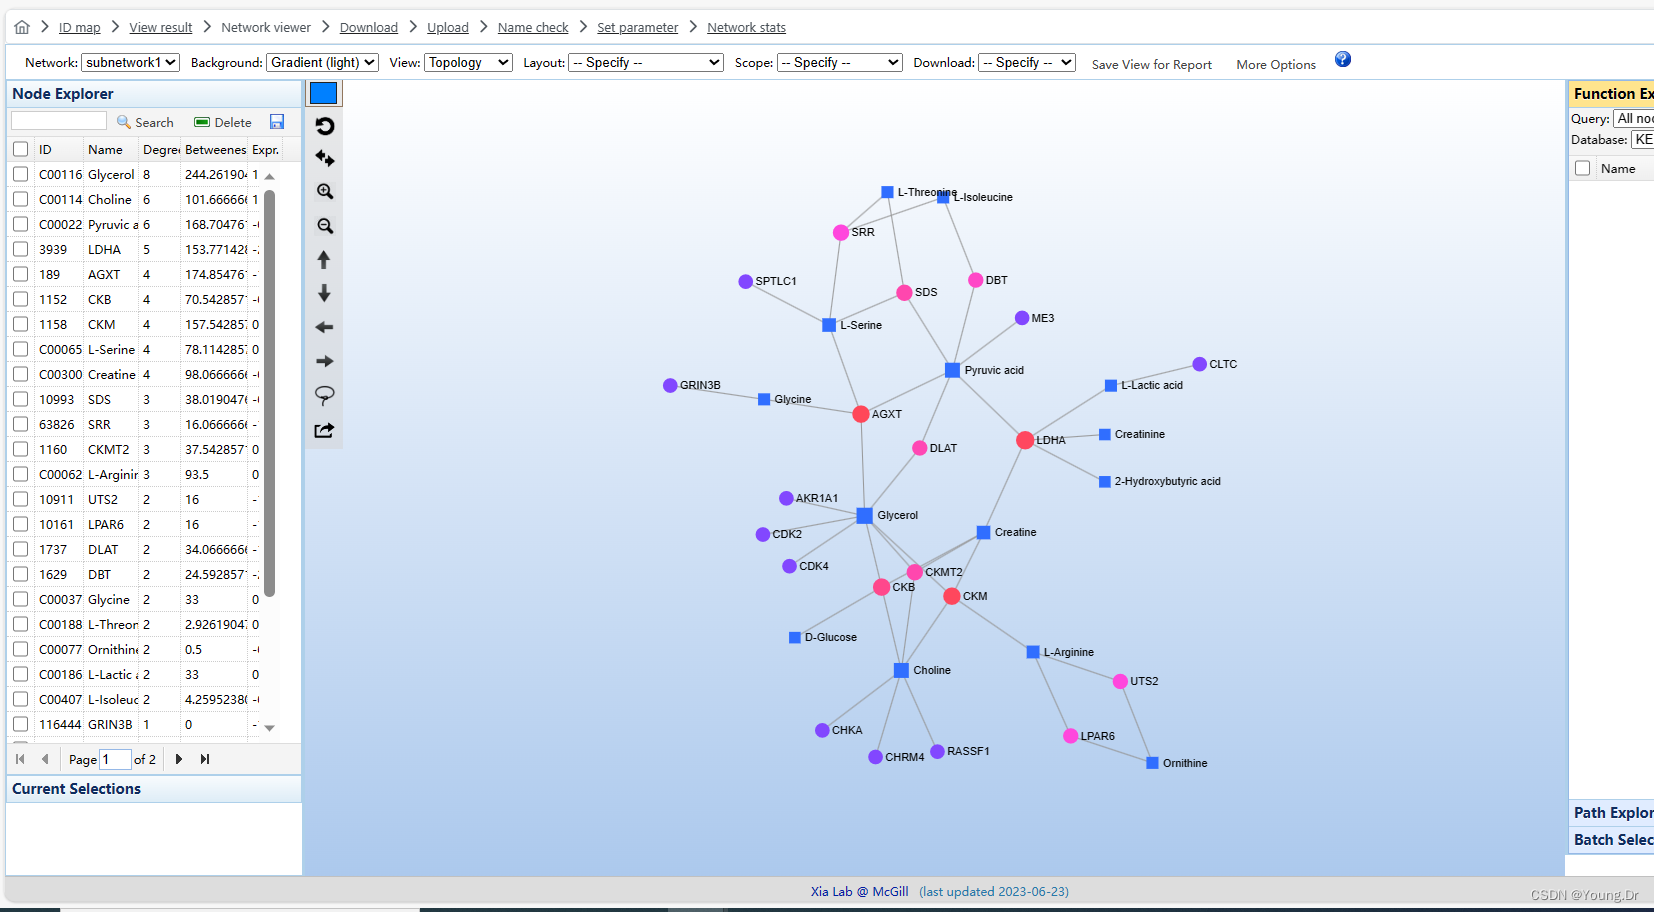
Algeria selectionThe topology analysis evaluates the potential importance of a particular molecule (a node) based on its position within a pathway. Degree Centrality measures the number of links that connect to a node. Betweenness Centrality measures the number of shortest paths from all nodes to all the others that pass through a given node. Closeness Centrality measures the overall distance from a given node to all other nodes. For integration methods, there are two general approaches - tight integration by combining queries in which genes and metabolites are pooled into a single query and used to perform enrichment analysis within their "pooled universe" or loose integration by combining p values in which enrichment analysis is performed separately for genes and metabolites in their "individual universe", and then individual p-values are combined via weighted Z-tests. Moreover, there are three options for computing weights. Let's assume the pathway database contains a total of 100 pathways covering a total of 1000 metabolites and 4000 genes, respectively. Pathway A contains 5 compounds and 45 genes, while pathway B contains 20 compounds and 30 genes.
|

# PID of current job: 731548
mSet<-InitDataObjects("conc", "pathinteg", FALSE)
mSet<-SetOrganism(mSet, "rno")
mSet<-SetOrganism(mSet, "hsa")
geneListFile<-"replace_with_your_file_name"
geneList<-readChar(geneListFile, file.info(geneListFile)$size)
mSet<-PerformGeneMapping(mSet, geneList, "hsa", "symbol");
cmpdListFile<-"replace_with_your_file_name"
cmpdList<-readChar(cmpdListFile, file.info(cmpdListFile)$size)
mSet<-PerformCmpdMapping(mSet, cmpdList, "hsa", "hmdb");
mSet<-CreateMappingResultTable(mSet)
mSet<-PrepareIntegData(mSet);
mSet<-PerformIntegPathwayAnalysis(mSet, "dc", "hyper", "integ", "query");
mSet<-PlotPathSummary(mSet, F, "path_view_0_", "png", 72, width=NA, NA, NA )
mSet<-CreateIntegMatchingTable(mSet);
mSet<-PlotKEGGPath(mSet, "Phenylalanine, tyrosine and tryptophan biosynthesis",566, 490, "png", NULL)
mSet<-RerenderMetPAGraph(mSet, "zoom1688954289011.png",566.0, 490.0, 100.0)
mSet<-RerenderMetPAGraph(mSet, "zoom1688954299369.png",566.0, 490.0, 100.0)
mSet<-PlotKEGGPath(mSet, "Phenylalanine, tyrosine and tryptophan biosynthesis",566, 490, "png", NULL)
Prepare4TarIntegNetwork(mSetObj)
mSet<-PerformIntegPathwayAnalysis(mSet, "dc", "hyper", "integ", "query");
mSet<-PlotPathSummary(mSet, F, "path_view_1_", "png", 72, width=NA, NA, NA )
mSet<-CreateIntegMatchingTable(mSet);
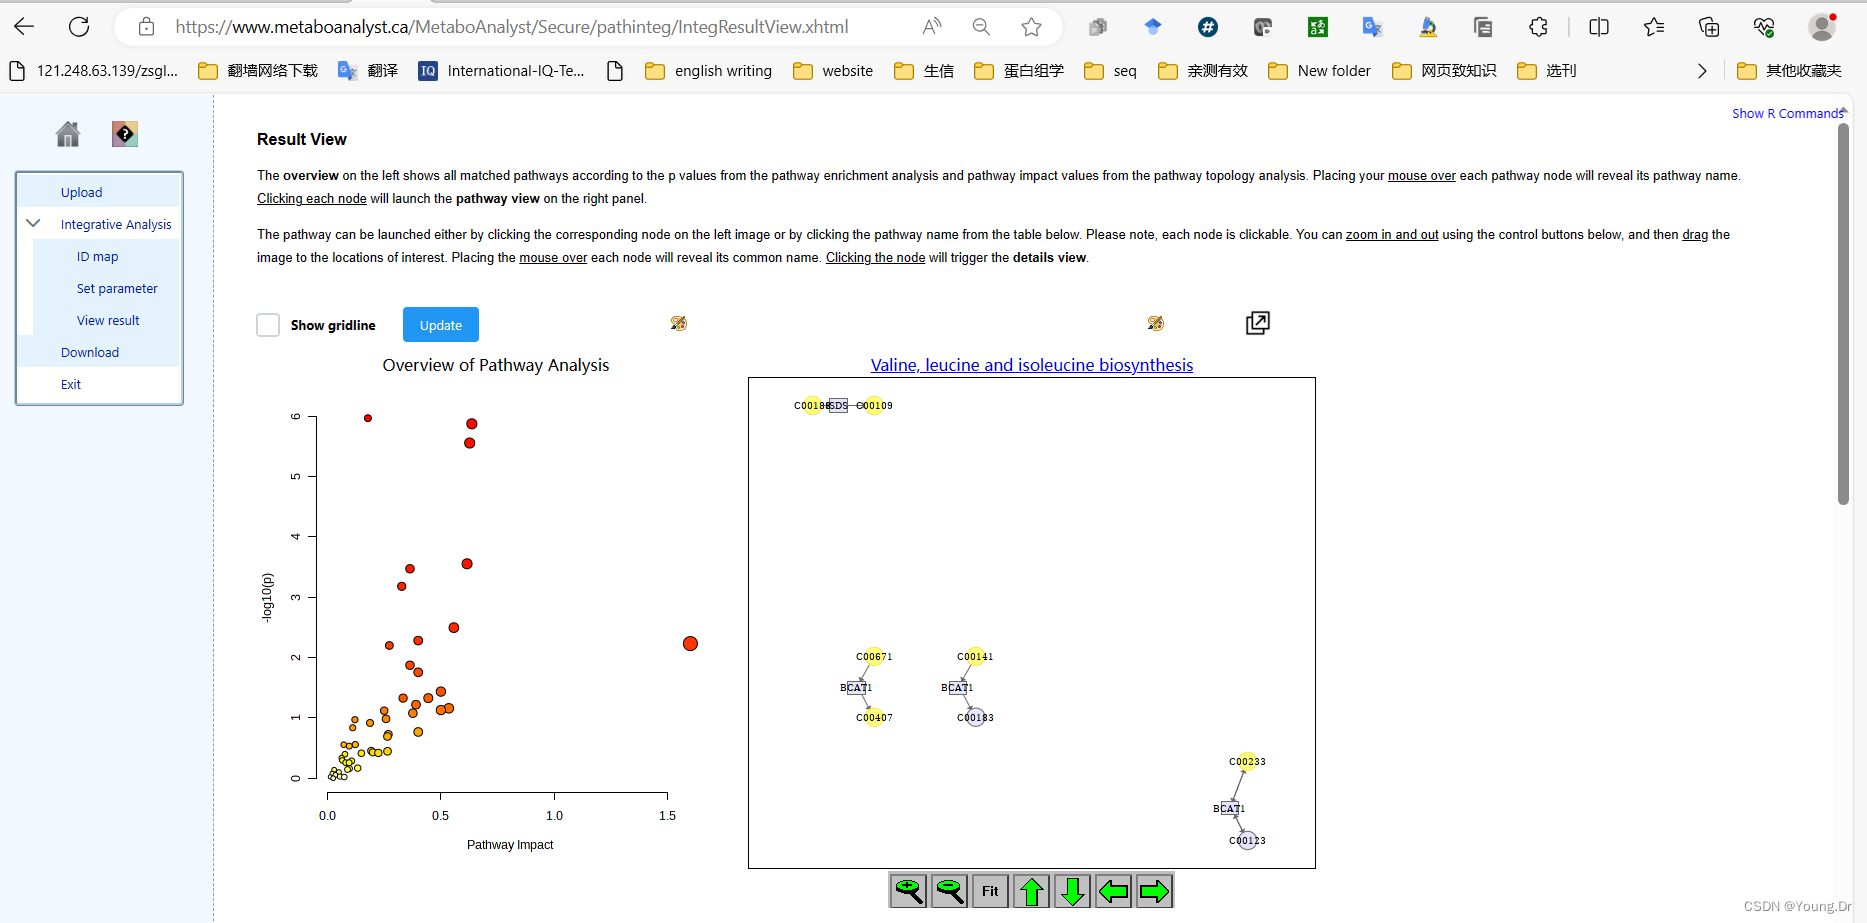
mSet<-PlotKEGGPath(mSet, "Valine, leucine and isoleucine biosynthesis",566, 490, "png", NULL)
mSet<-RerenderMetPAGraph(mSet, "zoom1688955034900.png",566.0, 490.0, 100.0)
mSet<-RerenderMetPAGraph(mSet, "zoom1688955042271.png",566.0, 490.0, 100.0)
mSet<-RerenderMetPAGraph(mSet, "zoom1688955042752.png",566.0, 490.0, 100.0)
mSet<-RerenderMetPAGraph(mSet, "zoom1688955043934.png",582.0, 504.0, 102.85714285714285)
mSet<-RerenderMetPAGraph(mSet, "zoom1688955044379.png",588.0, 509.0, 103.87755102040816)
mSet<-RerenderMetPAGraph(mSet, "zoom1688955044775.png",594.0, 514.0, 104.89795918367346)
mSet<-RerenderMetPAGraph(mSet, "zoom1688955045222.png",611.0, 529.0, 107.9591836734694)
mSet<-RerenderMetPAGraph(mSet, "zoom1688955045614.png",611.0, 529.0, 107.9591836734694)
mSet<-RerenderMetPAGraph(mSet, "zoom1688955046351.png",594.0, 514.0, 104.89795918367346)
mSet<-RerenderMetPAGraph(mSet, "zoom1688955047996.png",566.0, 490.0, 100.0)
mSet<-PlotKEGGPath(mSet, "Aminoacyl-tRNA biosynthesis",566, 490, "png", NULL)
mSet<-PlotKEGGPath(mSet, "Valine, leucine and isoleucine biosynthesis",566, 490, "png", NULL)
mSet<-SaveTransformedData(mSet)step3.2 genes-compound
# PID of current job: 731548
mSet<-InitDataObjects("conc", "pathinteg", FALSE)
mSet<-SetOrganism(mSet, "rno")
mSet<-SetOrganism(mSet, "hsa")
geneListFile<-"replace_with_your_file_name"
geneList<-readChar(geneListFile, file.info(geneListFile)$size)
mSet<-PerformGeneMapping(mSet, geneList, "hsa", "symbol");
cmpdListFile<-"replace_with_your_file_name"
cmpdList<-readChar(cmpdListFile, file.info(cmpdListFile)$size)
mSet<-PerformCmpdMapping(mSet, cmpdList, "hsa", "hmdb");
mSet<-CreateMappingResultTable(mSet)
mSet<-PrepareIntegData(mSet);
mSet<-PerformIntegPathwayAnalysis(mSet, "dc", "hyper", "integ", "query");
mSet<-PlotPathSummary(mSet, F, "path_view_0_", "png", 72, width=NA, NA, NA )
mSet<-CreateIntegMatchingTable(mSet);
mSet<-PlotKEGGPath(mSet, "Phenylalanine, tyrosine and tryptophan biosynthesis",566, 490, "png", NULL)
mSet<-RerenderMetPAGraph(mSet, "zoom1688954289011.png",566.0, 490.0, 100.0)
mSet<-RerenderMetPAGraph(mSet, "zoom1688954299369.png",566.0, 490.0, 100.0)
mSet<-PlotKEGGPath(mSet, "Phenylalanine, tyrosine and tryptophan biosynthesis",566, 490, "png", NULL)
Prepare4TarIntegNetwork(mSetObj)
mSet<-PerformIntegPathwayAnalysis(mSet, "dc", "hyper", "integ", "query");
mSet<-PlotPathSummary(mSet, F, "path_view_1_", "png", 72, width=NA, NA, NA )
mSet<-CreateIntegMatchingTable(mSet);
mSet<-PlotKEGGPath(mSet, "Valine, leucine and isoleucine biosynthesis",566, 490, "png", NULL)
mSet<-RerenderMetPAGraph(mSet, "zoom1688955034900.png",566.0, 490.0, 100.0)
mSet<-RerenderMetPAGraph(mSet, "zoom1688955042271.png",566.0, 490.0, 100.0)
mSet<-RerenderMetPAGraph(mSet, "zoom1688955042752.png",566.0, 490.0, 100.0)
mSet<-RerenderMetPAGraph(mSet, "zoom1688955043934.png",582.0, 504.0, 102.85714285714285)
mSet<-RerenderMetPAGraph(mSet, "zoom1688955044379.png",588.0, 509.0, 103.87755102040816)
mSet<-RerenderMetPAGraph(mSet, "zoom1688955044775.png",594.0, 514.0, 104.89795918367346)
mSet<-RerenderMetPAGraph(mSet, "zoom1688955045222.png",611.0, 529.0, 107.9591836734694)
mSet<-RerenderMetPAGraph(mSet, "zoom1688955045614.png",611.0, 529.0, 107.9591836734694)
mSet<-RerenderMetPAGraph(mSet, "zoom1688955046351.png",594.0, 514.0, 104.89795918367346)
mSet<-RerenderMetPAGraph(mSet, "zoom1688955047996.png",566.0, 490.0, 100.0)
mSet<-PlotKEGGPath(mSet, "Aminoacyl-tRNA biosynthesis",566, 490, "png", NULL)
mSet<-PlotKEGGPath(mSet, "Valine, leucine and isoleucine biosynthesis",566, 490, "png", NULL)
mSet<-SaveTransformedData(mSet)
mSet<-SetOrganism(mSet, "hsa")
geneListFile<-"replace_with_your_file_name"
geneList<-readChar(geneListFile, file.info(geneListFile)$size)
mSet<-PerformGeneMapping(mSet, geneList, "hsa", "symbol");
cmpdListFile<-"replace_with_your_file_name"
cmpdList<-readChar(cmpdListFile, file.info(cmpdListFile)$size)
mSet<-PerformCmpdMapping(mSet, cmpdList, "hsa", "name");
mSet<-CreateMappingResultTable(mSet)
mSet<-PrepareIntegData(mSet);
mSet<-PerformIntegPathwayAnalysis(mSet, "dc", "hyper", "integ", "query");
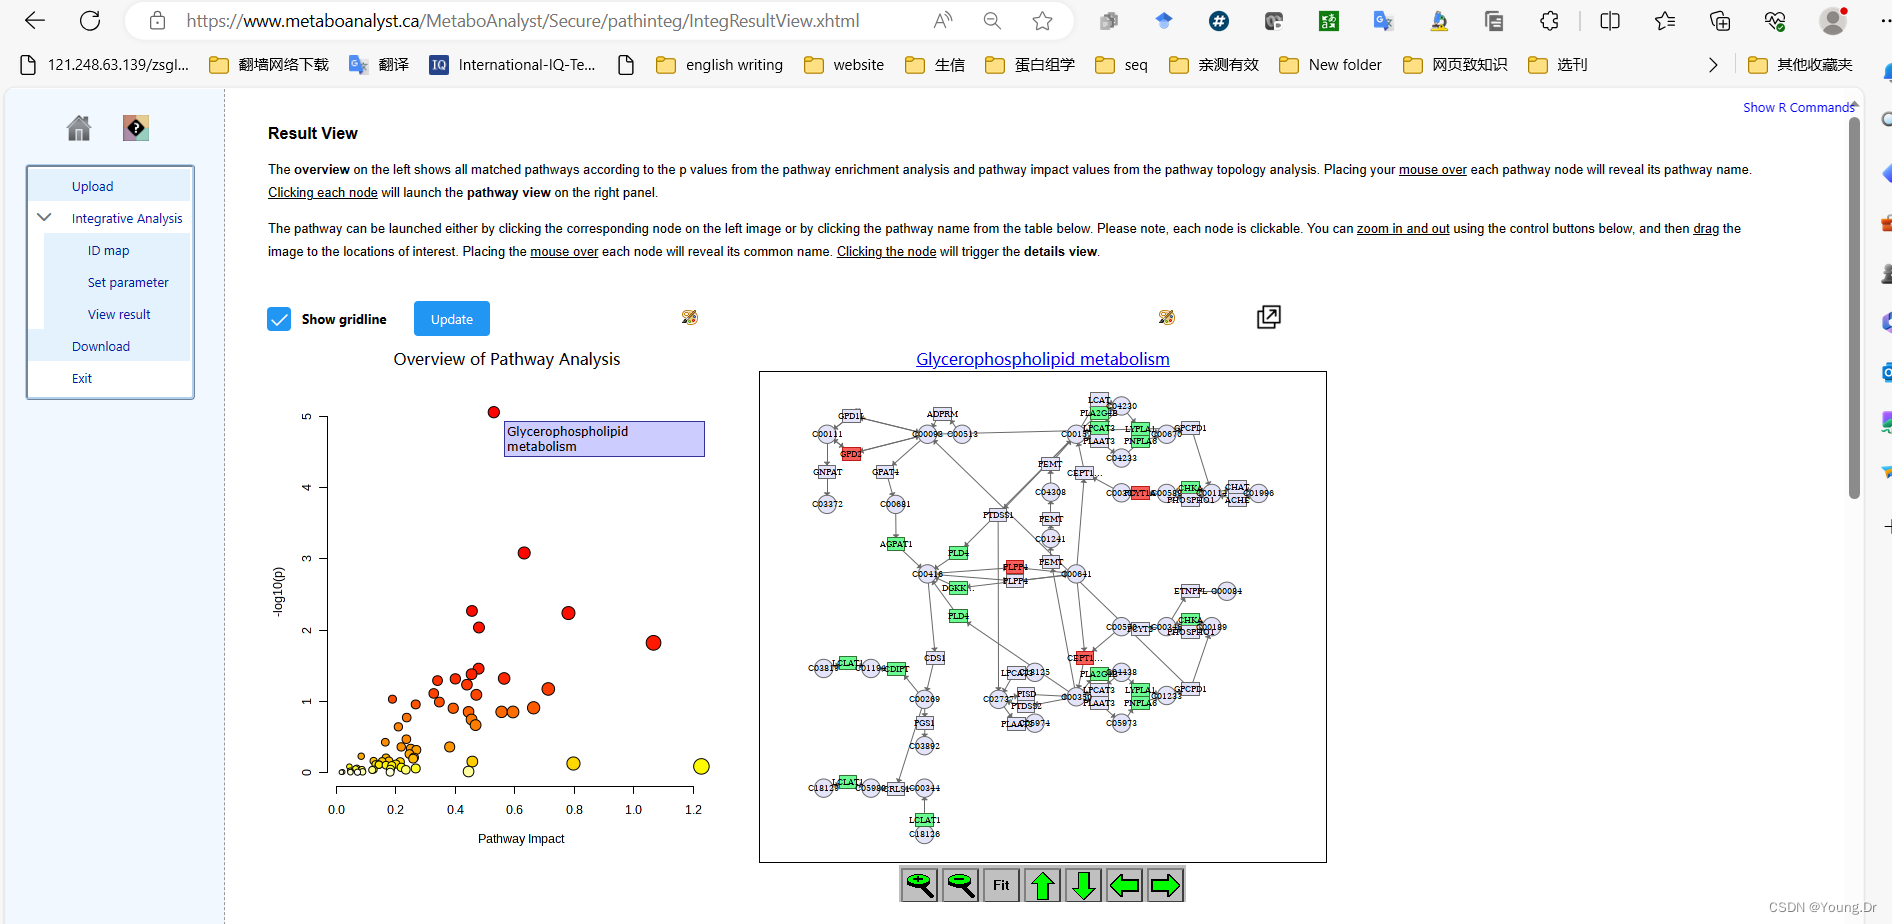
mSet<-PlotPathSummary(mSet, F, "path_view_2_", "png", 72, width=NA, NA, NA )
mSet<-CreateIntegMatchingTable(mSet);
mSet<-PlotKEGGPath(mSet, "Glycerophospholipid metabolism",566, 490, "png", NULL)
mSet<-RerenderMetPAGraph(mSet, "zoom1688955277384.png",566.0, 490.0, 100.0)
mSet<-PlotKEGGPath(mSet, "Glycerophospholipid metabolism",566, 490, "png", NULL)
mSet<-SaveTransformedData(mSet)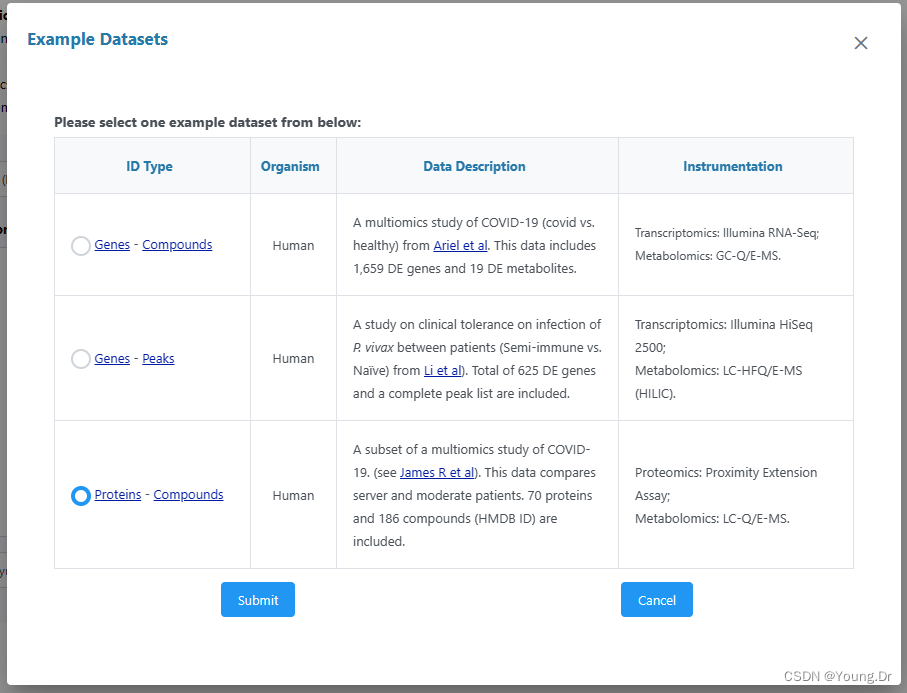
# PID of current job: 731548
mSet<-InitDataObjects("conc", "pathinteg", FALSE)
mSet<-SetOrganism(mSet, "rno")
mSet<-SetOrganism(mSet, "hsa")
geneListFile<-"replace_with_your_file_name"
geneList<-readChar(geneListFile, file.info(geneListFile)$size)
mSet<-PerformGeneMapping(mSet, geneList, "hsa", "symbol");
cmpdListFile<-"replace_with_your_file_name"
cmpdList<-readChar(cmpdListFile, file.info(cmpdListFile)$size)
mSet<-PerformCmpdMapping(mSet, cmpdList, "hsa", "hmdb");
mSet<-CreateMappingResultTable(mSet)
mSet<-PrepareIntegData(mSet);
mSet<-PerformIntegPathwayAnalysis(mSet, "dc", "hyper", "integ", "query");
mSet<-PlotPathSummary(mSet, F, "path_view_0_", "png", 72, width=NA, NA, NA )
mSet<-CreateIntegMatchingTable(mSet);
mSet<-PlotKEGGPath(mSet, "Phenylalanine, tyrosine and tryptophan biosynthesis",566, 490, "png", NULL)
mSet<-RerenderMetPAGraph(mSet, "zoom1688954289011.png",566.0, 490.0, 100.0)
mSet<-RerenderMetPAGraph(mSet, "zoom1688954299369.png",566.0, 490.0, 100.0)
mSet<-PlotKEGGPath(mSet, "Phenylalanine, tyrosine and tryptophan biosynthesis",566, 490, "png", NULL)
Prepare4TarIntegNetwork(mSetObj)
mSet<-PerformIntegPathwayAnalysis(mSet, "dc", "hyper", "integ", "query");
mSet<-PlotPathSummary(mSet, F, "path_view_1_", "png", 72, width=NA, NA, NA )
mSet<-CreateIntegMatchingTable(mSet);
mSet<-PlotKEGGPath(mSet, "Valine, leucine and isoleucine biosynthesis",566, 490, "png", NULL)
mSet<-RerenderMetPAGraph(mSet, "zoom1688955034900.png",566.0, 490.0, 100.0)
mSet<-RerenderMetPAGraph(mSet, "zoom1688955042271.png",566.0, 490.0, 100.0)
mSet<-RerenderMetPAGraph(mSet, "zoom1688955042752.png",566.0, 490.0, 100.0)
mSet<-RerenderMetPAGraph(mSet, "zoom1688955043934.png",582.0, 504.0, 102.85714285714285)
mSet<-RerenderMetPAGraph(mSet, "zoom1688955044379.png",588.0, 509.0, 103.87755102040816)
mSet<-RerenderMetPAGraph(mSet, "zoom1688955044775.png",594.0, 514.0, 104.89795918367346)
mSet<-RerenderMetPAGraph(mSet, "zoom1688955045222.png",611.0, 529.0, 107.9591836734694)
mSet<-RerenderMetPAGraph(mSet, "zoom1688955045614.png",611.0, 529.0, 107.9591836734694)
mSet<-RerenderMetPAGraph(mSet, "zoom1688955046351.png",594.0, 514.0, 104.89795918367346)
mSet<-RerenderMetPAGraph(mSet, "zoom1688955047996.png",566.0, 490.0, 100.0)
mSet<-PlotKEGGPath(mSet, "Aminoacyl-tRNA biosynthesis",566, 490, "png", NULL)
mSet<-PlotKEGGPath(mSet, "Valine, leucine and isoleucine biosynthesis",566, 490, "png", NULL)
mSet<-SaveTransformedData(mSet)
mSet<-SetOrganism(mSet, "hsa")
geneListFile<-"replace_with_your_file_name"
geneList<-readChar(geneListFile, file.info(geneListFile)$size)
mSet<-PerformGeneMapping(mSet, geneList, "hsa", "symbol");
cmpdListFile<-"replace_with_your_file_name"
cmpdList<-readChar(cmpdListFile, file.info(cmpdListFile)$size)
mSet<-PerformCmpdMapping(mSet, cmpdList, "hsa", "name");
mSet<-CreateMappingResultTable(mSet)
mSet<-PrepareIntegData(mSet);
mSet<-PerformIntegPathwayAnalysis(mSet, "dc", "hyper", "integ", "query");
mSet<-PlotPathSummary(mSet, F, "path_view_2_", "png", 72, width=NA, NA, NA )
mSet<-CreateIntegMatchingTable(mSet);
mSet<-PlotKEGGPath(mSet, "Glycerophospholipid metabolism",566, 490, "png", NULL)
mSet<-RerenderMetPAGraph(mSet, "zoom1688955277384.png",566.0, 490.0, 100.0)
mSet<-PlotKEGGPath(mSet, "Glycerophospholipid metabolism",566, 490, "png", NULL)
mSet<-SaveTransformedData(mSet)
mSet<-SetOrganism(mSet, "hsa")
geneListFile<-"replace_with_your_file_name"
geneList<-readChar(geneListFile, file.info(geneListFile)$size)
mSet<-PerformGeneMapping(mSet, geneList, "hsa", "symbol");
cmpdListFile<-"replace_with_your_file_name"
cmpdList<-readChar(cmpdListFile, file.info(cmpdListFile)$size)
mSet<-PerformCmpdMapping(mSet, cmpdList, "hsa", "hmdb");
mSet<-CreateMappingResultTable(mSet)
mSet<-PrepareIntegData(mSet);
mSet<-PerformIntegPathwayAnalysis(mSet, "dc", "hyper", "integ", "query");
mSet<-PlotPathSummary(mSet, F, "path_view_3_", "png", 72, width=NA, NA, NA )
mSet<-CreateIntegMatchingTable(mSet);
mSet<-PlotKEGGPath(mSet, "Valine, leucine and isoleucine biosynthesis",566, 490, "png", NULL)
mSet<-RerenderMetPAGraph(mSet, "zoom1688955496924.png",566.0, 490.0, 100.0)
mSet<-SaveTransformedData(mSet)
step4
# PID of current job: 1444258
mSet<-InitDataObjects("conc", "network", FALSE)
mSet<-SetOrganism(mSet, "hsa")
geneListFile<-"replace_with_your_file_name"
geneList<-readChar(geneListFile, file.info(geneListFile)$size)
mSet<-PerformGeneMapping(mSet, geneList, "hsa", "entrez");
cmpdListFile<-"replace_with_your_file_name"
cmpdList<-readChar(cmpdListFile, file.info(cmpdListFile)$size)
mSet<-PerformCmpdMapping(mSet, cmpdList, "hsa", "kegg");
mSet<-CreateMappingResultTable(mSet)
mSet<-GetNetworkGeneMappingResultTable(mSet)
mSet<-PrepareNetworkData(mSet);
mSet<-PrepareKeggQueryJson(mSet)
mSet<-PerformKOEnrichAnalysis_KO01100(mSet, "pathway", "network_enrichment_pathway_0");
mSet<-SearchNetDB(mSet, "pheno", "gene_metabolites", FALSE, 0.5)
mSet<-CreateGraph(mSet)
mSet<-SaveTransformedData(mSet)
| ||||||||||||||||||||||||||||||||||||||||||||||||||||||||||||||||||||||||||||||||||||||||||||||
| ||||||||||||||||||||||||||||||||||||||||||||||||||||||||||||||||||||||||||||||||||||||||||||||
| ||||||||||||||||||||||||||||||||||||||||||||||||||||||||||||||||||||||||||||||||||||||||||||||
|

使用MetaboDiff包分析非靶向代谢组数据 - 简书最近手里有个非靶向代谢组的数据,通过学习MetaboDiff包来熟悉代谢组分析的思路和流程,接下来的流程来自于MetaboDiff包官方帮助文档。 1. MetaboDiff...https://www.jianshu.com/p/80af83c2f630https://www.metaboanalyst.ca/docs/RTutorial.xhtmlhttps://www.metaboanalyst.ca/docs/RTutorial.xhtmlhttps://www.metaboanalyst.ca/docs/APIs.xhtml
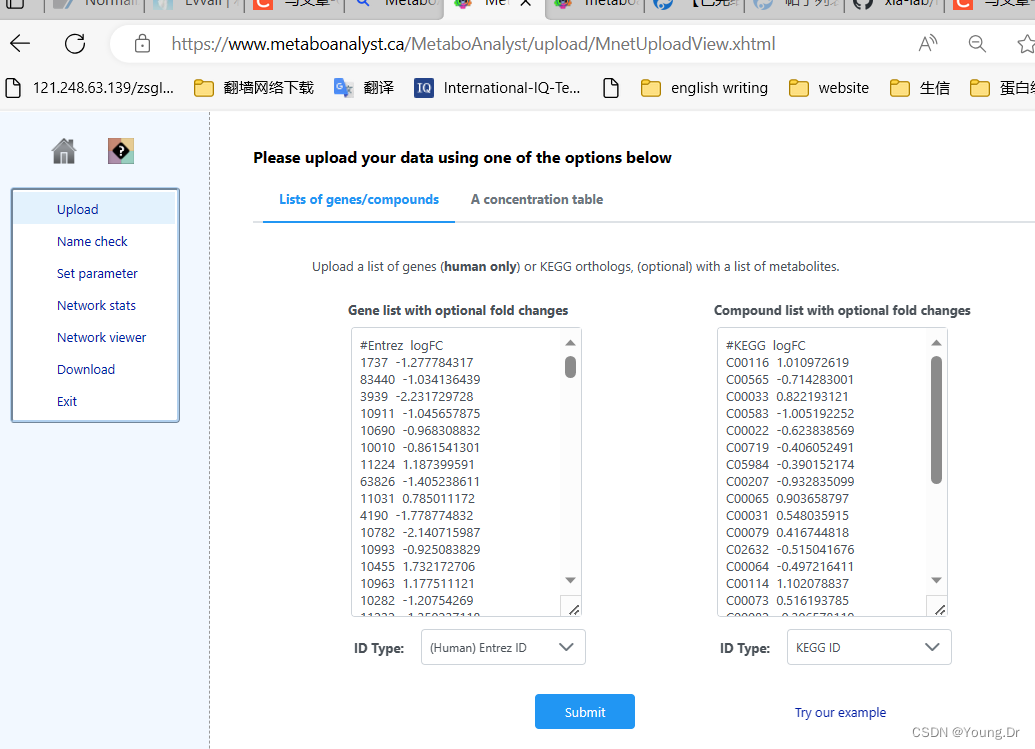
    The different options for input.type are given below:
        name - Compound name (e.g., 1,3-Diaminopropane)
        hmdb - Human Metabolome Database (e.g., HMDB0000002)
        pubchem - PubChem Substance and Compound databases(e.g., 428)
        chebi - Chemical Entities of Biological Interest(e.g., 15725)
        metlin - Metabolite and Chemical Entity Database (e.g., 5081)
        kegg - KEGG COMPOUND Database (e.g., C00986)
2.1 Over representation analysis
We will go over two analysis workflows, the first is when the input is a list to perform over representation
analysis. The first step is to create a vector containing a list of compound names. The list will then be cross-
referenced (CrossReferencing) against the MetaboAnalyst compound libraries (HMDB, PubChem, KEGG,
etc.), and any compounds without a hit will have NA. This step may take long due to downloading of libraries
if they do not already exist in your working directory.
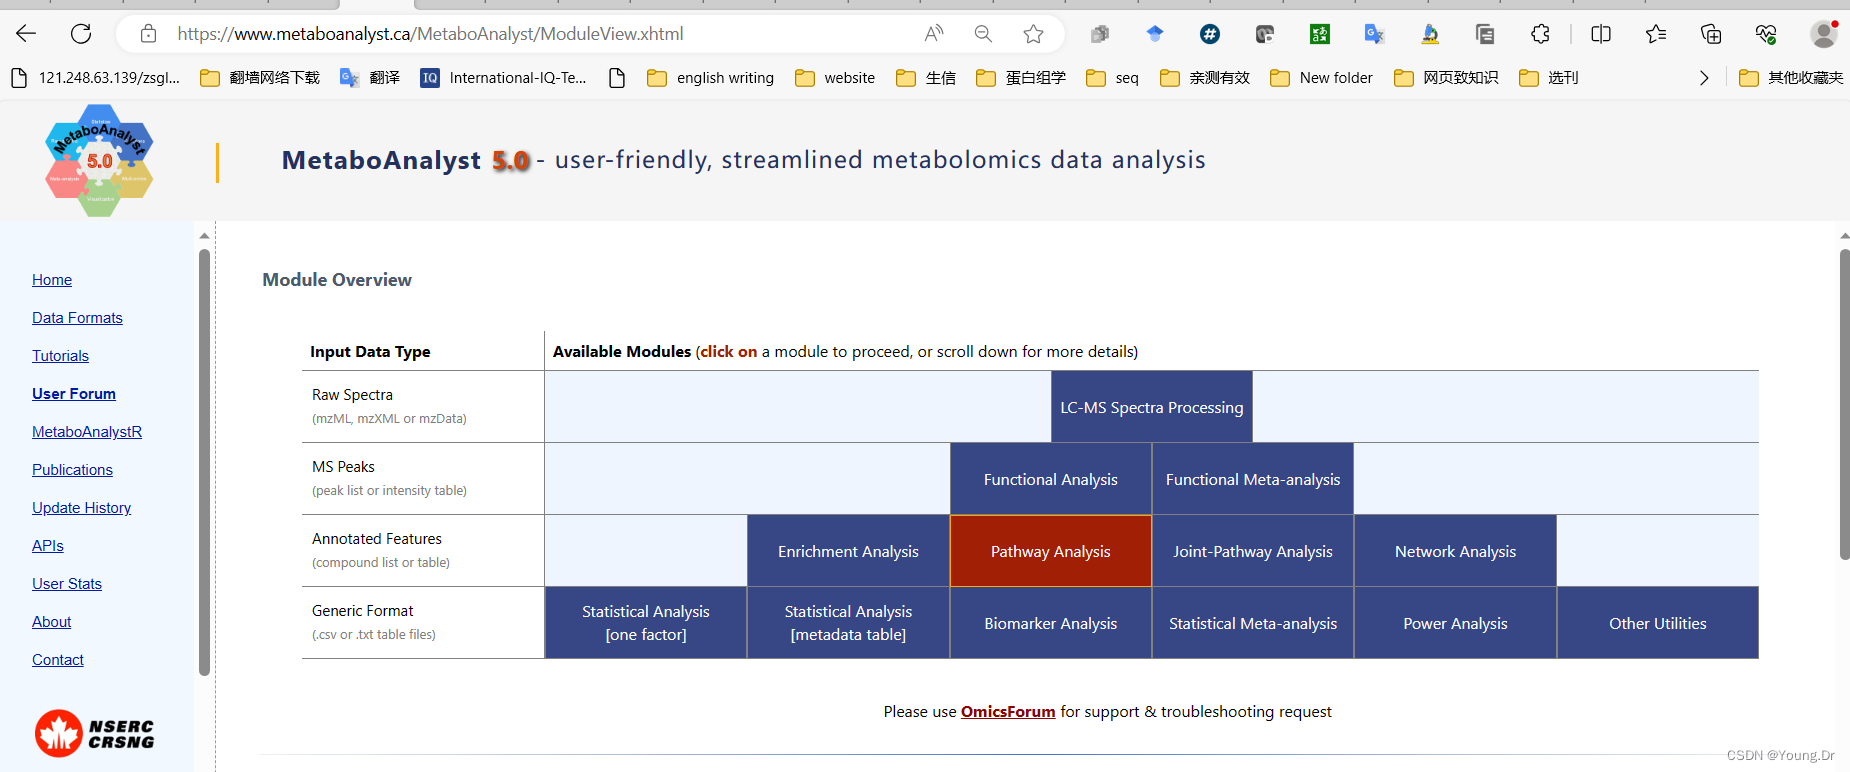
InitDataObjects {MetaboAnalystR} | R Documentation |
Constructs a dataSet object for storing data
Description
This functions handles the construction of a mSetObj object for storing data for further processing and analysis. It is necessary to utilize this function to specify to MetaboAnalystR the type of data and the type of analysis you will perform.
Usage
InitDataObjects(data.type, anal.type, paired=FALSE)
Arguments
data.type | The type of data, either list (Compound lists), conc (Compound concentration data), specbin (Binned spectra data), pktable (Peak intensity table), nmrpeak (NMR peak lists), mspeak (MS peak lists), or msspec (MS spectra data) |
anal.type | Indicate the analysis module to be performed: stat, pathora, pathqea, msetora, msetssp, msetqea, mf, cmpdmap, smpmap, or pathinteg |
paired | Indicate if the data is paired or not. Logical, default set to FALSE |
Author(s)
Jeff Xia jeff.xia@mcgill.ca McGill University, Canada License: GNU GPL (>= 2)
==============================
CreateMappingResultTable {MetaboAnalystR} | R Documentation |
Creates the mapping result table
Description
Creates the mapping result table
Usage
CreateMappingResultTable(mSetObj = NA)
Arguments
mSetObj | Input the name of the created mSetObj (see InitDataObjects) |
[Package MetaboAnalystR version 4.0.0 Index]
---------------==============================================
CrossReferencing {MetaboAnalystR} | R Documentation |
Various functions for mapping b/w names & database identifiers Given a list of compound names or ids, find matched name or ids from selected databases
Description
Given a list of compound names or ids find matched name or IDs from selected databases
Usage
CrossReferencing(
  mSetObj = NA,
  q.type,
  hmdb = T,
  pubchem = T,
  chebi = F,
  kegg = T,
  metlin = F,
  lipid = F
)
Arguments
mSetObj | Input the name of the created mSetObj (see InitDataObjects). |
q.type | Input the query type, "name" for compound names, "hmdb" for HMDB IDs, "kegg" for KEGG IDs, "pubchem" for PubChem CIDs, "chebi" for ChEBI IDs, "metlin" for METLIN IDs, and "hmdb_kegg" for a both KEGG and HMDB IDs. |
hmdb | Logical, T to cross reference to HMDB, F to not. |
pubchem | Logical, T to cross reference to PubChem, F to not. |
chebi | Logical, T to cross reference to CheBI, F to not. |
kegg | Logical, T to cross reference to KEGG, F to not. |
metlin | Logical, T to cross reference to MetLin, F to not. |
lipid | Logical, if features are lipids (T), a different database will be used for compound matching. |
Author(s)
Jeff Xia jeff.xia@mcgill.ca McGill University, Canada License: GNU GPL (>= 2)
========================================
PerformDetailMatch {MetaboAnalystR} | R Documentation |
Perform detailed name match
Description
Given a query, perform compound matching.
Usage
PerformDetailMatch(mSetObj = NA, q)
Arguments
mSetObj | Input name of the created mSet Object. |
q | Input the query. |
===================
| SetCandidate {MetaboAnalystR} | R Documentation |
Set matched name based on user selection from all potential hits
Description
Note: to change object in the enclosing enviroment, use "<<-"
Usage
SetCandidate(mSetObj = NA, query_nm, can_nm)
Arguments
mSetObj | Input the name of the created mSetObj (see InitDataObjects). |
query_nm | Input the query name. |
can_nm | Input the candidate name. |
Author(s)
Jeff Xia jeff.xia@mcgill.ca McGill University, Canada License: GNU GPL (>= 2)
====-------------
| SetMetabolomeFilter {MetaboAnalystR} | R Documentation |
Set metabolome filter
Description
Set metabolome filter
Usage
SetMetabolomeFilter(mSetObj = NA, TorF)
Arguments
mSetObj | Input the name of the created mSetObj (see InitDataObjects) |
TorF | Input metabolome filter |
-================
SetCurrentMsetLib {MetaboAnalystR} | R Documentation |
Set current user selected metset library for search
Description
if enrichment analysis, also prepare lib by creating a list of metabolite sets
Usage
SetCurrentMsetLib(mSetObj=NA, libname, excludeNum)
Arguments
mSetObj | Input the name of the created mSetObj (see InitDataObjects) |
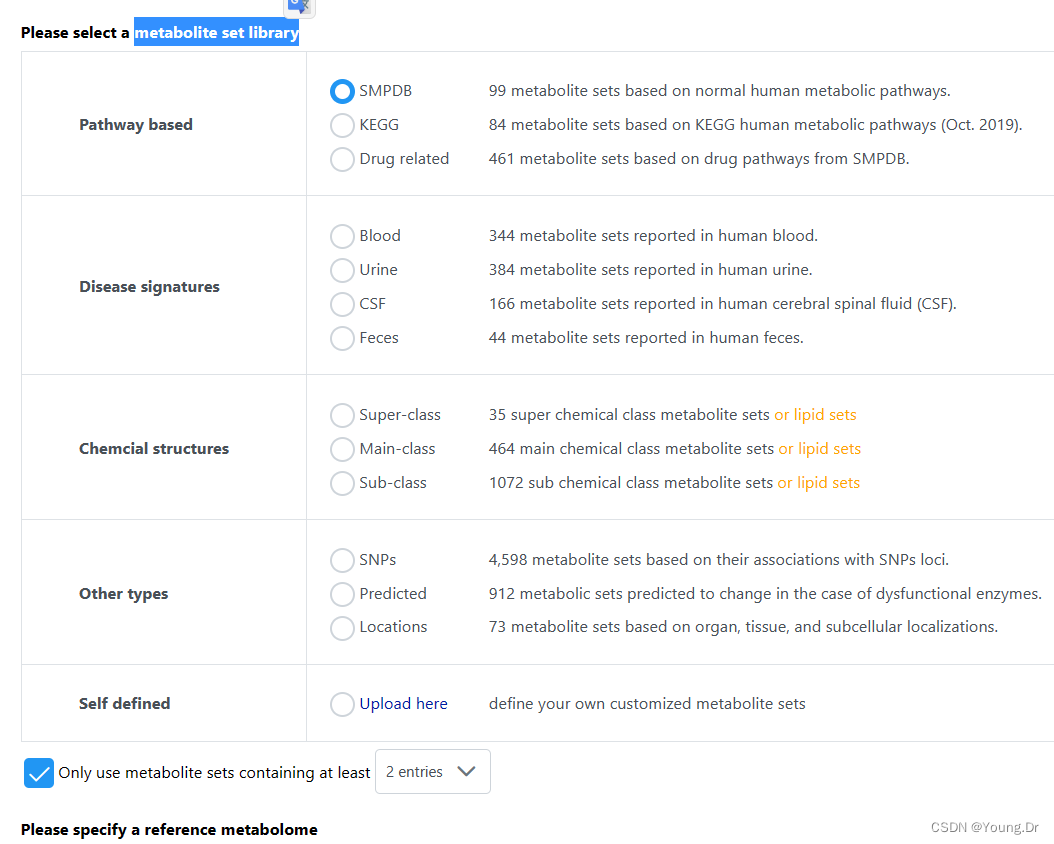
libname | Input user selected name of library, "self", "kegg_pathway", "smpdb_pathway", "blood", "urine", "csf", "snp", "predicted", "location", and "drug". |
excludeNum | Users input the mimimum number compounds within selected metabolite sets (metabolitesets < excludeNum) |
Author(s)
Jeff Xia jeff.xia@mcgill.ca McGill University, Canada License: GNU GPL
-----------------------
| CalculateHyperScore {MetaboAnalystR} | R Documentation |
Over-representation analysis using hypergeometric tests
Description
Over-representation analysis using hypergeometric tests The probability is calculated from obtaining equal or higher number of hits using 1-phyper. Since phyper is a cumulative probability, to get P(X>=hit.num) => P(X>(hit.num-1))
Usage
CalculateHyperScore(mSetObj = NA)
Arguments
mSetObj | Input the name of the created mSetObj (see InitDataObjects) |
Author(s)
Jeff Xia jeff.xia@mcgill.ca McGill University, Canada License: GNU GPL (>= 2)
====================
| PlotORA {MetaboAnalystR} | R Documentation |
Plot over-representation analysis (ORA)
Description
Plot over-representation analysis (ORA)
Usage
PlotORA(mSetObj=NA, imgName, imgOpt, format="png", dpi=72, width=NA)
Arguments
mSetObj | Input the name of the created mSetObj (see InitDataObjects) |
imgName | Input a name for the plot |
imgOpt | "net" |
format | Select the image format, "png", or "pdf". |
dpi | Input the dpi. If the image format is "pdf", users need not define the dpi. For "png" images, the default dpi is 72. It is suggested that for high-resolution images, select a dpi of 300. |
width | Input the width, there are 2 default widths, the first, width = NULL, is 10.5. The second default is width = 0, where the width is 7.2. Otherwise users can input their own width. |


 3466
3466

 被折叠的 条评论
为什么被折叠?
被折叠的 条评论
为什么被折叠?
 到【灌水乐园】发言


