


上面两篇肿瘤克隆进化之后第三篇就是大家非常感兴趣的鱼图也就是sankey图,之前有发过一遍,但是好多学者反应不是很好使用,现在重新发一次,即fishplot R包
**背景:**深度大规模并行测序技术使肿瘤的异质性和进化特征得到了前所未有的详细描述。追踪克隆结构中的这些变化通常可以洞察治疗反应和耐药性。在涉及多个时间点的复杂情况下,标准的可视化(如散点图)可能很难解释。目前的数据可视化方法也通常是手工和费力的,而且往往只是近似的亚克隆部分。
**结果:**我们开发了一个R包,可以准确、直观地显示克隆结构随时间的变化。它需要简单的输入数据,并生成适合诊断、演示和发布的说明性和易于解释的图形。
**结论:**该工具的简单、强大和灵活性使其在可视化肿瘤演化方面很有价值,并且在研究和临床环境中都有潜在的用途。fishplot软件包:https://github.com/chrisamiller/fishplot
-
文章复现figure 1 图形:
-
第一步,安装软件包:
#install devtools if you don't have it already for easy installation
install.packages("devtools")
library(devtools)
install_github("chrisamiller/fishplot")
- 第二步,数据准备,输入数据包括三个部分:
-
**时间点:**提供一个时间点列表;
-
**突变频率矩阵:**每个时间点出现的每个种群的突变频率;
-
**整数向量:**指定克隆之间亲代关系的整数向量(0表示没有父类)。
- 第三步,上图片和代码:
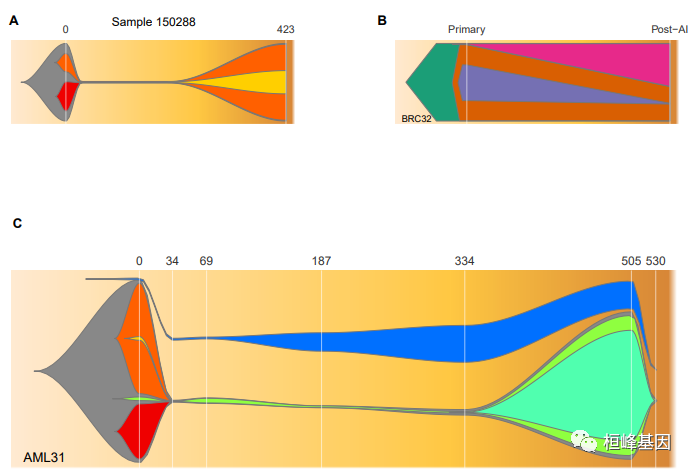
library(fishplot)
#recreate figure one from the manuscript
pdf("figure1.pdf",height=6,width=8)
layout(mat=t(matrix(c(1,2,3,3),nrow=2)), widths=c(1,1), heights=c(1,1.5))
##-------------------------------------------
##panel A
timepoints=c(0,30,200,423)
parents = c(0,1,1,3)
frac.table = matrix(
  c(100, 38, 24, 00,
    002, 00, 01, 00,
    002, 00, 01, 01,
    100, 00, 98, 30),
  ncol=length(timepoints))

fish = createFishObject(frac.table,parents,timepoints=timepoints)
fish = layoutClones(fish)
fishPlot(fish, shape="spline", vlines=c(0,423), vlab=c(0,423), title="Sample 150288", cex.title=0.9, cex.vlab=0.8)
##panel label
text(-100,130,"A",xpd=T,font=2)
##-------------------------------------------
##panel B
parents = c(0,1,2,1)
timepoints=c(0,120)
frac.table = matrix(
  c(100, 98, 46, 01,
    100, 44, 01, 55),
  ncol=length(timepoints))
fish = createFishObject(frac.table,parents,timepoints=timepoints)
fish = layoutClones(fish)
fish = setCol(fish,col=c("#1B9E77","#D95F02","#7570B3","#E7298A"))
fishPlot(fish, shape="polygon", vlab=c("Primary","Post-AI"), vlines=c(0,120), title.btm="BRC32", cex.title=0.7, cex.vlab=0.8,ramp.angle=1, pad.left=0.3)
##panel label
text(-50,130,"B",xpd=T,font=2)
##-------------------------------------------
##panel C
timepoints=c(0,34,69,187,334,505,530)
parents = c(0,1,1,1,3,4,0)
frac.table = matrix(
  c(99, 30,     2, 60, 0,     2, 1,
    1,   0,   0.1, 00, 0,     0, 1,
    3,   0,   2.5, 00, 0,     0, 1,
    1,   0,   0.9, 00, 0,     0, 10,
    3,   0,   0.9, 00, 0.1,   0, 20,
    80,  0,    76, 00, 60,    0, 15,
    0.1, 0, 0.005, 00, 0.001, 0, 0),
  ncol=7)
fish = createFishObject(frac.table,parents,timepoints=timepoints)
fish = layoutClones(fish, separate.independent.clones=T)
fish = setCol(fish,c("#888888", "#EF0000", "#8FFF40", "#FF6000", "#50FFAF", "#FFCF00", "#0070FF"))
vlines=c(0,34,69,187,334,505,530,650,750)
fishPlot(fish, shape="spline", vlines=vlines, vlab=vlines, title.btm="AML31",cex.vlab=0.9)
##panel label
text(-125,130,"C",xpd=T,font=2)
dev=dev.off()
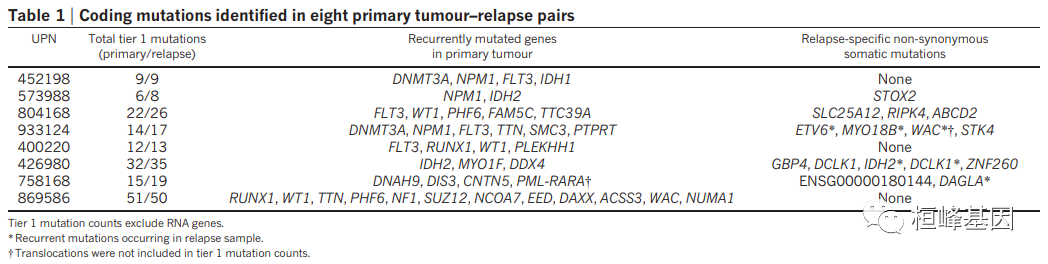
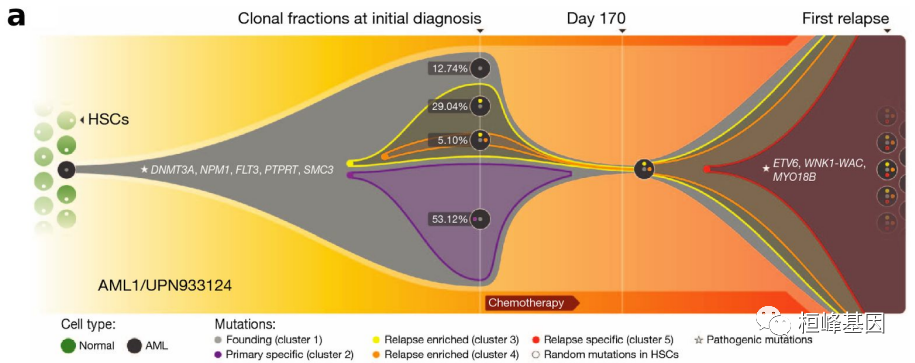
软件本身非常好使用,但是需要我们更多的理解其中的原理,比如突变频率的来源(sciClone/Pyclone),还有亲代的关系的由来,之前就有人问过我,这里在解释一遍。下面的例子是函数的例子,方便展示,而这个例子的数据来自于一篇关于AML原发和复发的进化关系,如下:
-
ClonEvol结果作为输入绘图
-
读取ClonEvol数据方式:
#generate phylogeny with clonevol
x = infer.clonal.models(variants=v, vaf.col.names=samples, ...)
#create a list of fish objects
f = generateFishplotInputs(results=x)
fishes = createFishPlotObjects(f)
- 绘制fishplot:
#plot with fishplot
pdf('fish.pdf', width=8, height=5)
for (i in 1:length(fishes)){
    fish = layoutClones(fishes[[i]])
    fish = setCol(fish,f$clonevol.clone.colors)
    fishPlot(fish,shape="spline", title.btm="Patient", cex.title=0.5,
             vlines=seq(1, length(samples)), vlab=samples, pad.left=0.5)
}
dev <- dev.off()
克隆进化pipeline里面涉及到的三款软件都已介绍完,那么有人要问三个软件的完整版在哪里?在下面,自己体会哦!
library(sciClone)
library(clonevol)
library(fishplot)

## read in the data - copy number
cn1 = read.table("tumor.cn",sep="\t",stringsAsFactors=F)
cn2 = read.table("relapse.cn",sep="\t",stringsAsFactors=F)
cn1 = cn1[,c(1,2,3,5)]
cn2 = cn2[,c(1,2,3,5)]
## read in vaf data
v1=read.table("tumor.vafs",sep="\t",stringsAsFactors=F,header=T)
v2=read.table("relapse.vafs",sep="\t",stringsAsFactors=F,header=T)

samples = c("Tumor","Relapse")

## run sciclone to detect clusters
sc = sciClone(vafs=list(v1,v2),
              copyNumberCalls=list(cn1,cn2),
              sampleNames=samples,
              useSexChrs=FALSE, doClusteringAlongMargins=FALSE)
writeClusterTable(sc, "clusters")
sc.plot2d(sc,"clusters.2d.pdf")

## prepare clonevol input
vafs = data.frame(cluster=sc@vafs.merged$cluster,
                  tvaf=sc@vafs.merged$Tumor.vaf,
                  rvaf=sc@vafs.merged$Relapse.vaf,stringsAsFactors=F)
vafs = vafs[!is.na(vafs$cluster) & vafs$cluster > 0,]
names(vafs)[2:3] = samples

## run clonevol
res = infer.clonal.models(variants=vafs, cluster.col.name="cluster", vaf.col.names=samples,
                          subclonal.test="bootstrap", subclonal.test.model="non-parametric",
                          cluster.center="mean", num.boots=1000, founding.cluster=1,
                          min.cluster.vaf=0.01, sum.p=0.01, alpha=0.1, random.seed=63108)

# new clonevol
res = convert.consensus.tree.clone.to.branch(res, branch.scale='sqrt')

# new clonevol
plot.clonal.models(res, box.plot=TRUE, fancy.boxplot=TRUE, cell.plot=TRUE,
                   out.format="pdf", overwrite.output=TRUE, scale.monoclonal.cell.frac=TRUE,
                   cell.frac.ci=TRUE, tree.node.shape="circle", tree.node.size=40,
                   tree.node.text.size=0.65, width=8, height=5, out.dir=".")

## create a list of fish objects - one for each model (in this case, there's only one)
f = generateFishplotInputs(results=res)
fishes = createFishPlotObjects(f)

## plot each of these with fishplot
pdf('fish.pdf', width=8, height=4)
for (i in 1:length(fishes)){
    fish = layoutClones(fishes[[i]])
    fish = setCol(fish,f$clonevol.clone.colors)
    fishPlot(fish,shape="spline", title.btm="PatientID", cex.title=0.7,
             vlines=seq(1, length(samples)), vlab=samples, pad.left=0.5)
}
dev <- dev.off()
下期将分别介绍另一套pipeline(Pyclone+ citup+ Timespace),并且在调研目前是否有新出现的其他工具可以做同样的分析,都将在后续中一一献出,有想同我一起写篇review,可以V我哦!在线等!!!

Reference:
-
Miller CA, McMichael J, Dang HX, Maher CA, Ding L, Ley TJ, Mardis ER, Wilson RK. Visualizing tumor evolution with the fishplot package for R. BMC Genomics. 2016 Nov 7;17(1):880.
-
Ding, L., Ley, T., Larson, D. et al. Clonal evolution in relapsed acute myeloid leukaemia revealed by whole-genome sequencing. Nature 481, 506–510 (2012).


 3924
3924

 被折叠的 条评论
为什么被折叠?
被折叠的 条评论
为什么被折叠?
 到【灌水乐园】发言


