


具体做法如下:
假设我们有5个样本点(A, B, C, D, E)的1000个基因表达量的数据,我们希望对这1000个基因进行所谓的“拟时序”分析,以获得这1000个基因表达的先后顺序。
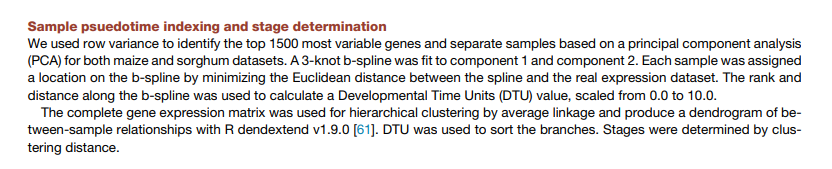
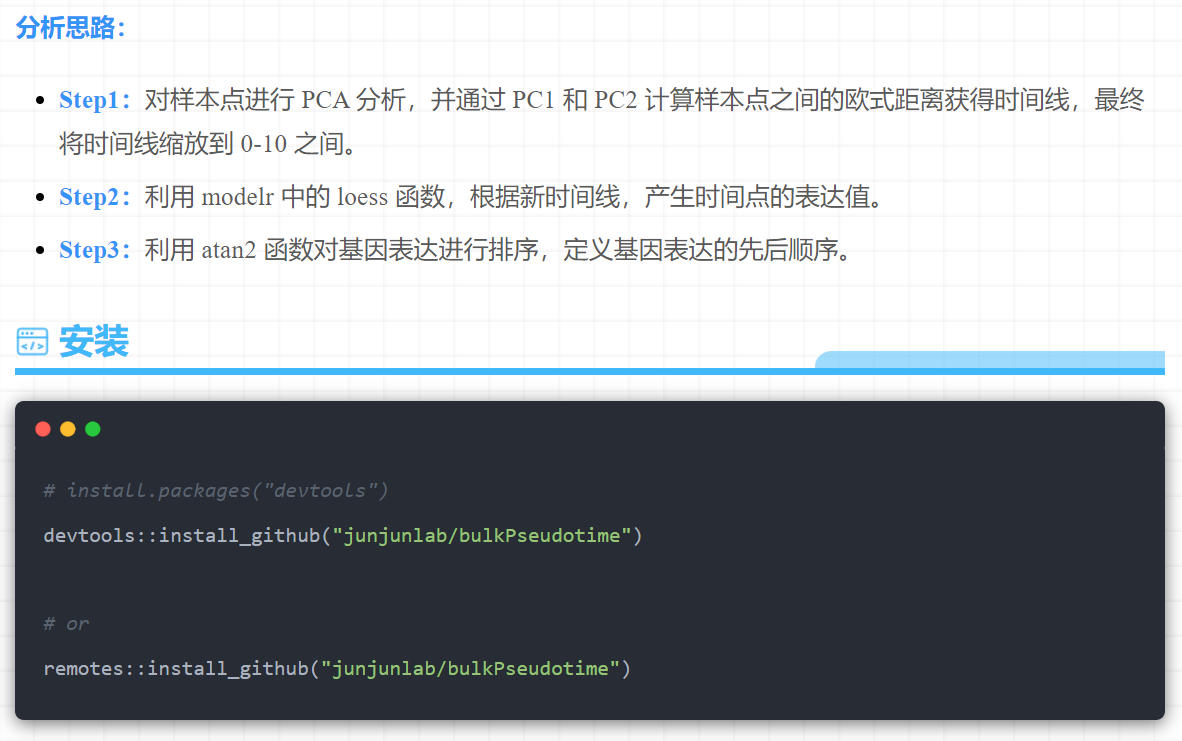
Step1:对5个样本点进行PCA分析,并通过PC1和PC2计算样本点之间的欧式距离获得时间线,最终将时间线缩放到0-10之间。
library(splines)
library(factoextra)
library(FactoMineR)
library(scales)
#读取基因表达的TPM矩阵
tpm=read.table("gene.TPM.txt",header=T,row.names=1)
#对5个样本进行PCA分析
pca=PCA(t(tpm),scale.unit=T,ncp=5,graph=F)
#提取PC1和PC2的结果,计算5个样本点的欧式距离
res=pca$ind$coord
res=res[,1:2]
dis=dist(res)
dis=as.matrix(dis)
#利用相邻样本点的欧式距离计算5个样本点原始的时间线
point1=0
point2=point1+dis[1,2]
point3=point2+dis[2,3]
point4=point3+dis[3,4]
point5=point4+dis[4,5]
raw.timeline=c(point1,point2,point3,point4,point5)
#通过scales包中的rescale函数将原始的时间线经过线性变换为0-10之间的新的时间线
new.timeline=rescale(raw.timeline,to=c(0,10))
Step2:利用modelr中的loess函数,根据新时间线,产生500个时间点的表达值。
library(tidyverse)
library(modelr)
#对tpm值进行zscale标准化
tpm.z=as.data.frame(t(apply(tpm,1,scale)))
names(tpm.z)=names(tpm)
#将5个时间点的zcale之后的表达值变成500个点的表达值
grid=data.frame(time=seq(0,10,length.out=500))
pseudotime.model.fun=function(value){time=new.timeline;data = tibble(value=value,time =time);model=loess(value ~ time,data);predict=grid %>% add_predictions(model);return(predict)}
res=apply(tpm.z,1,pseudotime.model.fun)
results=res %>% reduce(bind_cols)
exp500=as.data.frame(t(results[,seq(0,ncol(results),2)]))
names(exp500)=results$time...1
row.names(exp500)=row.names(tpm)
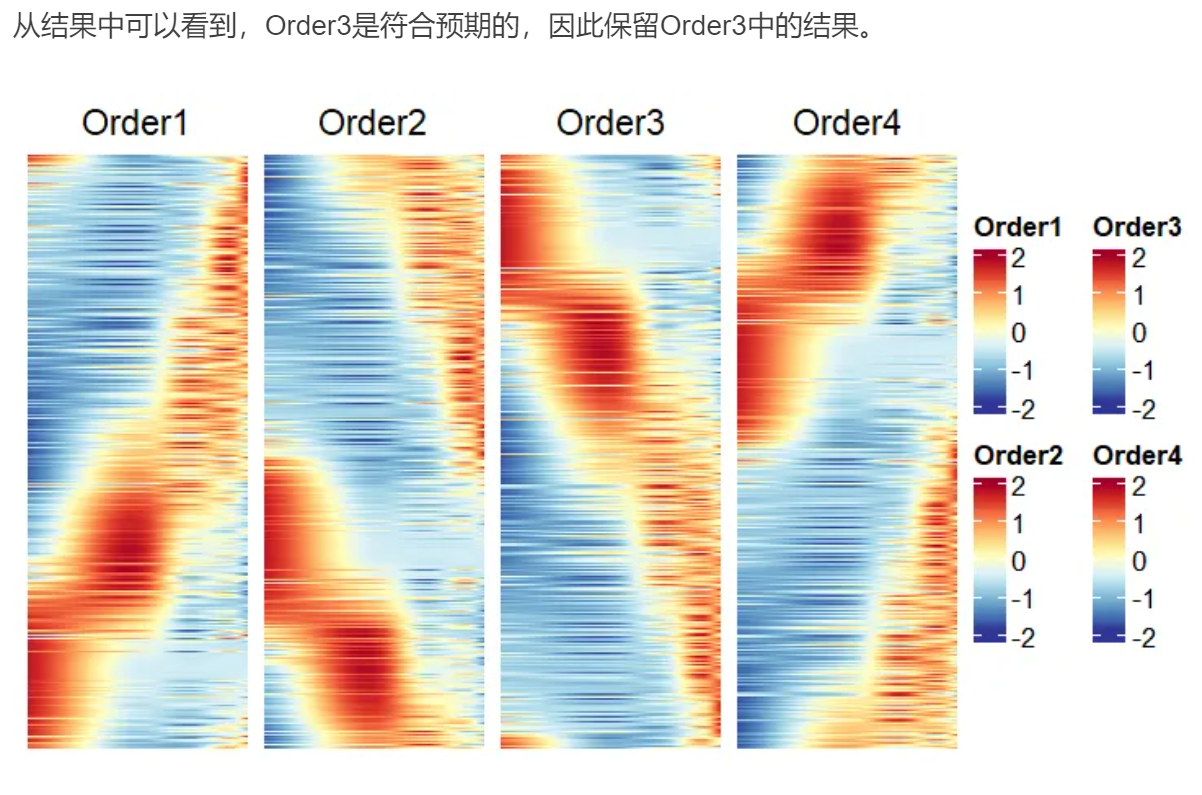
Step3: 利用atan2函数对基因表达进行排序,定义基因表达的先后顺序
library(ComplexHeatmap)
library(factoextra)
library(FactoMineR)
#对基因进行PCA分析,得到每个基因的Dim1和Dim2
gene.pca=PCA(exp500,scale.unit=T,ncp=5,graph=F)
res=gene.pca$ind$coord
res=res[,1:2]
exp500=cbind(exp500,res)
#用基因的Dim1和Dim2,进行排列组合,计算四种atan2值
exp500$atan2.1=atan2(exp500$Dim.1,exp500$Dim.2)
exp500$atan2.2=atan2(exp500$Dim.1,-exp500$Dim.2)
exp500$atan2.3=atan2(-exp500$Dim.1,exp500$Dim.2)
exp500$atan2.4=atan2(-exp500$Dim.1,-exp500$Dim.2)
#分别根据四种atan2值从低到高进行排序,然后用ComplexHeatmap可视化结果选定排序方式
order1=arrange(exp500,exp500$atan2.1)
order2=arrange(exp500,exp500$atan2.2)
order3=arrange(exp500,exp500$atan2.3)
order4=arrange(exp500,exp500$atan2.4)
p1=Heatmap(order1[,1:500],cluster_rows = F,cluster_columns = F,show_row_names = F,show_column_names = F,column_title = "Order1",heatmap_legend_param = list(title="Order1",legend_height=unit(2,"cm")),col=colorRampPalette(rev(brewer.pal(n = 11, name="RdYlBu")))(100))
p2=Heatmap(order2[,1:500],cluster_rows = F,cluster_columns = F,show_row_names = F,show_column_names = F,column_title = "Order2",heatmap_legend_param = list(title="Order2",legend_height=unit(2,"cm")),col=colorRampPalette(rev(brewer.pal(n = 11, name="RdYlBu")))(100))
p3=Heatmap(order3[,1:500],cluster_rows = F,cluster_columns = F,show_row_names = F,show_column_names = F,column_title = "Order3",heatmap_legend_param = list(title="Order3",legend_height=unit(2,"cm")),col=colorRampPalette(rev(brewer.pal(n = 11, name="RdYlBu")))(100))
p4=Heatmap(order4[,1:500],cluster_rows = F,cluster_columns = F,show_row_names = F,show_column_names = F,column_title = "Order4",heatmap_legend_param = list(title="Order4",legend_height=unit(2,"cm")),col=colorRampPalette(rev(brewer.pal(n = 11, name="RdYlBu")))(100))
p1+p2+p3+p4
相关软件:


给cell排序——》给gene排序
方法:

推文作者开发了一个R包:junjunlab/bulkPseudotime


参考:


 2026
2026

 被折叠的 条评论
为什么被折叠?
被折叠的 条评论
为什么被折叠?
 到【灌水乐园】发言


