


 Matplotlib-cpp是一个C++的图表库,它模仿了Python的Matplotlib,提供线图、散点图等多种2D图形绘制功能。用户可以自定义颜色、标记、线型,以及添加图例、标题和坐标轴设置。文章展示了如何安装、使用该库,并给出了多个代码示例,包括基本绘图、xkcd风格和3D表面图。
Matplotlib-cpp是一个用于在C++中绘制图表的开源库。它提供了与Python的Matplotlib库类似的功能,使得在C++环境下进行数据可视化变得更加便捷。基于Matplotlib-cpp,我们可以使用各种绘图函数和样式选项来创建各种类型的图表,包括折线图、散点图、柱状图等。它与C++的语法和数据结构紧密结合,方便了在C++项目中进行图表绘制和数据分析。
1. 安装
下载matplotlib-cpp
git clone https://github.com/lava/matplotlib-cpp.git2. 基本功能
matplotlib-cpp 主要提供了以下几种功能:
-
基本绘图:matplotlib-cpp 支持许多基本的 2D 图形,包括线图、散点图、条形图、直方图、饼图等。
-
子图:可以在一个画布上创建多个子图,每个子图可以独立绘制。
-
颜色、标记和线型:可以自定义每个图形的颜色、标记(数据点的形状)和线型(实线、虚线等)。
-
图例和标题:可以为每个图形添加图例和标题,以解释图形的含义。
-
坐标轴设置:可以自定义坐标轴的范围、刻度和标签。
-
网格线:可以添加网格线,以便于观察数据。
-
文本和标注:可以在图形上添加文本和标注,以强调特定的数据点或区域。
-
保存和显示:可以将图形保存为各种格式的文件,或在窗口中直接显示。
3. 示例
#include "matplotlibcpp.h"
#include <cmath>
namespace plt = matplotlibcpp;
int main()
{
// 准备数据
int n = 5000;
std::vector<double> x(n), y(n), z(n), w(n,2);
for(int i=0; i<n; ++i) {
x.at(i) = i*i;
y.at(i) = sin(2*M_PI*i/360.0);
z.at(i) = log(i);
}
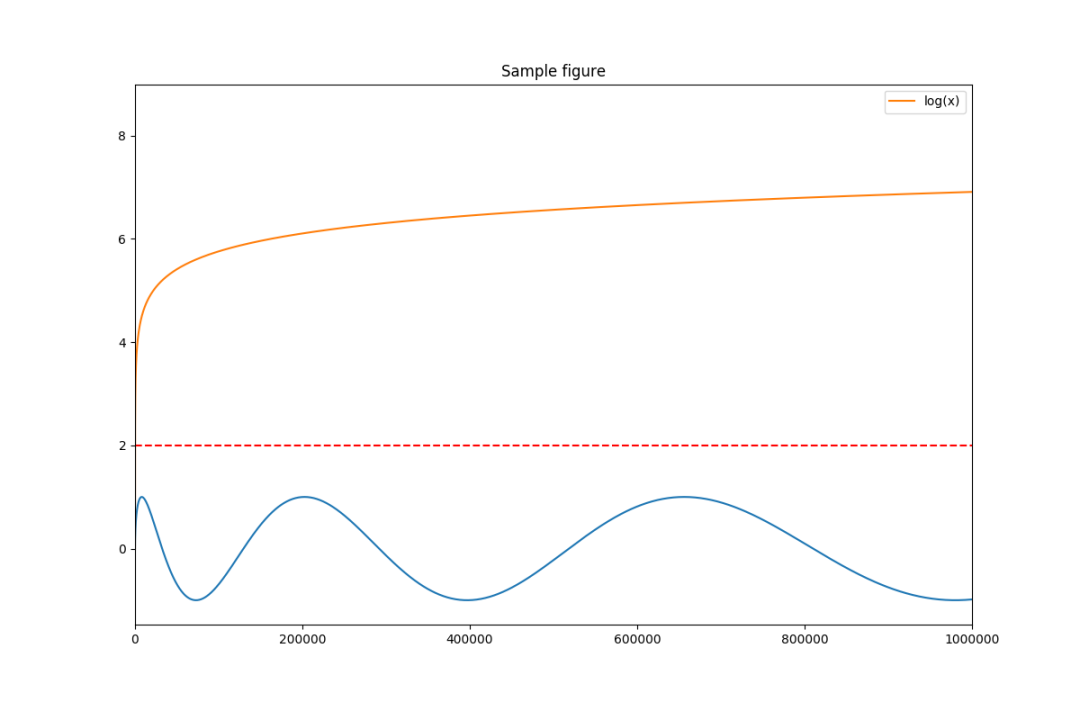
// 设置输出图像的大小为1200x780像素
plt::figure_size(1200, 780);
// 绘制给定x和y数据的折线图,颜色自动选择
plt::plot(x, y);
// 绘制给定x和y数据的红色虚线
plt::plot(x, w, "r--");
// 绘制一条线,其名称将出现在图例中为"log(x)"
plt::named_plot("log(x)", x, z);
// 设置x轴的范围为[0,1000000]
plt::xlim(0, 1000*1000);
// 添加图表标题
plt::title("Sample figure");
// 启用图例
plt::legend();
// 保存图像(文件格式由扩展名确定)
plt::save("./basic.png");
return 0;
}
#include <cmath>
#include "matplotlibcpp.h"
using namespace std;
namespace plt = matplotlibcpp;
int main()
{
// 准备数据
int n = 5000; // 数据点个数
vector<double> x(n),y(n);
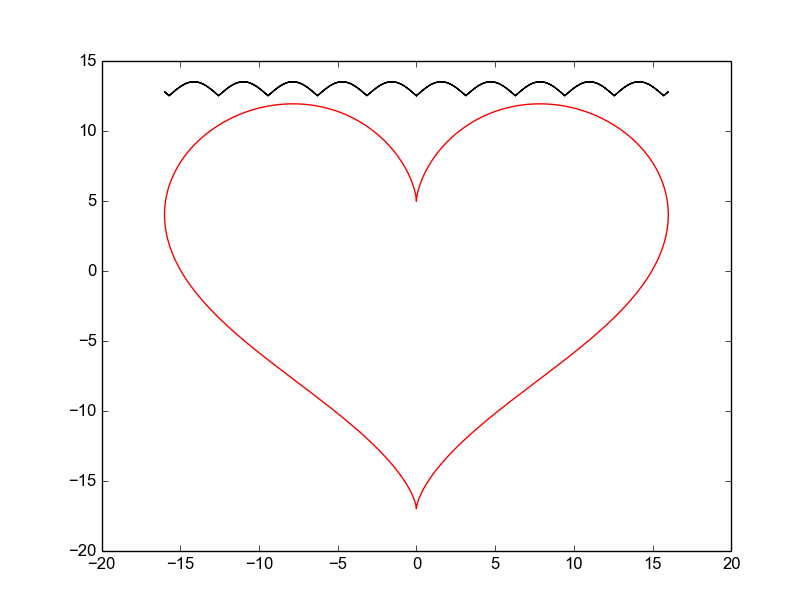
for(int i=0; i<n; ++i) {
double t = 2*M_PI*i/n;
x.at(i) = 16*sin(t)*sin(t)*sin(t);
y.at(i) = 13*cos(t) - 5*cos(2*t) - 2*cos(3*t) - cos(4*t);
}
// plot() 函数接受任意数量的 (x, y, format) 三元组
// x 必须是可迭代的(即提供 begin(x) 和 end(x) 函数),
// y 可以是可调用的(提供 operator() const 函数)或者可迭代的
plt::plot(x, y, "r-", x, [](double d) { return 12.5+abs(sin(d)); }, "k-");
// 显示图表
plt::show();
}
#include "matplotlibcpp.h"
#include <vector>
#include <cmath>
namespace plt = matplotlibcpp;
int main() {
std::vector<double> t(1000);
std::vector<double> x(t.size());
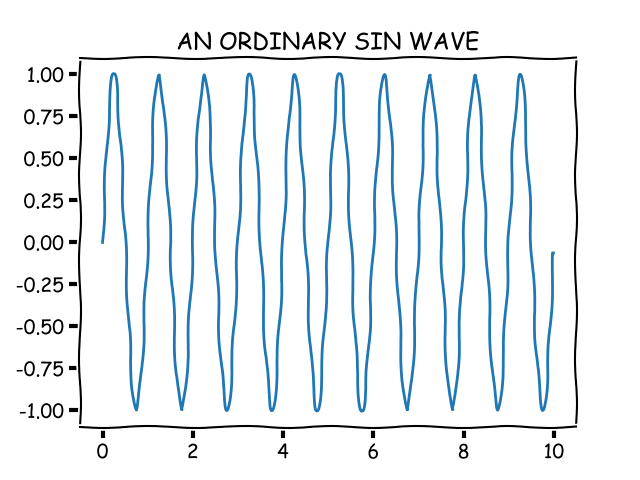
for(size_t i = 0; i < t.size(); i++) {
t[i] = i / 100.0;
x[i] = sin(2.0 * M_PI * 1.0 * t[i]);
}
plt::xkcd(); // 应用xkcd风格的绘图
plt::plot(t, x);
plt::title("AN ORDINARY SIN WAVE"); // 设置图表标题
plt::save("xkcd.png"); // 保存图像为"xkcd.png"
}
#include "../matplotlibcpp.h"
namespace plt = matplotlibcpp;
int main()
{
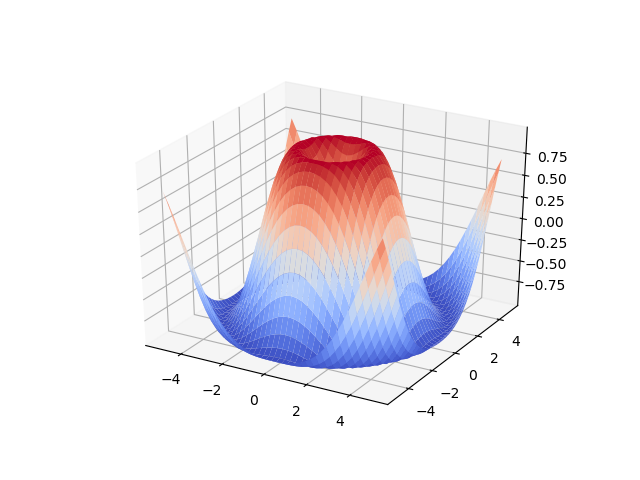
std::vector<std::vector<double>> x, y, z;
for (double i = -5; i <= 5; i += 0.25) {
std::vector<double> x_row, y_row, z_row;
for (double j = -5; j <= 5; j += 0.25) {
x_row.push_back(i);
y_row.push_back(j);
z_row.push_back(::std::sin(::std::hypot(i, j)));
}
x.push_back(x_row);
y.push_back(y_row);
z.push_back(z_row);
}
plt::plot_surface(x, y, z);
plt::show();
}


 1244
1244

 被折叠的 条评论
为什么被折叠?
被折叠的 条评论
为什么被折叠?
 到【灌水乐园】发言


