Markers: Points and Lines (C++)
Description: Teaches how to use the visualization_msgs/Marker message to send points and lines to rviz.Tutorial Level: BEGINNER
Next Tutorial: Interactive(交互式的) Markers: Getting Started
目录
Intro
In the Markers: Basic Shapes you learned how to send simple shapes to rviz using visualization(形象化) markers. You can send more than just simple shapes though, and this tutorial will introduce you to the POINTS, LINE_STRIP and LINE_LISTmarker types. For a full list of types, see the Marker Display page.
Using Points, Line Strips, and Line Lists
The POINTS, LINE_STRIP and LINE_LIST markers all use the points member of the visualization_msgs/Marker message. The POINTS type places a point at each point added. The LINE_STRIP type uses each point as a vertex(顶点) in a connected set of lines, where point 0 is connected to point 1, 1 to 2, 2 to 3, etc. The LINE_LIST type creates unconnected lines out of each pair of points, i.e. point 0 to 1, 2 to 3, etc.
Anyway, let's get to the code:
The Code
#include <ros/ros.h>
#include <visualization_msgs/Marker.h>

#include <cmath>

int main( int argc, char** argv )
{
  ros::init(argc, argv, "points_and_lines");
  ros::NodeHandle n;
  ros::Publisher marker_pub = n.advertise<visualization_msgs::Marker>("visualization_marker", 10);

  ros::Rate r(30);

  float f = 0.0;
  while (ros::ok())
  {

    visualization_msgs::Marker points, line_strip, line_list;
    points.header.frame_id = line_strip.header.frame_id = line_list.header.frame_id = "/my_frame";
    points.header.stamp = line_strip.header.stamp = line_list.header.stamp = ros::Time::now();
    points.ns = line_strip.ns = line_list.ns = "points_and_lines";
    points.action = line_strip.action = line_list.action = visualization_msgs::Marker::ADD;
    points.pose.orientation.w = line_strip.pose.orientation.w = line_list.pose.orientation.w = 1.0;


    points.id = 0;
    line_strip.id = 1;
    line_list.id = 2;


    points.type = visualization_msgs::Marker::POINTS;
    line_strip.type = visualization_msgs::Marker::LINE_STRIP;
    line_list.type = visualization_msgs::Marker::LINE_LIST;


    // POINTS markers use x and y scale for width/height respectively
    points.scale.x = 0.2;
    points.scale.y = 0.2;

    // LINE_STRIP/LINE_LIST markers use only the x component of scale, for the line width
    line_strip.scale.x = 0.1;
    line_list.scale.x = 0.1;


    // Points are green
    points.color.g = 1.0f;
    points.color.a = 1.0;

    // Line strip is blue
    line_strip.color.b = 1.0;
    line_strip.color.a = 1.0;

    // Line list is red
    line_list.color.r = 1.0;
    line_list.color.a = 1.0;


    // Create the vertices for the points and lines
    for (uint32_t i = 0; i < 100; ++i)
    {
      float y = 5 * sin(f + i / 100.0f * 2 * M_PI);
      float z = 5 * cos(f + i / 100.0f * 2 * M_PI);

      geometry_msgs::Point p;
      p.x = (int32_t)i - 50;
      p.y = y;
      p.z = z;

      points.points.push_back(p);
      line_strip.points.push_back(p);

      // The line list needs two points for each line
      line_list.points.push_back(p);
      p.z += 1.0;
      line_list.points.push_back(p);
    }


    marker_pub.publish(points);
    marker_pub.publish(line_strip);
    marker_pub.publish(line_list);

    r.sleep();

    f += 0.04;
  }
}
The Code Explained
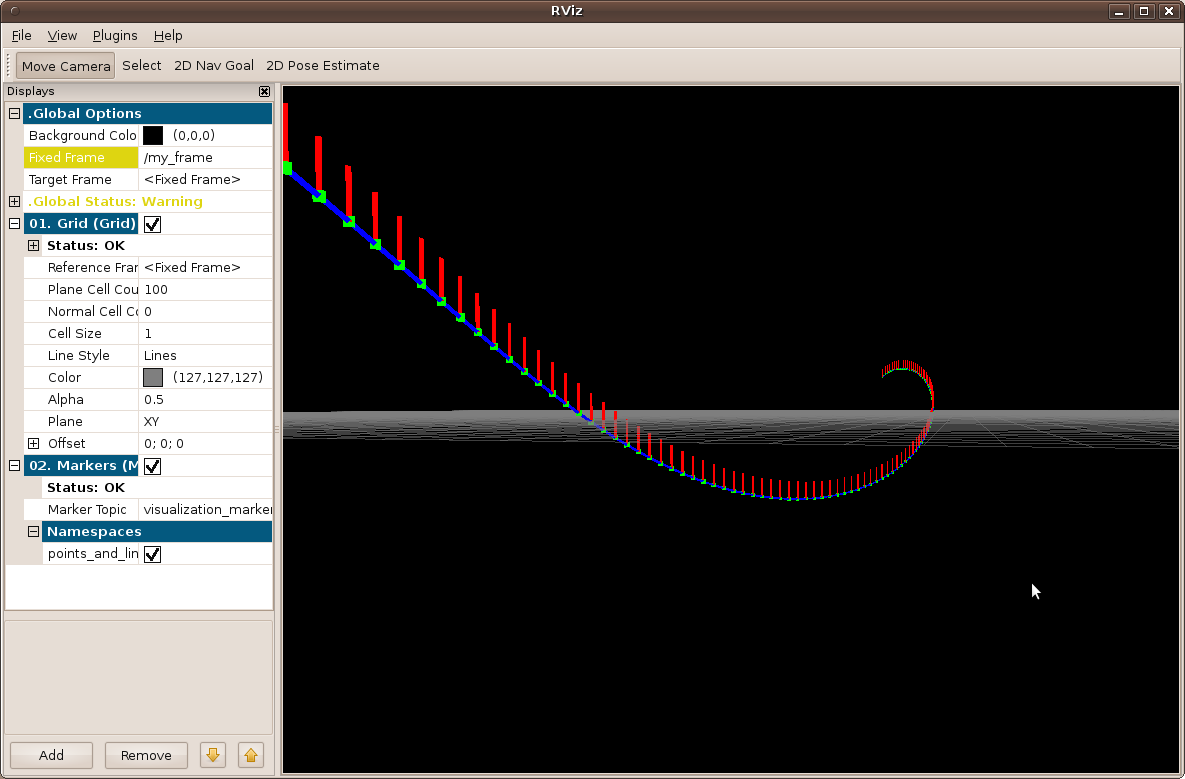
Now let's break down the code, skipping things that were explained in the previous tutorial. The overall effect created is a rotating(旋转) helix(螺旋) with lines sticking upwards from each vertex.
  47     visualization_msgs::Marker points, line_strip, line_list;
  48     points.header.frame_id = line_strip.header.frame_id = line_list.header.frame_id = "/my_frame";
  49     points.header.stamp = line_strip.header.stamp = line_list.header.stamp = ros::Time::now();
  50     points.ns = line_strip.ns = line_list.ns = "points_and_lines";
  51     points.action = line_strip.action = line_list.action = visualization_msgs::Marker::ADD;
  52     points.pose.orientation.w = line_strip.pose.orientation.w = line_list.pose.orientation.w = 1.0;
Here we create three visualization_msgs/Marker messages and initialize(初始化) all of their shared data. We take advantage of the fact that message members default to 0 and only set the w member of the pose(姿势).
We assign(分配) three different ids to the three markers. The use of the points_and_lines namespace ensures(保证) they won't collide(碰撞) with other broadcasters.
Here we set the marker types to POINTS, LINE_STRIP and LINE_LIST.
The scale member means different things for these marker types. The POINTS marker uses the x and y members for width and height respectively(分别地), while the LINE_STRIP and LINE_LIST markers only use the x component(成分), which defines(定义) the line width. Scale(规模) values are in meters.
Here we set the points to green, the line strip(剥夺) to blue, and the line list to red.
  92     // Create the vertices for the points and lines
  93     for (uint32_t i = 0; i < 100; ++i)
  94     {
  95       float y = 5 * sin(f + i / 100.0f * 2 * M_PI);
  96       float z = 5 * cos(f + i / 100.0f * 2 * M_PI);
  97
  98       geometry_msgs::Point p;
  99       p.x = (int32_t)i - 50;
 100       p.y = y;
 101       p.z = z;
 102
 103       points.points.push_back(p);
 104       line_strip.points.push_back(p);
 105
 106       // The line list needs two points for each line
 107       line_list.points.push_back(p);
 108       p.z += 1.0;
 109       line_list.points.push_back(p);
 110     }
We use sine(正弦) and cosine(余弦) to generate(形成) a helix(螺旋). The POINTS and LINE_STRIP markers both require only a point for each vertex(顶点), while the LINE_LIST marker requires 2.
Viewing the Markers
Set up rviz the same way you did in the last tutorial(辅导的), which is as follows:
Edit the CMakeLists.txt file in your using_markers package, and add to the bottom:
add_executable(points_and_lines src/points_and_lines.cpp)
target_link_libraries(points_and_lines ${catkin_LIBRARIES})
Then,
$ catkin_make
Then,
$ rosrun rviz rviz &
$ rosrun using_markers points_and_lines
You should see a rotating(旋转) helix(螺旋) that looks something like this:

Next Steps
The Marker Display page has a list of all the markers and options supported by rviz. Try out some of the other markers!


 1万+
1万+

 被折叠的 条评论
为什么被折叠?


