


This week at the Robot Invader compound we’ve been putting the finishing touches on our new Nanobots game, Dungeon Slots. This game started out as another week-long experiment and has stretched into a month-long development cycle because we like the concept so much. The game itself is finished, and we spent this week working on polish and performance.

Some engineers treat performance optimization as something of a black art. Folks are especially cautious on Android, where there are a wide variety of devices and the performance characteristics of a given device are not always obvious. We’ve found, however, that despite large differences in the philosophical design of various mobile GPUs, there are a few simple rules we can follow that keep us running well on pretty much everything. Here’s the checklist we follow when designing our scenes for performance:
- Fill is your enemy. Every time you write to a pixel you incur a cost. Filling the screen of pixels, even just a solid color, is an expensive operation on just about every mobile chipset available. Even as mobile GPUs get better at this, screen resolutions seem to increase at exactly the same rate. Our #1 source of performance slowdown is pixel overdraw–writing to too many pixels more than one time in the frame.
- Draw calls are expensive. Every time you tell OpenGL ES to draw a buffer of verts, that call itself has a cost. Actually, on most devices I think it is the state switch involved in selecting the verts that you wish to draw that incurs the real cost; if you were to draw the same buffer multiple times, the first draw call would be more expensive than the subsequent calls. But generally speaking, we try to keep the number of draw calls as low as possible. In Wind-up Knight 2 we have about 100 – 120 per frame. Dungeon Slots is less than 40 per frame.
- Lights are expensive. Depending on how you’ve implemented your lighting, realtime lights can destroy your performance on a mobile device. Lights often require multiple sets of geometry to be submitted to the GPU, or multiple passes over the pixels being lit, or more high-precision registers in a shader than your GPU has available. The actual costs come down to the individual implementation, but there are a number of ways lights can eat into your perf.
- Watch out for vertex creep. Many mobile devices are actually pretty good at handling scenes with lots of verts. But most GPUs fall down really hard after you pass a certain threshold of geometry per frame. In order to run on lower-end hardware, we target 30k triangles per frame as a soft upper limit. This might be a little conservative, but remember that some types of lights can increase your triangle count!
There are a few other rules of thumb, but they are less important: the rules above cover 95% of cases of poor performance. And of those, I’d say that fill-related slowdown accounts for the vast majority of cases.
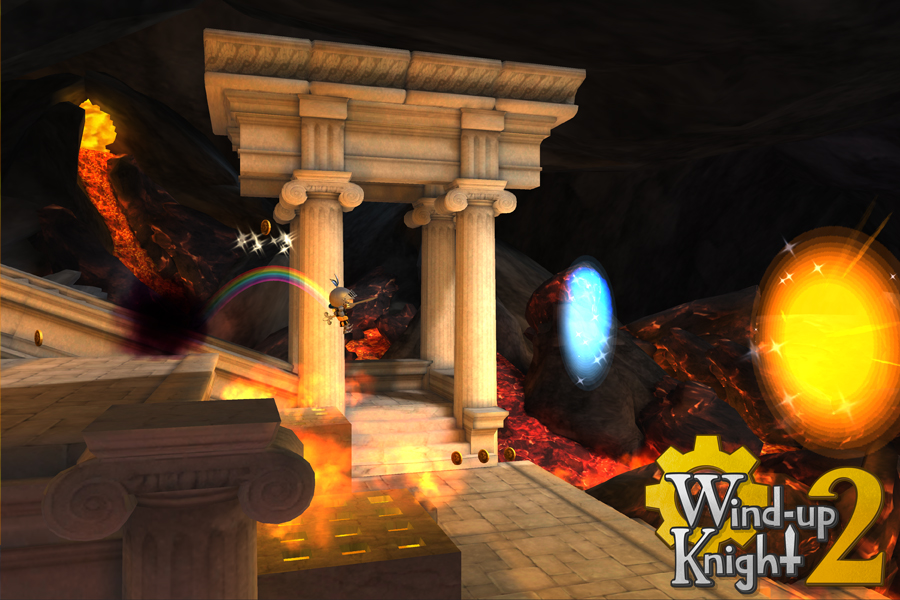
This scene is about 100 draw calls.
Our strategy for dealing with these problems also boil down to a few rules:
- Macrotexture everything. Macrotexturing is the process of using the smallest number of textures possible in the scene. The levels in Wind-up Knight 2 all fit into 4 1024×1024 textures. This is fast for a number of reasons, but one of the main benefits is that it allows us to batch all of the visible geometry using the same texture up into a single VBO and send it to the GPU all at once. Unity does a good job of this automatically with its dynamic batching option. Macrotexturing is hard, and it requires an artist with a lot of foresight, serious modeling skills, and a willingness to rework things to accommodate changes in the textures. But it’s absolutely worth it.
- Batch everything. In addition to dynamic batching based on material, we also try to combine meshes that we know won’t move. Unity calls this static batching, and it’s great for level geometry or other mesh elements that never move. Rather than making our scene static in the editor, we usually mark all objects that can be made static with a particular layer, then use Unity’s StaticBatchingUtility to combine static meshes at level load time. This increases load time a bit but dramatically reduces the size of our game binary.
- Control draw order. On a PC, you probably draw your scene from back to front, starting with a skybox and ending with the closest bits to the camera, followed by a pass for transparent objects or other items needing blending. On mobile, however, this incurs an unacceptable amount of overdraw. So we try to draw as much as possible front-to-back, with the skybox and other large objects that can potentially touch a large number of pixels on the screen drawn as the last step before transparent objects. Rejecting a pixel with a depth test is much faster than filling that pixel unnecessarily several times, so front-to-back for opaque geometry is a big win.
- Watch out for transparency. Transparency is, by definition, the process of filling a pixel more than one time. Therefore, on mobile, it’s very expensive to have large objects that covers part of the screen in semi-transparent pixels. Even worse is layers of transparency. You can get away with small small regions of the screen, but once a transparent object starts to touch a lot of pixels, the frame time cost will be high. We try to organize our transparent objects such that there is minimal overlap and that they take up as few pixels on the screen as possible.
- Design to scale. It’s hard to find a perfect balance between “looks good” and “runs fast” on mobile, mostly because there’s such a wide spectrum of power out there. A modern device like the Nexus 5 or iPhone 5 can push scenes that are orders of magnitude more complex than their predecessors from three or four years ago. Therefore, we design our scene such that we can tone down the graphics quality in exchange for performance on lower-end displays. We drop the highest texture mip on displays smaller than iPhone 4 resolution. We down-res the size of the final render target by 15% or 25% on very slow devices. We dynamically detect framerate changes and switch between pixel lights and spherical harmonics on the fly. These are easy to do if you are thinking about them early.
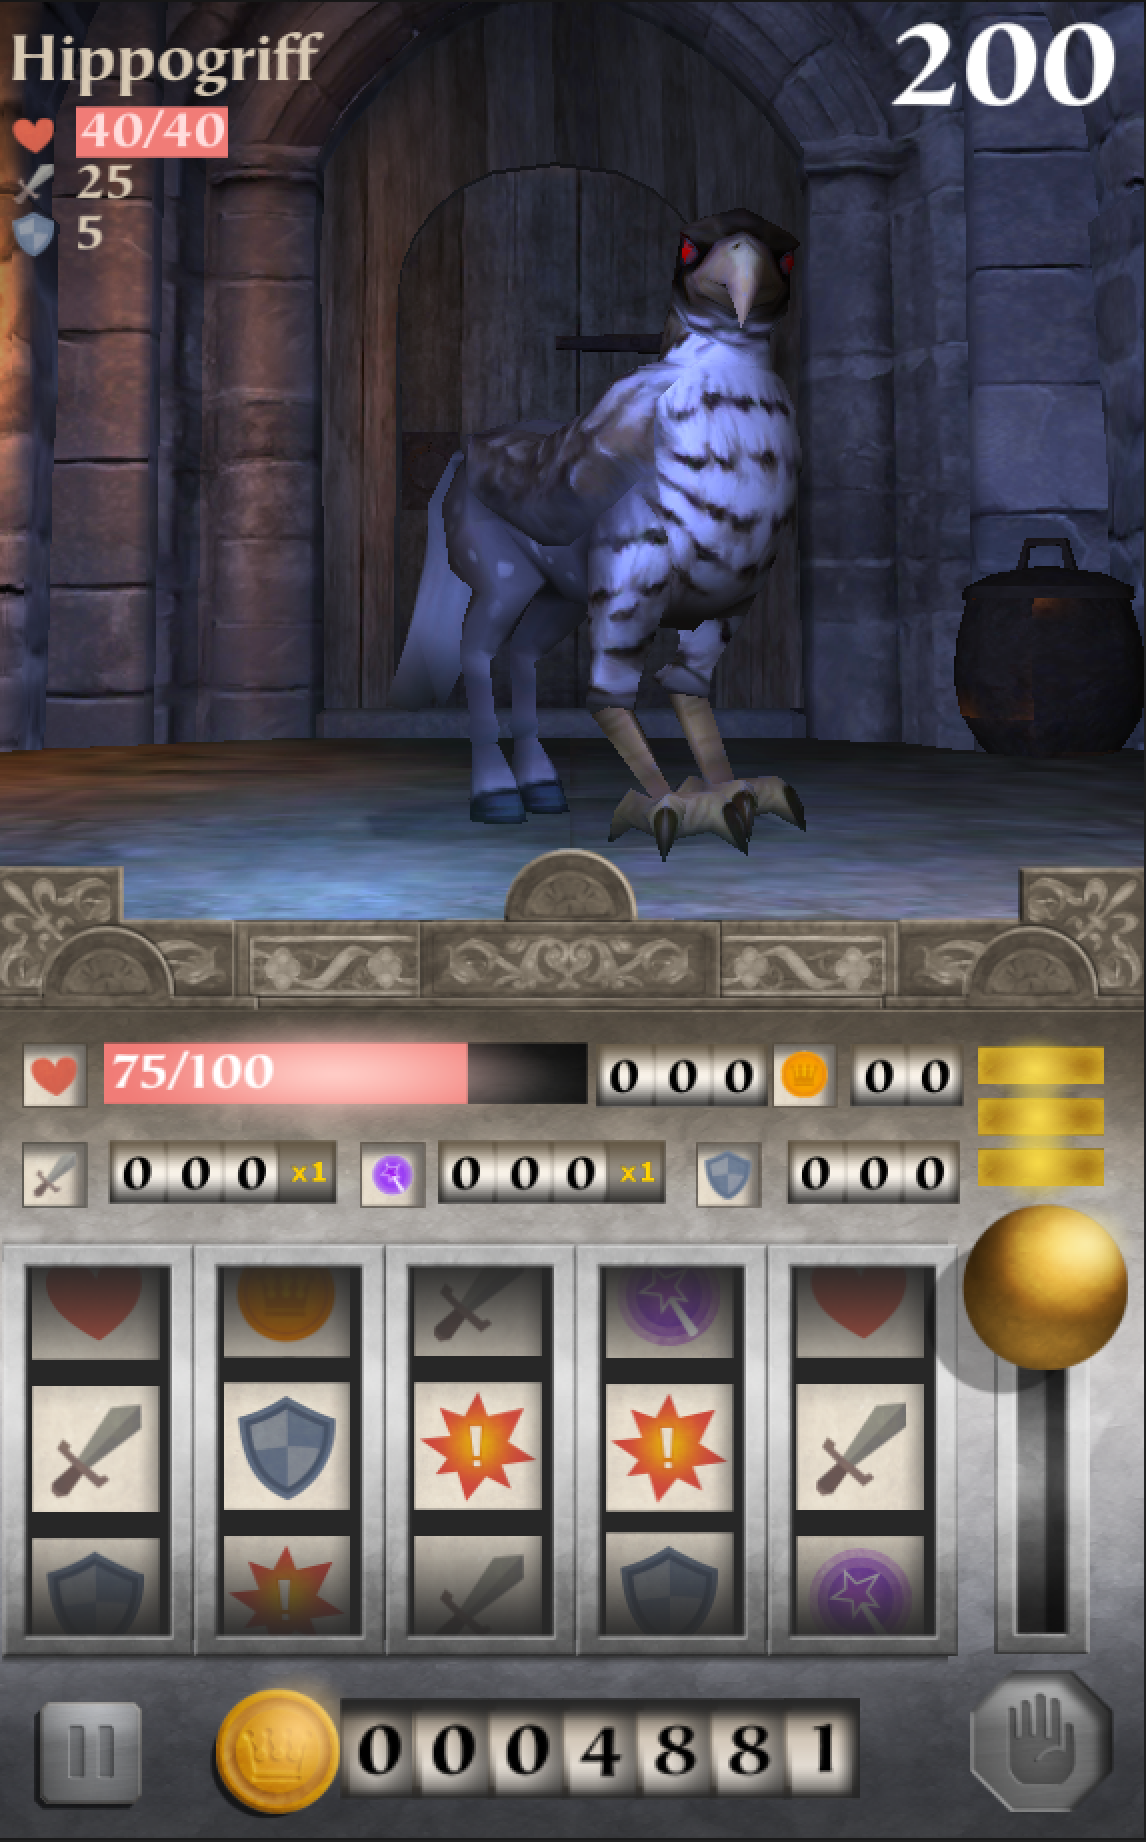
Dungeon Slots!
With those rules of thumb in mind, here’s how we optimized Dungeon Slots this week.
At the beginning of the week, Dungeon Slots ran great on a Nexus 5 and absolutely terribly on a 2012 Nexus 7. Now, the Nexus 7 is a few years old, but it’s still quite a bit more powerful than what we’d generally consider to be our minimum spec. The game was running at less than 15 fps on that device, and we needed to find out why.
The first thing I did was connect the Unity profiler to the device and look at the logs. The profiler is a bit flakey, especially in situations where the CPU is hosed, but we could see that some of our GUI code (managed by the NGUI framework) was spiking every frame. I looked at the scene we were rendering and noticed that it had been constructed out of a bunch of tiny sprites. NGUI does a good job of maintaining a single texture atlas for those sprites, and it collects them all into a single draw call every frame. But it also has to regenerate the verts for that draw call if anything in the scene (well, in NGUI terms, within the parent panel) changes. This game has a number of rotating slot-machine-like slots, both for the slot machine itself and for various numerical displays, and those were implemented with a bunch of sprites that were clipped into a small window. The main source of overhead, according to the profiler, was just updating the positions and clipping rectangles for all of those sprites every frame. The clip regions are pretty expensive, too.
We replaced the numerical displays with a system based on a scrolling texture, which increased our draw call count slightly but dramatically reduced the number of sprites that NGUI needed to manage. We also reorganized our NGUI panels such that bits of the scene that are static were separated from the bits that were animated to avoid unnecessary vertex buffer recreation. This change caused NGUI to drop a number of large notches in the profiler, and while it’s still a little more expensive than it should be, it’s no longer the focus of our attention.
Even with that change, however, the game was still running very slowly on the Nexus 7. The next step was to enable Unity’s internal profiler log and take a look at the output. That output looks something like this:
cpu-player> min: 102.8 max: 132.7 avg: 117.5
cpu-ogles-drv> min: 0.9 max: 3.0 avg: 1.5
cpu-present> min: 0.0 max: 1.0 avg: 0.1
frametime> min: 103.8 max: 135.0 avg: 119.1
draw-call #> min: 44 max: 44 avg: 44 | batched: 2
tris #> min: 82126 max: 122130 avg: 122126 | batched: 64
verts #> min: 83997 max: 124005 avg: 123998 | batched: 50
player-detail> physx: 1.1 animation: 0.8 culling 0.0 skinning: 0.0
               batching: 0.1 render: 8.1
               fixed-update-count: 5 .. 7
mono-scripts> update: 3.1 fixedUpdate: 0.0 coroutines: 0.0
mono-memory> used heap: 1900544 allocated heap: 2052096
             max number of collections: 0
             collection total duration: 0.0
What this told us was that the CPU was still hosed, but not by mono scripts. The incredibly high cpu-player time indicated that a lot of work was going on before the GPU even got any verts to draw. The OMGWTFBBQ moment came when we noticed that the vertex and triangle count were averaging in the ~100k tris / frame, way over our target of 30k.
Switching back to the Unity editor, the Stats overlay window told the same story: our simple scene was pushing way more polygons than we expected. After some investigation we realized that while the meshes in the scene itself were right on target in terms of complexity, we’d started using a standard diffuse shader on them in order to achieve certain lighting effects. Unity’s Mobile Diffuse shader only supports one directional light, but the stock Diffuse shader supports any number of pixel lights. What was happening here is that our geometry was being submitted many times over, once for each light source that touched it, which caused our triangle count to skyrocket and our CPU to collapse. I modified the setup to use only the faster Mobile Diffuse shader. This fixed our crazy triangle load but removed the neat lighting effects in the process.
Still, it was probably worth it: the game had gone from about 10 fps when we started to about 22 fps via these changes. That’s a savings of about 35 ms per frame, which is pretty significant. Still, 22 fps remains way too slow.
To delve deeper into where our frame time was going, I decided to bust out the big guns. NVIDIA produces a neat performance tool called PerfHUD ES, which allows you to connect to an Android-based dev kit and get detailed profiling information about the scene you are rendering. I have an ancient Tegra 2 dev kit that I got from NVIDIA years ago, and it’s fantastic for this kind of performance testing precisely because it’s pretty slow by modern standards. Getting it to work requires a little dance of shell scripts, adb port forwarding, and prayers to various moon gods. The process has been much improved by NVIDIA in more recent kits, but I like the old one because its performance characteristics are so easy to understand.

A shot from NVIDIA’s PerfHUD ES showing that our transparent particle fog touches a lot more pixels than we intended.
The best thing about PerfHUD is that it can show you a step-by-step rendering of how your scene is put together by the hardware, draw call by draw call. This tool, combined with timing information about each draw call, is usually more than enough to identify performance culprits. When I ran Dungeon Slots through PerfHUD’s frame analyzer, I learned two important things:
- Though the UI completely covers the bottom half of the screen, we were rending the 3D world underneath it. That’s overdrawing 50% of the pixels on the screen!
- A transparent particle effect we place on the ground in front of the camera was actually much larger than we anticipated, and most of it was hidden behind the UI. More overdraw!
Once identified, these are easy problems to solve. The first step was to just reduce the size of the 3D camera’s viewport to cover only half the screen. This way the bottom half has no overdraw from frame to frame. That also cut the size of the particle effect in half. Even so, subsequent profiling showed that the particle effect was still touching too many pixels to be performant on an older device with a big screen like the Tegra 2 dev kit. It needed to be turned off entirely. With these changes, the game now runs at 60 fps on the Nexus 7, and at a very respectable 30 fps on the ancient dev kit. We lost a few graphical effects in the process (some animated lighting and a particle effect), but overall the game still looks good, and now will run well on devices we consider to be our minimum spec.

Still, it’s tough to play the game without those extra effects now that we’ve gotten used to them being there. A player who’s never seen them before won’t miss them, but there’s no denying that the game looks more dynamic, more interesting, and more polished with all the extras turned on. And after all, the Nexus 5 ran Dungeon Slots at full speed even before we started with all of this optimization. It sucks that folks with high-end devices get a degraded experience simply because there are also lots of low-end devices out there.
But maybe they don’t have to after all. The last change I made this week was to add code that samples the framerate as the player plays their first round of monster-slashing slot madness. If the device is performing well, over 50 fps, I go ahead and turn the particle effects back on and change the shaders back to Diffuse for full lighting. In my tests, this produces a good middle ground: the game runs fast for everybody, and high-end devices get the extra graphical whiz-bang polish features as well.
We’ve still got a little bit of work to do before Dungeon Slots is ready to go, but you should be able to play it soon.


 2352
2352

 被折叠的 条评论
为什么被折叠?
被折叠的 条评论
为什么被折叠?
 到【灌水乐园】发言


