


了解
通过获取某个文件夹中的csv表格,表格为这个格式。
0,500
1,1000
2,3000
3,5000
4,9000
...
则设置0-...为x轴,假设是回合,然后后面是每回合的金钱数。
则我们获取了所有的相关表格后就可以做动画,同时为了可重复使用,做了一个简单的按钮:
然后x轴会根据回合数量的增加而增加
y轴会根据出现的数据里面的最大值来更改y轴的轴线
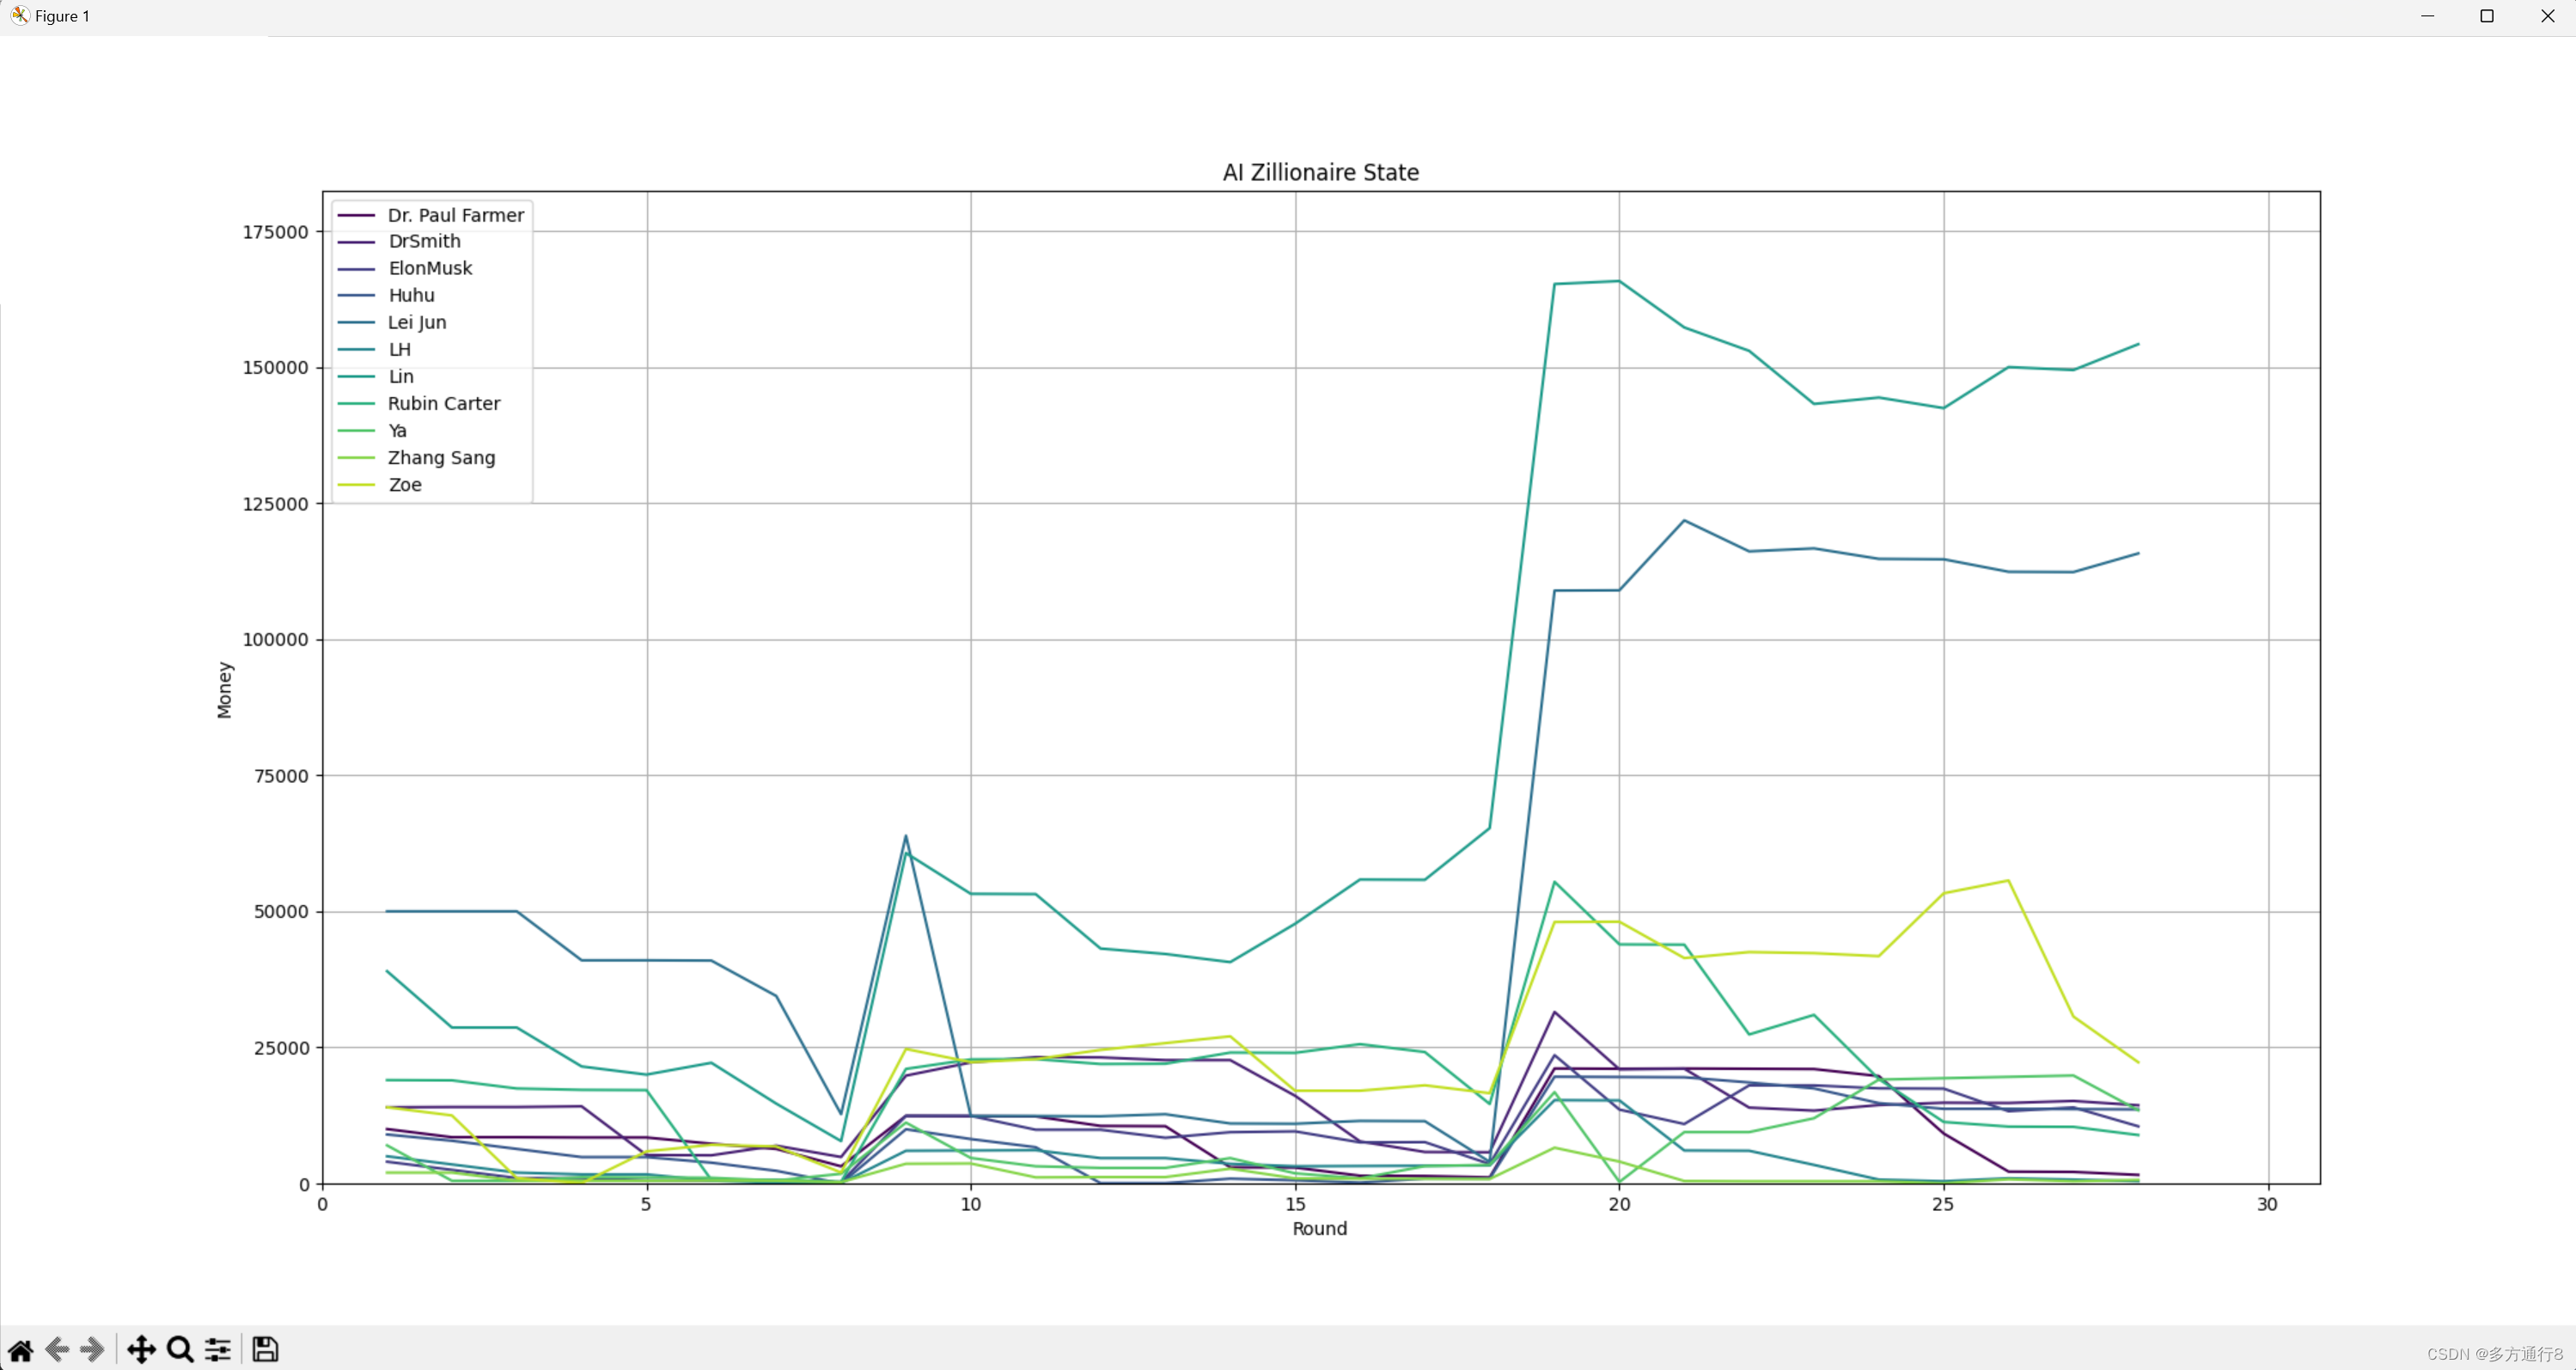
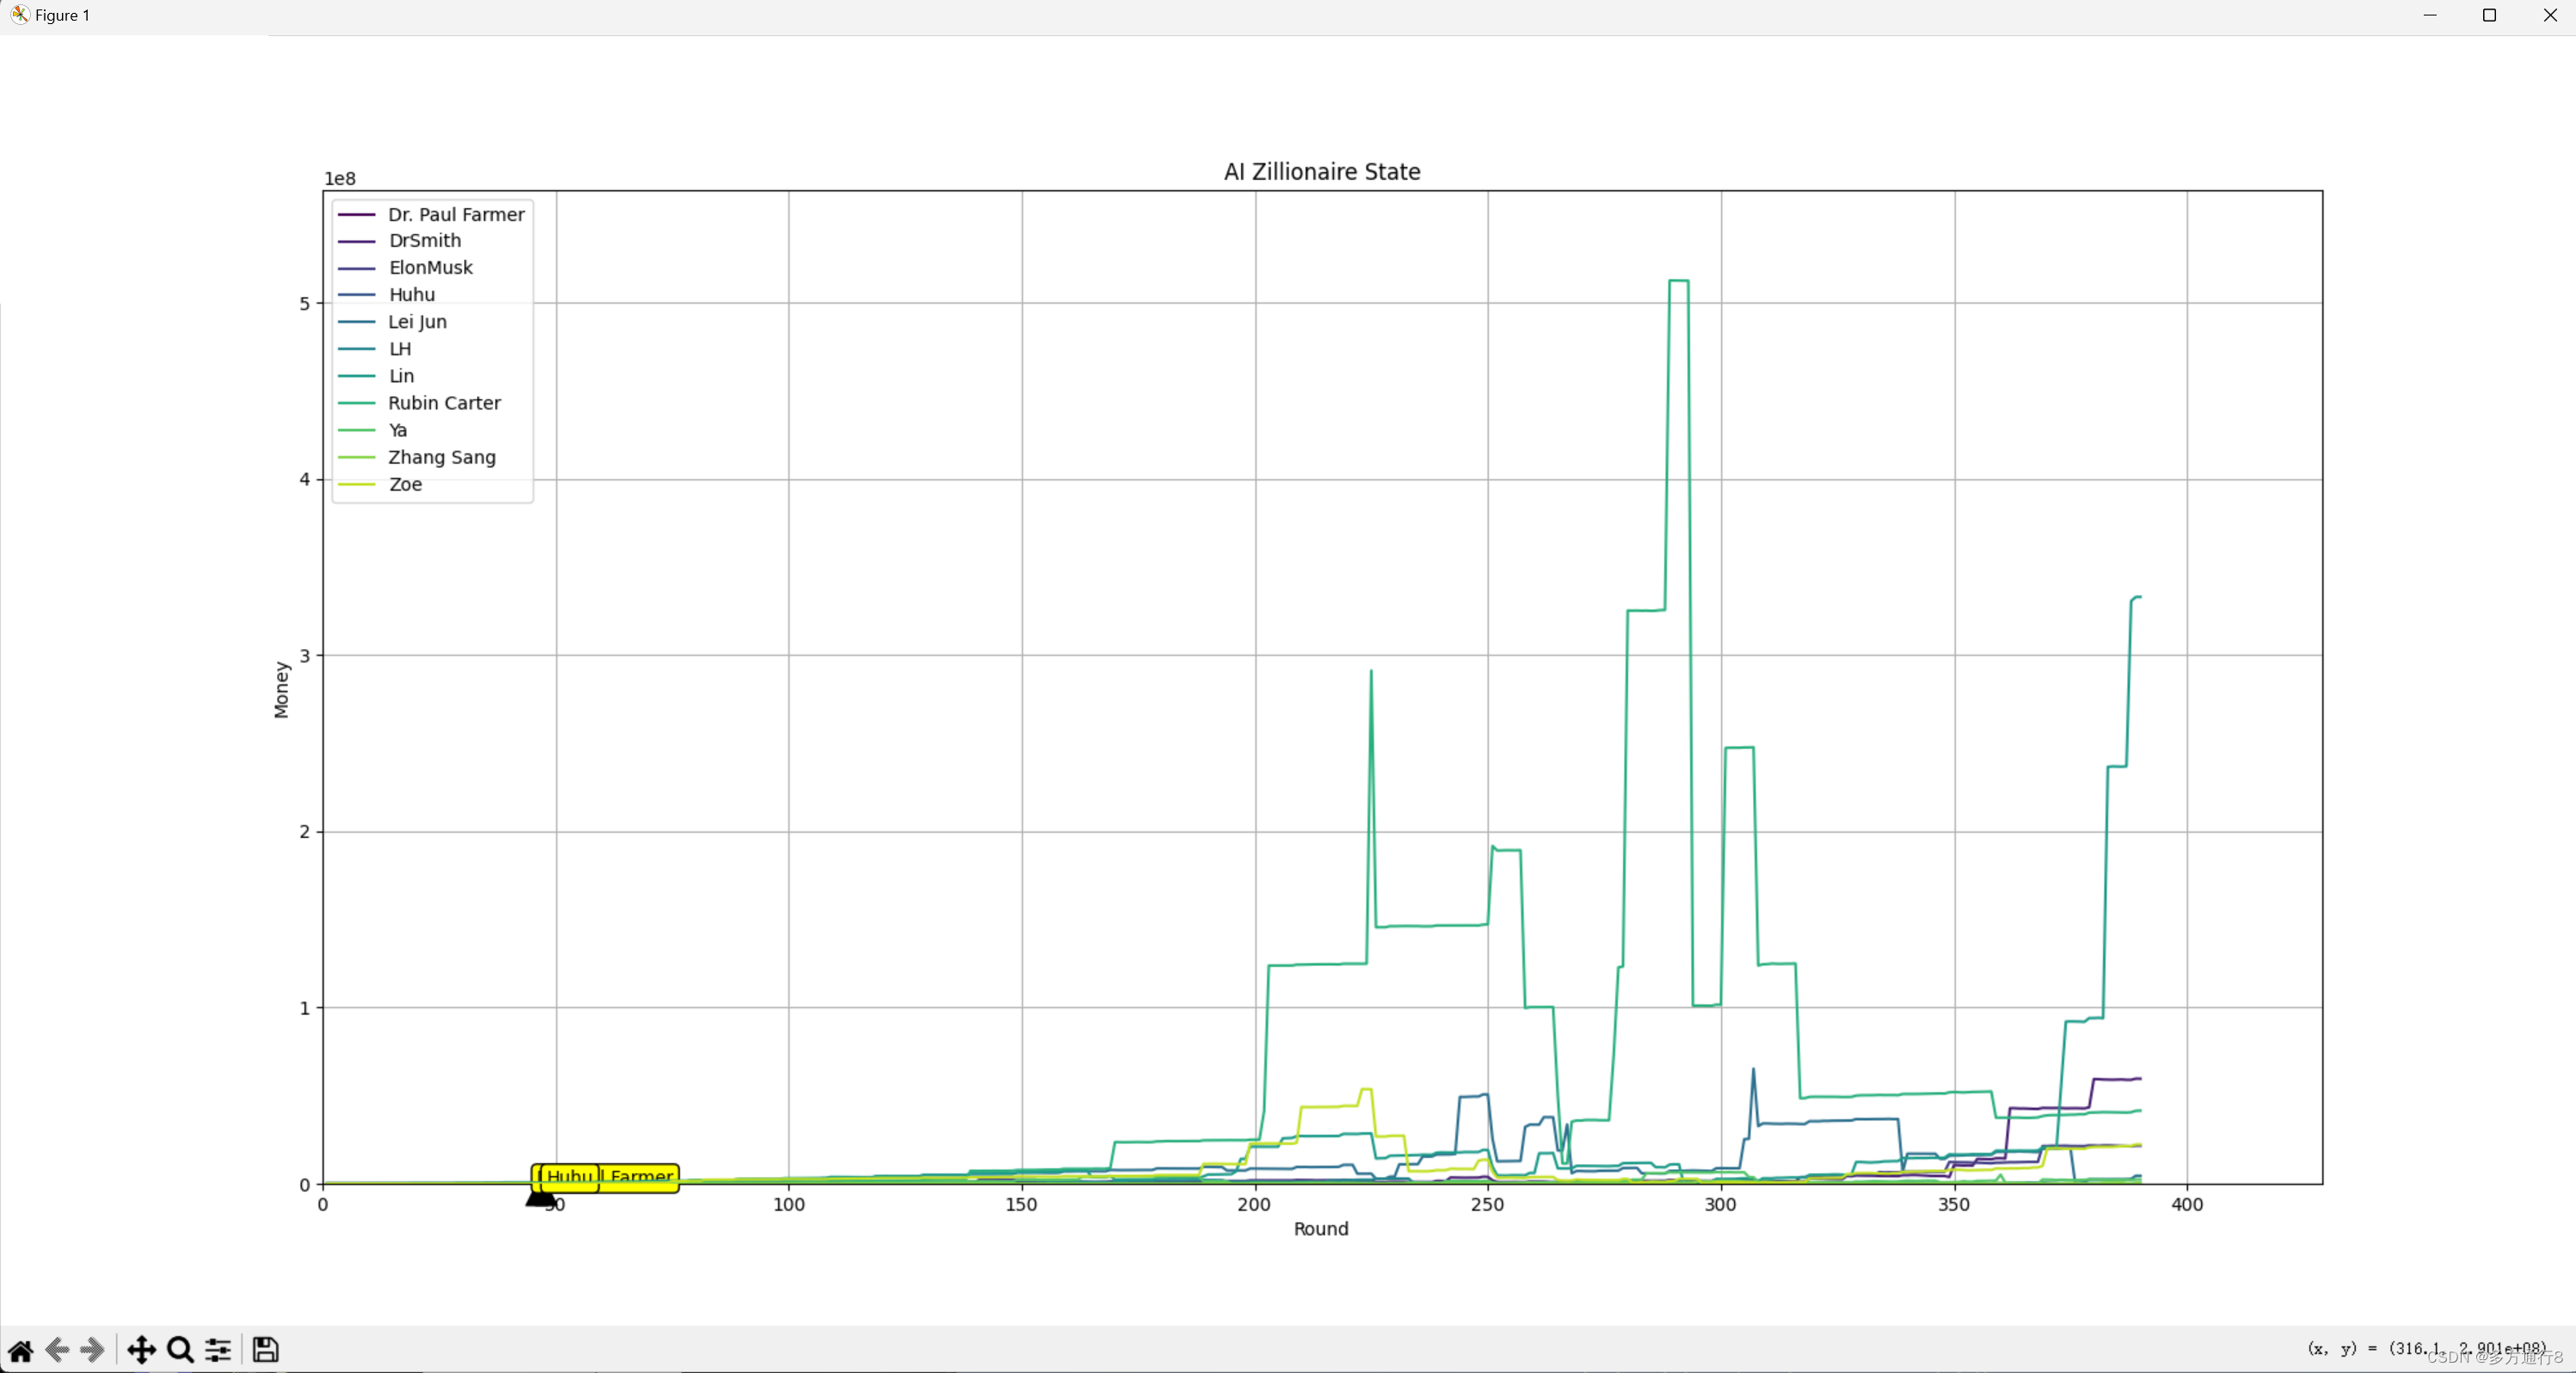
如果数据表格提前结束,则在结束位置生成对应标签
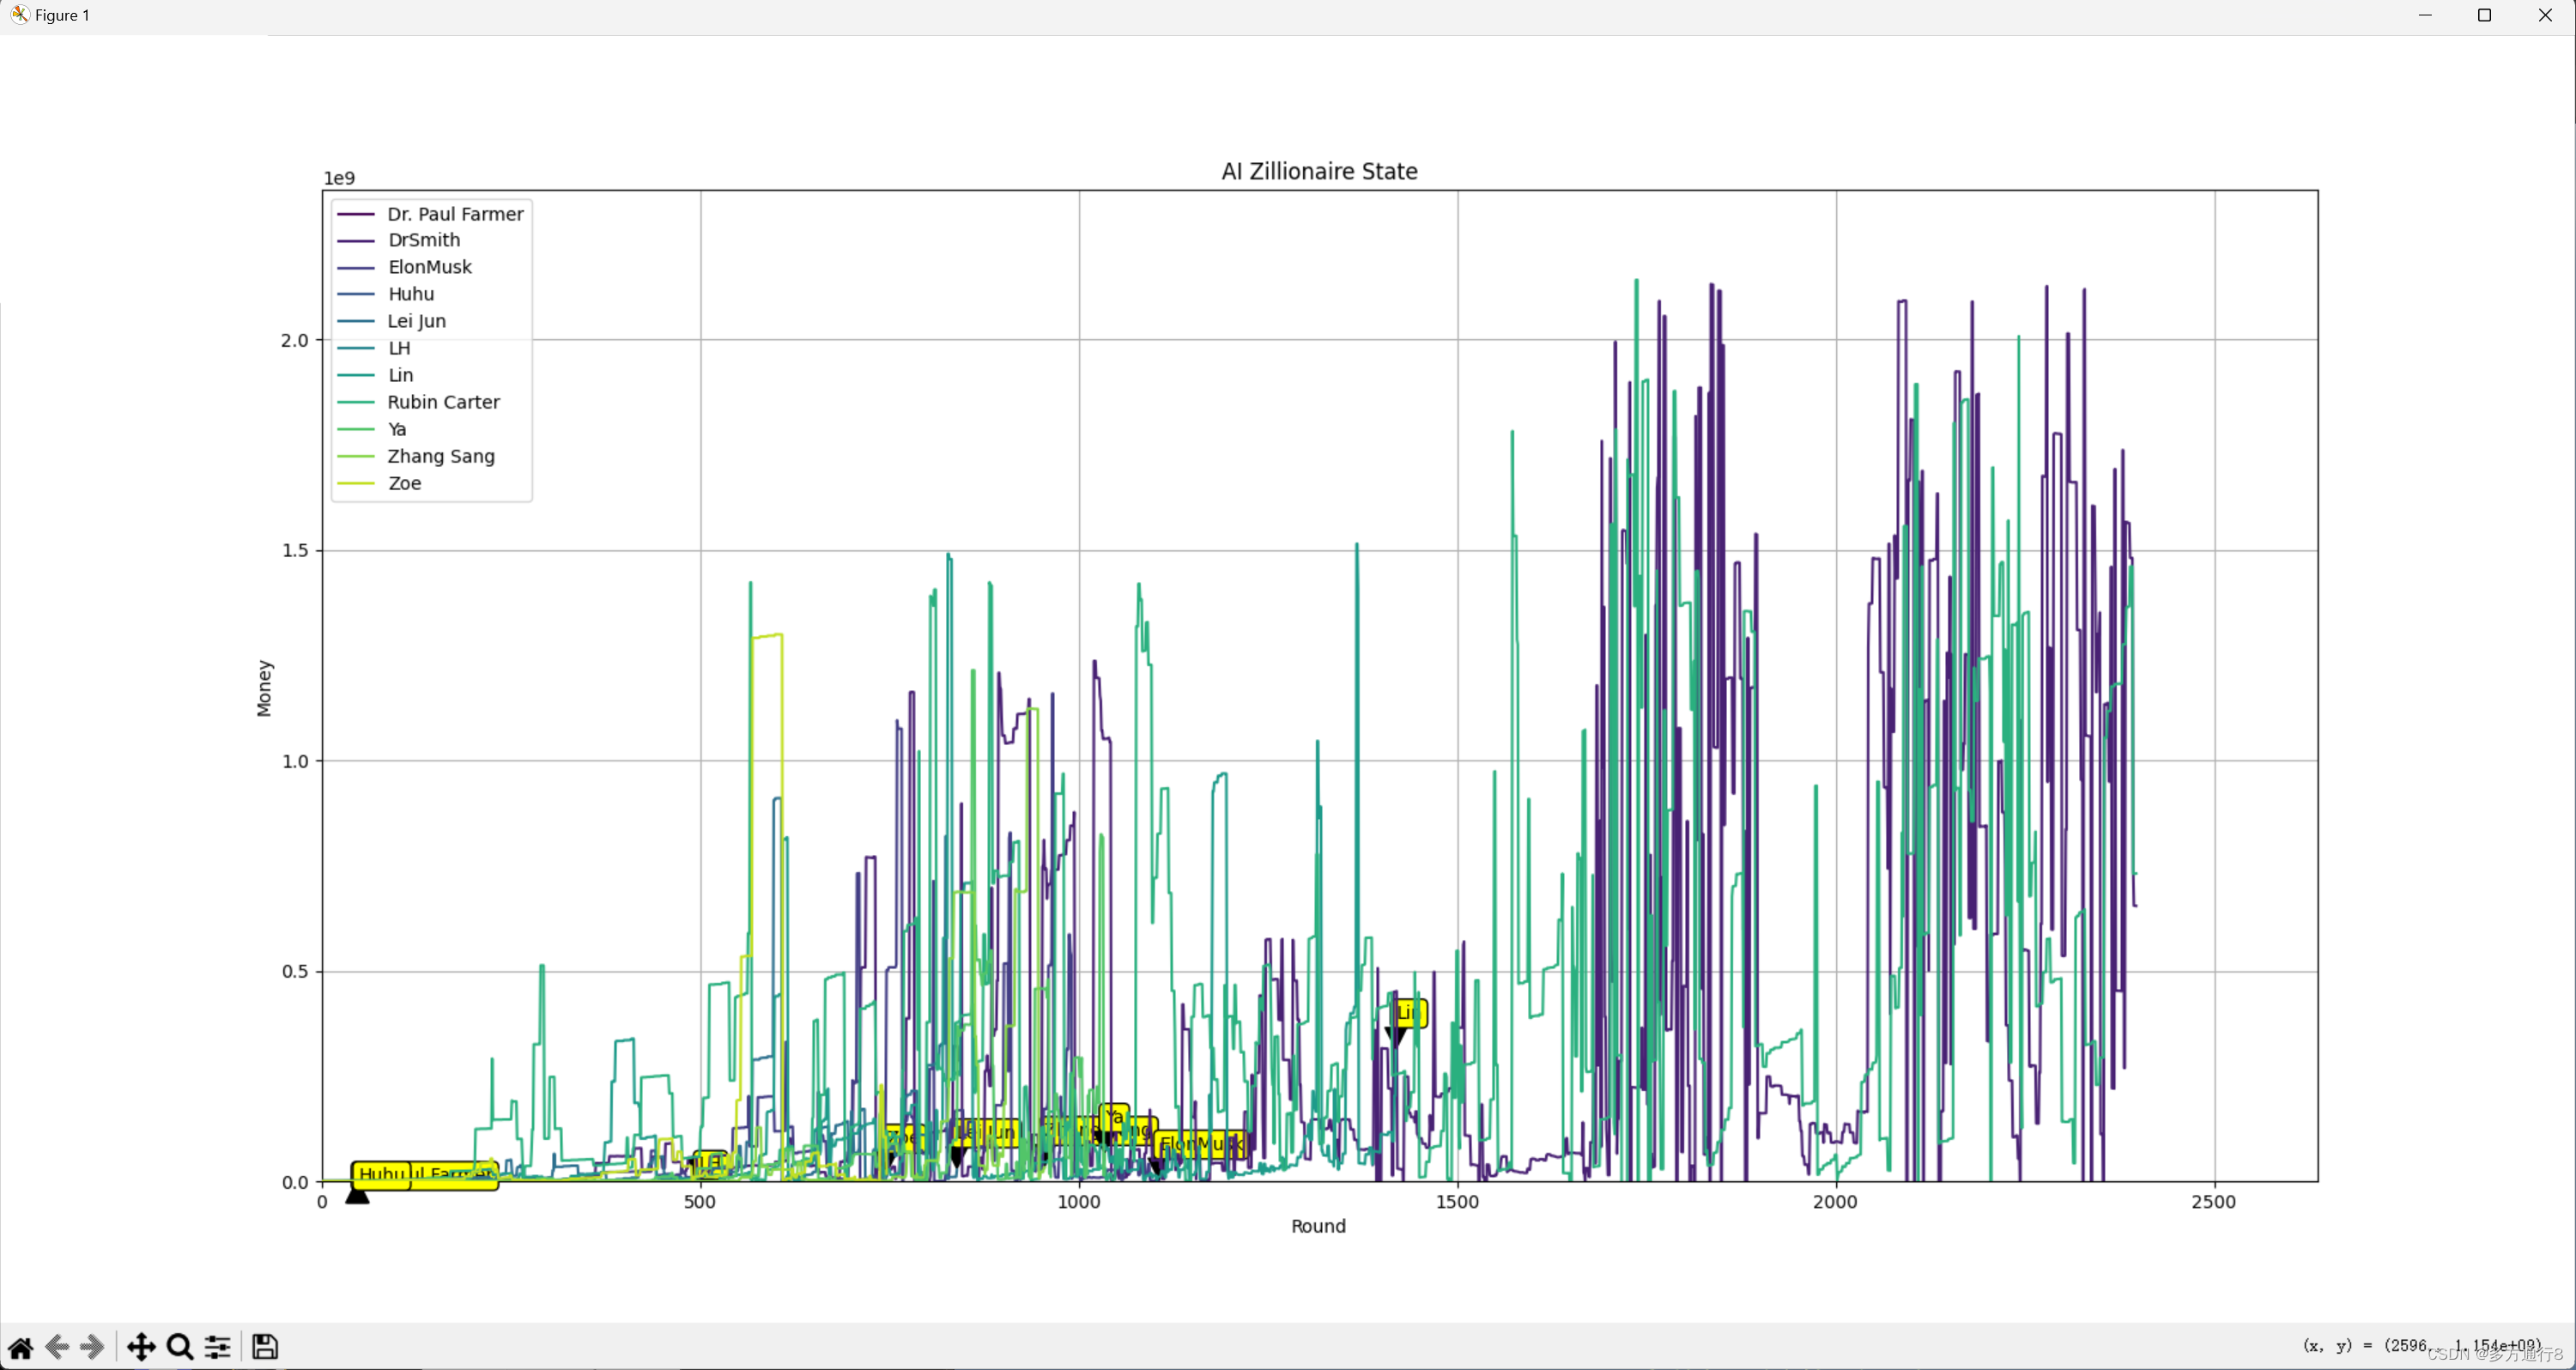
流动性的从左到右出现的动画就做好了。
代码:
import os
import pandas as pd
import matplotlib.pyplot as plt
from matplotlib.animation import FuncAnimation
from tkinter import Tk, Button, filedialog, messagebox
import time

# 初始化 Tkinter
root = Tk()
root.title("Data Table Look")
root.geometry("200x200")

def select_folder():
    global anim, all_data, lines, ax, fig, max_y_seen, end_positions

    # 打开文件夹选择对话框
    folder_path = filedialog.askdirectory()

    # 如果选择了文件夹
    if folder_path:
        # 检索文件夹中的所有.csv文件(不包括子文件夹)
        csv_files = [f for f in os.listdir(folder_path) if f.endswith('.csv') and os.path.isfile(os.path.join(folder_path, f))]

        # 如果没有找到CSV文件,弹出提示消息框
        if not csv_files:
            messagebox.showinfo("提示", "该文件夹下没有CSV文件")
            return

        # 重新初始化存储所有数据的列表
        all_data = []

        # 读取每个.csv文件,并添加到all_data列表中
        for csv_file in csv_files:
            df = pd.read_csv(os.path.join(folder_path, csv_file))
            df.columns = ['Round', 'Money']  # 假设csv文件中的第一列是回合数,第二列是金额
            all_data.append(df)

        # 如果已经有图表,关闭它
        plt.close('all')

        # 加入延时以确保图表完全关闭
        time.sleep(0.1)
        root.update_idletasks()  # 刷新Tkinter事件循环

        # 重新初始化绘图
        fig, ax = plt.subplots(figsize=(20, 10))
        lines = []
        end_positions = []

        for i, df in enumerate(all_data):
            label = os.path.splitext(csv_files[i])[0]  # 去除文件扩展名
            line, = ax.plot([], [], color=plt.cm.viridis(i / len(csv_files)), label=label)
            lines.append(line)

        # 设置初始的y轴和x轴范围
        ax.set_ylim(0, 1)  # 初始y轴范围
        ax.set_xlim(0, 1)  # 初始x轴范围
        ax.grid(True)  # 添加网格
        plt.legend(loc='upper left')  # 添加图例
        plt.title('AI Zillionaire State')  # 添加标题
        plt.xlabel('Round')  # 添加x轴标签
        plt.ylabel('Money')  # 添加y轴标签

        # 动画初始化函数
        def init():
            for line in lines:
                line.set_data([], [])
            return lines

        # 初始化已经出现的最大y值
        max_y_seen = 0
        # 获取最长的DataFrame的长度作为动画的帧数
        max_frames = max(len(df) for df in all_data)

        # 标注最后位置的函数
        def annotate_end_positions():
            for x, y, label in end_positions:
                ax.annotate(label, xy=(x, y), xytext=(x, y + 0.05 * max_y_seen),
                            arrowprops=dict(facecolor='black', shrink=0.05),
                            bbox=dict(boxstyle="round,pad=0.3", edgecolor="black", facecolor="yellow"))

        # 动画更新函数
        def update(frame):
            global max_y_seen, end_positions
            max_x = 0
            end_positions = []
            for line, df in zip(lines, all_data):
                if frame < len(df):
                    line.set_data(df['Round'][:frame + 1], df['Money'][:frame + 1])
                    max_x = max(max_x, df['Round'][frame])
                    max_y_seen = max(max_y_seen, df['Money'][:frame + 1].max())
                if frame == len(df) -1:
                    end_positions.append((df['Round'][frame], df['Money'][frame], line.get_label()))
                    annotate_end_positions()
            ax.set_xlim(0, max_x * 1.1)
            ax.set_ylim(0, max_y_seen * 1.1)
            fig.canvas.draw()  # 更新图表
            return lines

        # 创建动画
        anim = FuncAnimation(fig, update, frames=range(max_frames), init_func=init, blit=True, interval=1, repeat=False)

        # 显示图表
        plt.show()

# 创建并配置按钮
button = Button(text="选择文件夹", command=select_folder)
button.pack()

# 启动 Tkinter 主循环
root.mainloop()


 296
296

 被折叠的 条评论
为什么被折叠?
被折叠的 条评论
为什么被折叠?
 到【灌水乐园】发言


