


桓峰基因公众号推出单细胞生信分析教程并配有视频在线教程,目前整理出来的相关教程目录如下:
SCS【4】单细胞转录组数据可视化分析 (Seurat 4.0)
SCS【6】单细胞转录组之细胞类型自动注释 (SingleR)
SCS【7】单细胞转录组之轨迹分析 (Monocle 3) 聚类、分类和计数细胞
SCS【8】单细胞转录组之筛选标记基因 (Monocle 3)
SCS【9】单细胞转录组之构建细胞轨迹 (Monocle 3)
SCS【10】单细胞转录组之差异表达分析 (Monocle 3)
SCS【11】单细胞ATAC-seq 可视化分析 (Cicero)
SCS【12】单细胞转录组之评估不同单细胞亚群的分化潜能 (Cytotrace)
SCS【13】单细胞转录组之识别细胞对“基因集”的响应 (AUCell)
SCS【15】细胞交互:受体-配体及其相互作用的细胞通讯数据库 (CellPhoneDB)
SCS【16】从肿瘤单细胞RNA-Seq数据中推断拷贝数变化 (inferCNV)
SCS【17】从单细胞转录组推断肿瘤的CNV和亚克隆 (copyKAT)
SCS【18】细胞交互:受体-配体及其相互作用的细胞通讯数据库 (iTALK)
SCS【21】单细胞空间转录组可视化 (Seurat V5)
SCS【22】单细胞转录组之 RNA 速度估计 (Velocyto.R)
SCS【24】单细胞数据量化代谢的计算方法 (scMetabolism)
这期继续介绍细胞通讯分析,CellChat第一部分细胞通讯可视化,下期继续介绍细胞通讯分析具体内容。
简介
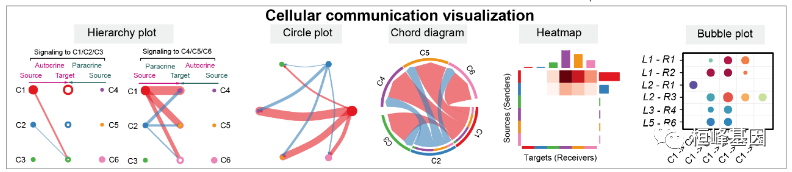
理解细胞间的全球通信需要准确地表示细胞信号传导链路并对这些链路进行有效的系统级分析。我们构建了一个数据库的相互作用之间的配体,受体和他们的辅助因子,准确地代表了已知的异质分子复合物。然后,我们开发了CellChat,这是一种能够从单细胞RNA测序(scRNA-seq)数据定量推断和分析细胞间通信网络的工具。CellChat预测细胞的主要信号输入和输出,以及这些细胞和信号如何使用网络分析和模式识别方法协调功能。通过多种学习和定量对比,CellChat对信号通路进行分类,并在不同的数据集上描绘出保守的和特定于环境的通路。将CellChat应用于小鼠和人类皮肤数据集显示其提取复杂信号模式的能力。我们的多功能和易于使用的工具包CellChat和基于网络的浏览器(http://www.cellchat.org/)将有助于发现新的细胞间通信和建立不同组织的细胞-细胞通信图谱。

软件包安装
正常安装即可:
install.packages("ggalluvial")
install.packages("expm")
install.packages("sna")
install.packages('NMF')
devtools::install_github("jokergoo/circlize")
devtools::install_github("jokergoo/ComplexHeatmap")
devtools::install_github("sqjin/CellChat")
数据读取
CellChat需要两个用户输入:
细胞的基因表达数据,
用户分配的细胞标签(即基于标签的模式)或单细胞数据的低维表示(即无标签模式)。
对于后者,CellChat通过在低维空间或伪时间轨迹空间中基于细胞-细胞距离构建共享邻居图来自动对细胞进行分组。
对于基因表达数据矩阵,基因应该以行命名,细胞应该以列命名。归一化数据(例如,库大小归一化,然后用伪计数1进行对数转换)需要作为CellChat分析的输入。如果提供计数数据,我们提供一个normalizeData函数来考虑库大小,然后进行log转换。对于单细胞组信息,需要一个带有行名的数据框作为CellChat的输入。
library(patchwork)
library(Seurat)
options(Seurat.object.assay.version = "v3")
library(CellChat)load("data_humanSkin_CellChat.rda")
data.input = data_humanSkin$data # normalized data matrix
meta = data_humanSkin$meta # a dataframe with rownames containing cell mata data
cell.use = rownames(meta)[meta$condition == "LS"] # extract the cell names from disease data
# Prepare input data for CelChat analysis
data.input = data.input[, cell.use]
meta = meta[cell.use, ]
# meta = data.frame(labels = meta$labels[cell.use], row.names = colnames(data.input)) # manually create a dataframe consisting of the cell labels
unique(meta$labels) # check the cell labels## [1] Inflam. FIB FBN1+ FIB APOE+ FIB COL11A1+ FIB cDC2
## [6] LC Inflam. DC cDC1 CD40LG+ TC Inflam. TC
## [11] TC NKT
## 12 Levels: APOE+ FIB FBN1+ FIB COL11A1+ FIB Inflam. FIB cDC1 cDC2 ... NKT实例操作
第一部分:CellChat对象的数据输入、处理和初始化
创建一个CellChat对象
cellchat <- createCellChat(object = data.input, meta = meta, group.by = "labels")## [1] "Create a CellChat object from a data matrix"
## Set cell identities for the new CellChat object
## The cell groups used for CellChat analysis are APOE+ FIB FBN1+ FIB COL11A1+ FIB Inflam. FIB cDC1 cDC2 LC Inflam. DC TC Inflam. TC CD40LG+ TC NKT将单细胞信息添加到对象中
cellchat <- addMeta(cellchat, meta = meta)
cellchat <- setIdent(cellchat, ident.use = "labels") # set "labels" as default cell identity
levels(cellchat@idents) # show factor levels of the cell labels
## [1] "APOE+ FIB" "FBN1+ FIB" "COL11A1+ FIB" "Inflam. FIB" "cDC1"
## [6] "cDC2" "LC" "Inflam. DC" "TC" "Inflam. TC"
## [11] "CD40LG+ TC" "NKT"groupSize <- as.numeric(table(cellchat@idents)) # number of cells in each cell group设置配体-受体相互作用数据库
CellChatDB <- CellChatDB.human # use CellChatDB.mouse if running on mouse data
showDatabaseCategory(CellChatDB)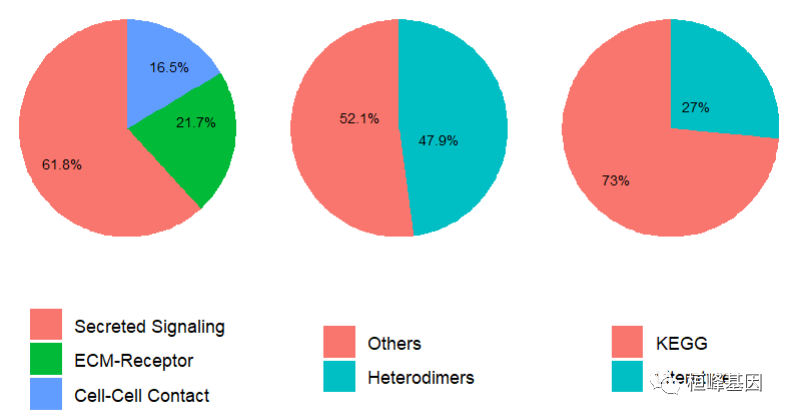
dplyr::glimpse(CellChatDB$interaction)## Rows: 1,939
## Columns: 11
## $ interaction_name <chr> "TGFB1_TGFBR1_TGFBR2", "TGFB2_TGFBR1_TGFBR2", "TGFB…
## $ pathway_name <chr> "TGFb", "TGFb", "TGFb", "TGFb", "TGFb", "TGFb", "TG…
## $ ligand <chr> "TGFB1", "TGFB2", "TGFB3", "TGFB1", "TGFB1", "TGFB2…
## $ receptor <chr> "TGFbR1_R2", "TGFbR1_R2", "TGFbR1_R2", "ACVR1B_TGFb…
## $ agonist <chr> "TGFb agonist", "TGFb agonist", "TGFb agonist", "TG…
## $ antagonist <chr> "TGFb antagonist", "TGFb antagonist", "TGFb antagon…
## $ co_A_receptor <chr> "", "", "", "", "", "", "", "", "", "", "", "", "",…
## $ co_I_receptor <chr> "TGFb inhibition receptor", "TGFb inhibition recept…
## $ evidence <chr> "KEGG: hsa04350", "KEGG: hsa04350", "KEGG: hsa04350…
## $ annotation <chr> "Secreted Signaling", "Secreted Signaling", "Secret…
## $ interaction_name_2 <chr> "TGFB1 - (TGFBR1+TGFBR2)", "TGFB2 - (TGFBR1+TGFBR2)…CellChatDB.use <- subsetDB(CellChatDB, search = "Secreted Signaling") # use Secreted Signaling
# set the used database in the object
cellchat@DB <- CellChatDB.use预处理细胞-细胞通讯分析的表达数据
# subset the expression data of signaling genes for saving computation cost
cellchat <- subsetData(cellchat) # This step is necessary even if using the whole database
future::plan("multicore", workers = 1) # do parallel
cellchat <- identifyOverExpressedGenes(cellchat)
cellchat <- identifyOverExpressedInteractions(cellchat)
第二部分:细胞-细胞通信网络的推论
计算通信概率,推断细胞通信网络
cellchat <- computeCommunProb(cellchat)## triMean is used for calculating the average gene expression per cell group.
## [1] ">>> Run CellChat on sc/snRNA-seq data <<< [2023-05-12 16:33:22]"
## [1] ">>> CellChat inference is done. Parameter values are stored in `object@options$parameter` <<< [2023-05-12 16:35:57]"cellchat <- filterCommunication(cellchat, min.cells = 10)在信号通路水平推断细胞间的通讯
cellchat <- computeCommunProbPathway(cellchat)计算聚合细胞-细胞通信网络
cellchat <- aggregateNet(cellchat)
groupSize <- as.numeric(table(cellchat@idents))
par(mfrow = c(1,2), xpd=TRUE)
netVisual_circle(cellchat@net$count, vertex.weight = groupSize, weight.scale = T, label.edge= F, title.name = "Number of interactions")
netVisual_circle(cellchat@net$weight, vertex.weight = groupSize, weight.scale = T, label.edge= F, title.name = "Interaction weights/strength")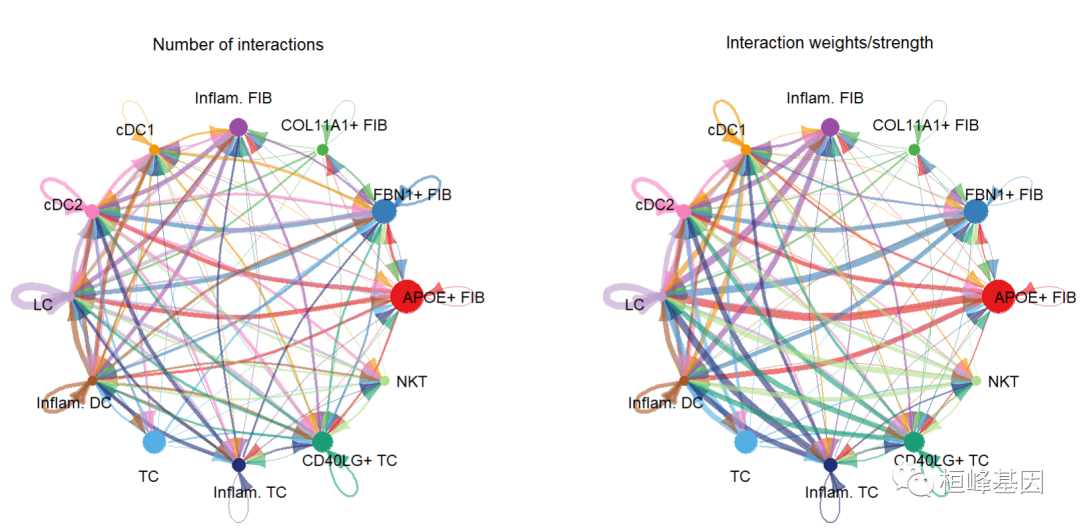
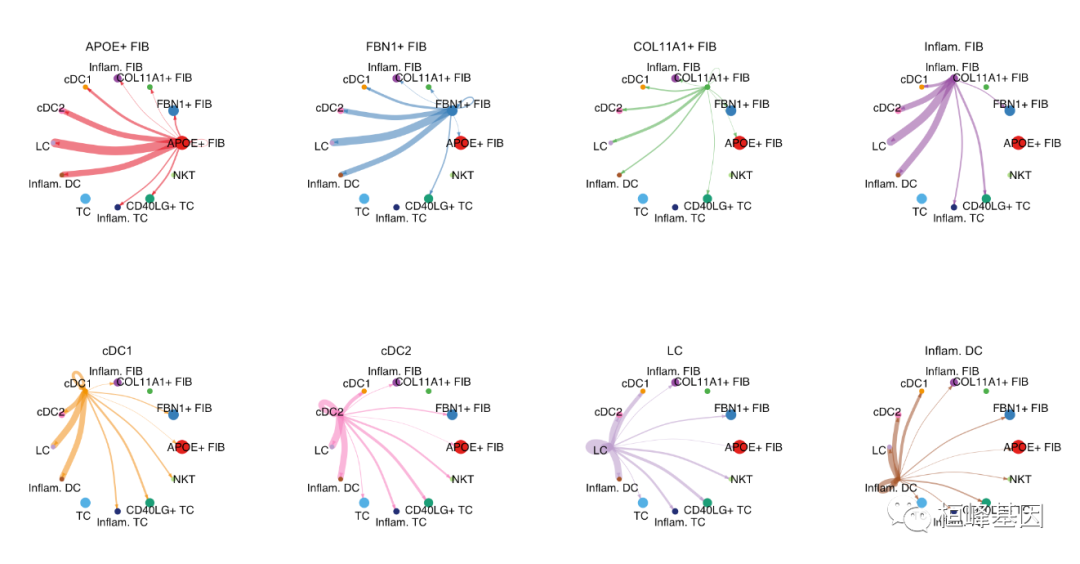
由于复杂的细胞-细胞通信网络,我们可以检查从每个细胞群发送的信号。这里我们还控制参数edge.weight.max,以便我们可以比较不同网络之间的边权重。
mat <- cellchat@net$weight
par(mfrow = c(3,4), xpd=TRUE)
for (i in 1:nrow(mat)) {
  mat2 <- matrix(0, nrow = nrow(mat), ncol = ncol(mat), dimnames = dimnames(mat))
  mat2[i, ] <- mat[i, ]
  netVisual_circle(mat2, vertex.weight = groupSize, weight.scale = T, edge.weight.max = max(mat), title.name = rownames(mat)[i])
}
第三部分:细胞-细胞通信网络的可视化
Hierarchy plot
pathways.show <- c("CXCL")
# Here we define `vertex.receive` so that the left portion of the hierarchy plot shows signaling to fibroblast and the right portion shows signaling to immune cells
vertex.receiver = seq(1,4) # a numeric vector.
netVisual_aggregate(cellchat, signaling = pathways.show,  vertex.receiver = vertex.receiver)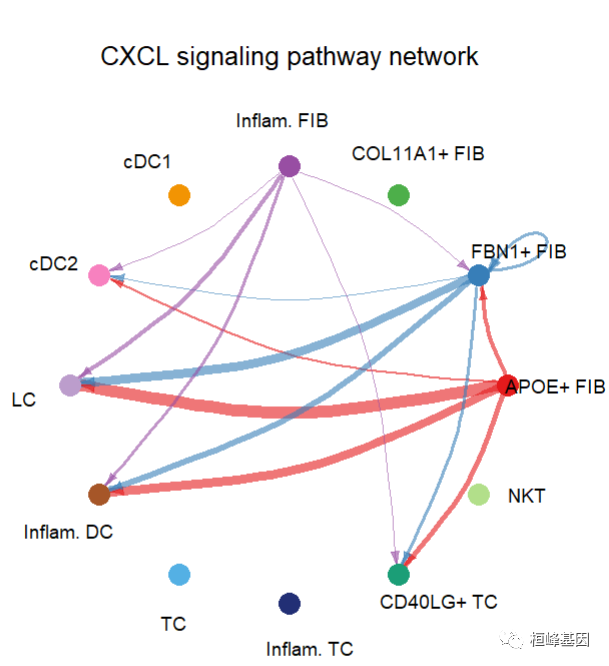
Circle plot
par(mfrow=c(1,1))
netVisual_aggregate(cellchat, signaling = pathways.show, layout = "circle")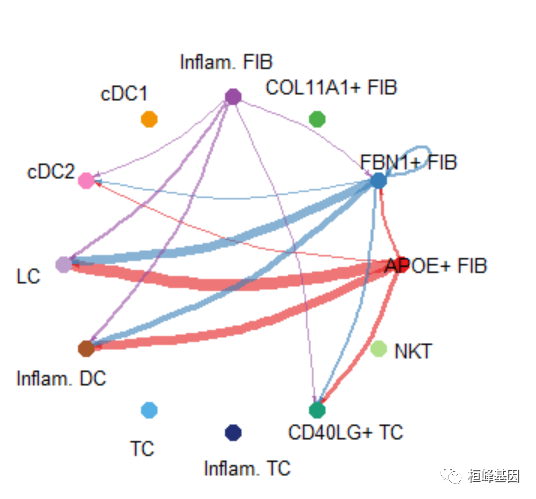
# Chord diagram
par(mfrow=c(1,1))
netVisual_aggregate(cellchat, signaling = pathways.show, layout = "chord")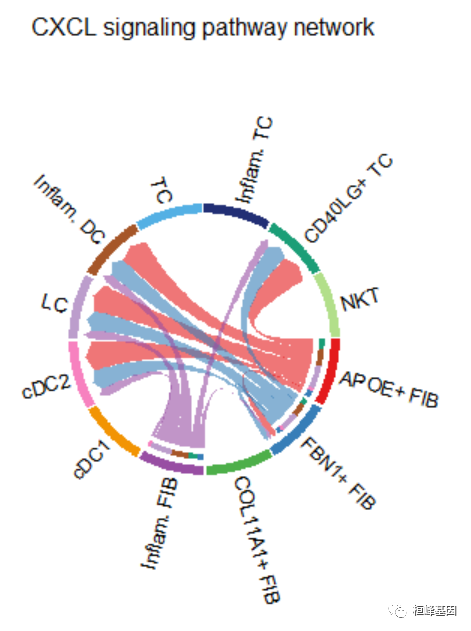
Heatmap
par(mfrow=c(1,1))
netVisual_heatmap(cellchat, signaling = pathways.show, color.heatmap = "Reds")
## Do heatmap based on a single object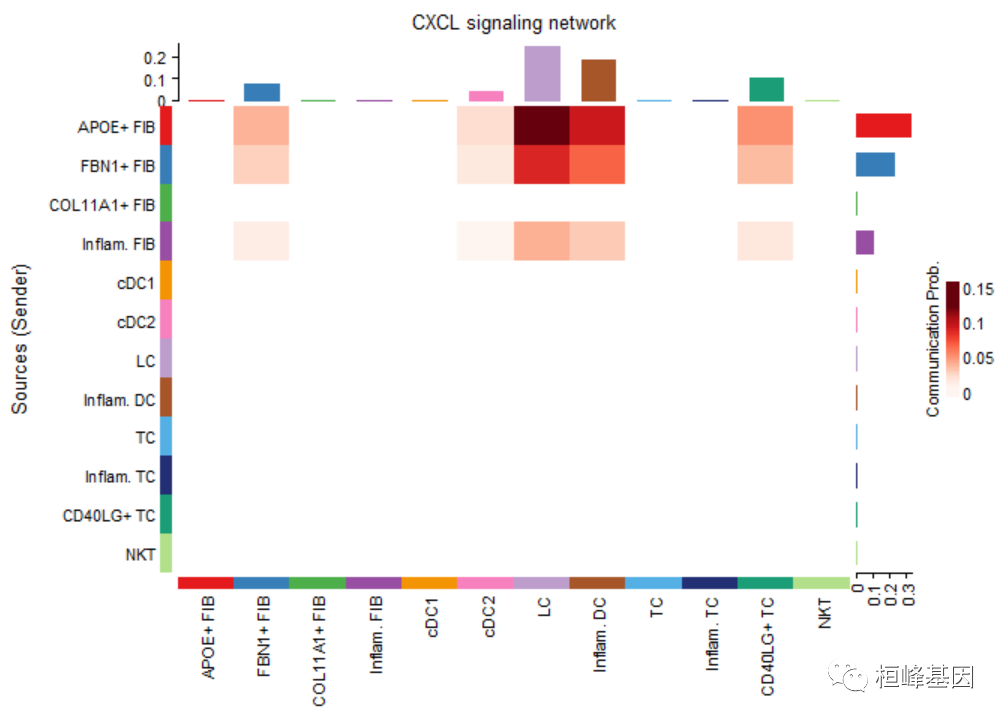
计算每个配体-受体对整体信号通路的贡献,并可视化由单个配体-受体对介导的细胞-细胞通信
netAnalysis_contribution(cellchat, signaling = pathways.show)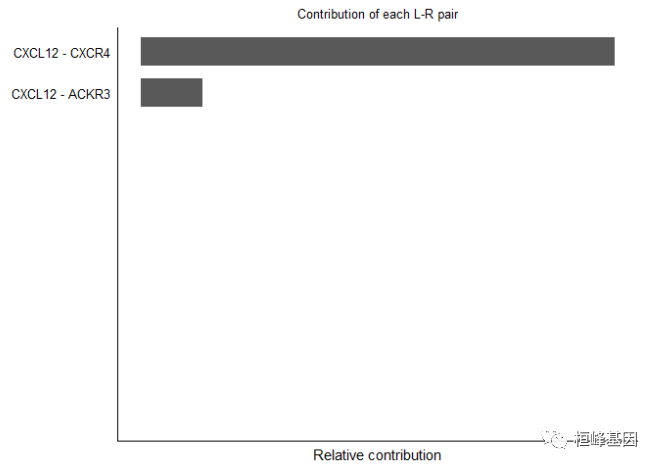
我们还可以可视化单个配体-受体对介导的细胞-细胞通讯。我们提供了extractEnrichedLR功能来提取给定信号通路的所有重要相互作用(L-R对)和相关信号基因。
pairLR.CXCL <- extractEnrichedLR(cellchat, signaling = pathways.show, geneLR.return = FALSE)
LR.show <- pairLR.CXCL[1,] # show one ligand-receptor pair
# Hierarchy plot
vertex.receiver = seq(1,4) # a numeric vector
netVisual_individual(cellchat, signaling = pathways.show,  pairLR.use = LR.show, vertex.receiver = vertex.receiver)
## [[1]]# Circle plot
netVisual_individual(cellchat, signaling = pathways.show, pairLR.use = LR.show, layout = "circle")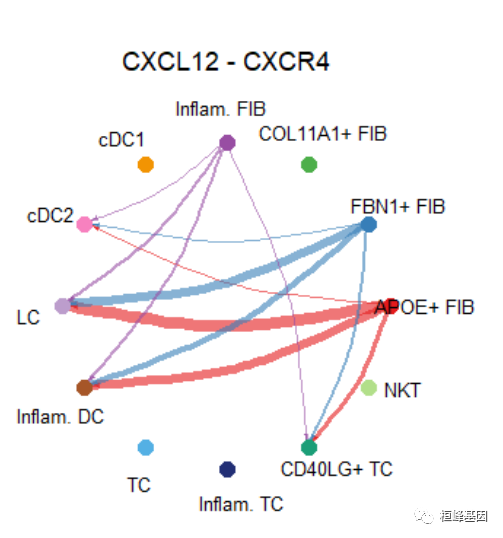
## [[1]]# Chord diagram
netVisual_individual(cellchat, signaling = pathways.show, pairLR.use = LR.show, layout = "chord")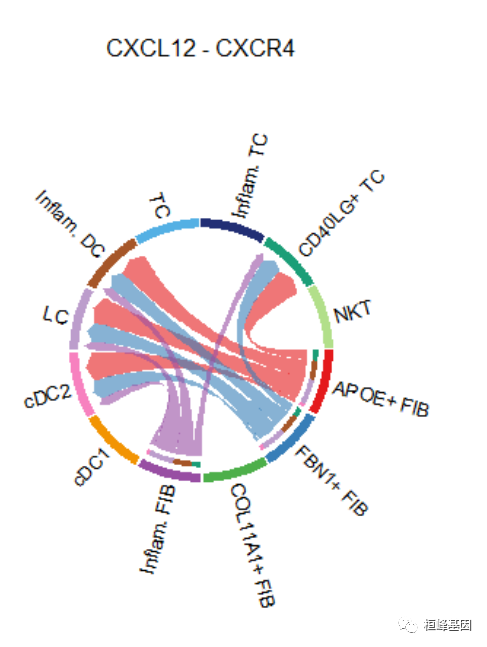
## [[1]]自动保存所有推断网络的绘图,以便快速探索
# Access all the signaling pathways showing significant communications
pathways.show.all <- cellchat@netP$pathways
# check the order of cell identity to set suitable vertex.receiver
levels(cellchat@idents)
## [1] "APOE+ FIB" "FBN1+ FIB" "COL11A1+ FIB" "Inflam. FIB" "cDC1"
## [6] "cDC2" "LC" "Inflam. DC" "TC" "Inflam. TC"
## [11] "CD40LG+ TC" "NKT"vertex.receiver = seq(1,4)
for (i in 1:length(pathways.show.all)) {
# Visualize communication network associated with both signaling pathway and individual L-R pairs
netVisual(cellchat, signaling = pathways.show.all[i], vertex.receiver = vertex.receiver, layout = "hierarchy")
# Compute and visualize the contribution of each ligand-receptor pair to the overall signaling pathway
gg <- netAnalysis_contribution(cellchat, signaling = pathways.show.all[i])
ggsave(filename=paste0(pathways.show.all[i], "_L-R_contribution.pdf"), plot=gg, width = 3, height = 2, units = 'in', dpi = 300)
}Bubble plot
可视化由多种配体受体或信号通路介导的细胞间通讯
# show all the significant interactions (L-R pairs) from some cell groups (defined by 'sources.use') to other cell groups (defined by 'targets.use')
netVisual_bubble(cellchat, sources.use = 4, targets.use = c(5:11), remove.isolate = FALSE)
## Comparing communications on a single object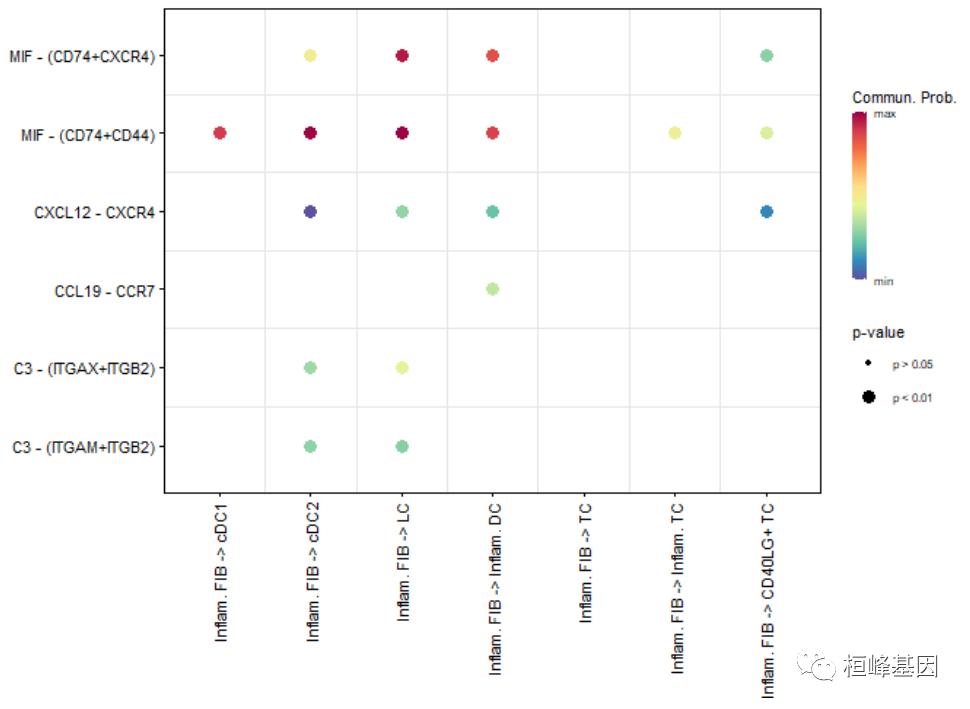
# show all the significant interactions (L-R pairs) associated with certain signaling pathways
netVisual_bubble(cellchat, sources.use = 4, targets.use = c(5:11), signaling = c("CCL","CXCL"), remove.isolate = FALSE)
## Comparing communications on a single object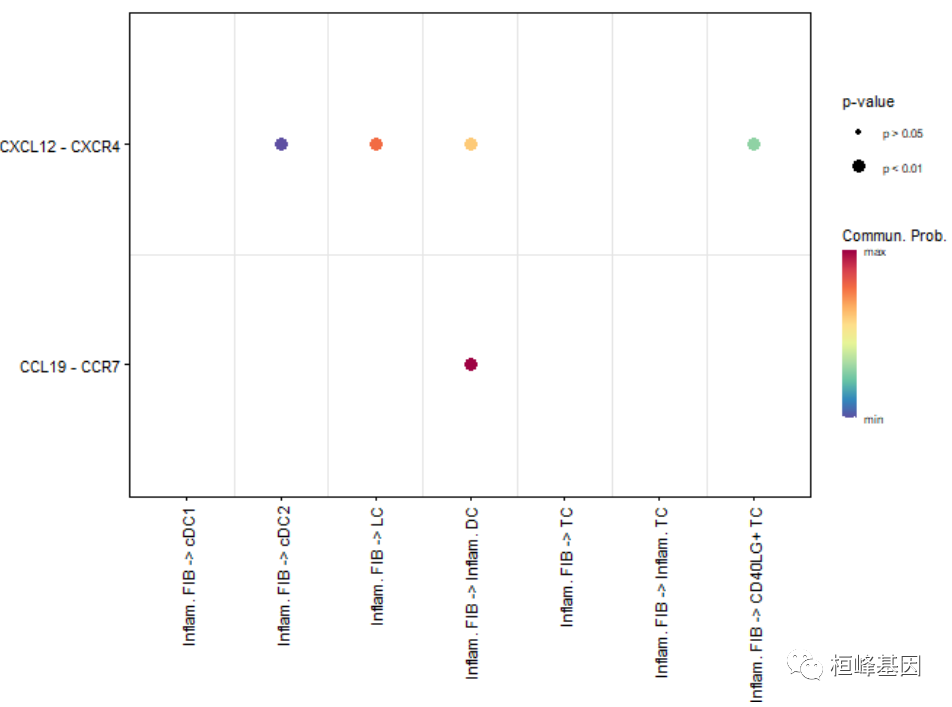
# show all the significant interactions (L-R pairs) based on user's input (defined by `pairLR.use`)
pairLR.use <- extractEnrichedLR(cellchat, signaling = c("CCL","CXCL","FGF"))
netVisual_bubble(cellchat, sources.use = c(3,4), targets.use = c(5:8), pairLR.use = pairLR.use, remove.isolate = TRUE)
## Comparing communications on a single object
violin plot
plotGeneExpression(cellchat, signaling = "CXCL")## Scale for y is already present.
## Adding another scale for y, which will replace the existing scale.
## Scale for y is already present.
## Adding another scale for y, which will replace the existing scale.
## Scale for y is already present.
## Adding another scale for y, which will replace the existing scale.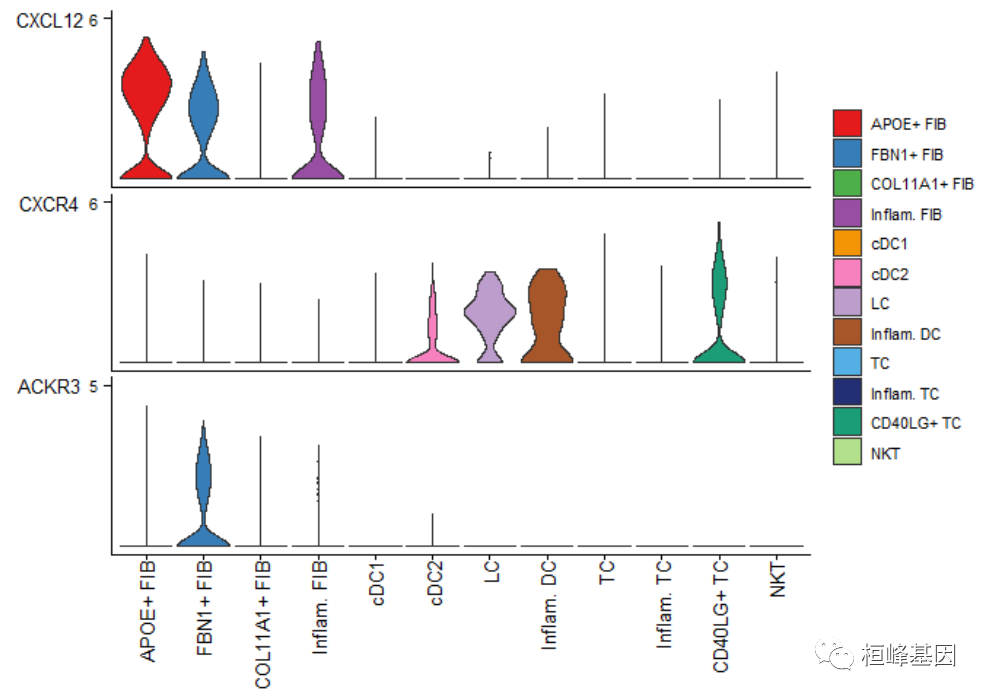
Reference
Suoqin Jin et al., Inference and analysis of cell-cell communication using CellChat. Nature Communications, 12:1088 (2021). https://www.nature.com/articles/s41467-021-21246-9


 1万+
1万+

 被折叠的 条评论
为什么被折叠?
被折叠的 条评论
为什么被折叠?
 到【灌水乐园】发言


