Using rqt_graph
rqt_graph creates a dynamic graph of what's going on in the system. rqt_graph is part of therqt package. Unless you already have it installed, run:
-
$ sudo apt-get install ros-<distro>-rqt
$ sudo apt-get install ros-<distro>-rqt-common-plugins
replacing <distro> with the name of your ROS distribution (fuerte, groovy, etc.)
In a new terminal:
$ rosrun rqt_graph rqt_graph
Using rqt_plot
Note: If you're using electric or earlier, rqt is not available. Use rxplot instead.
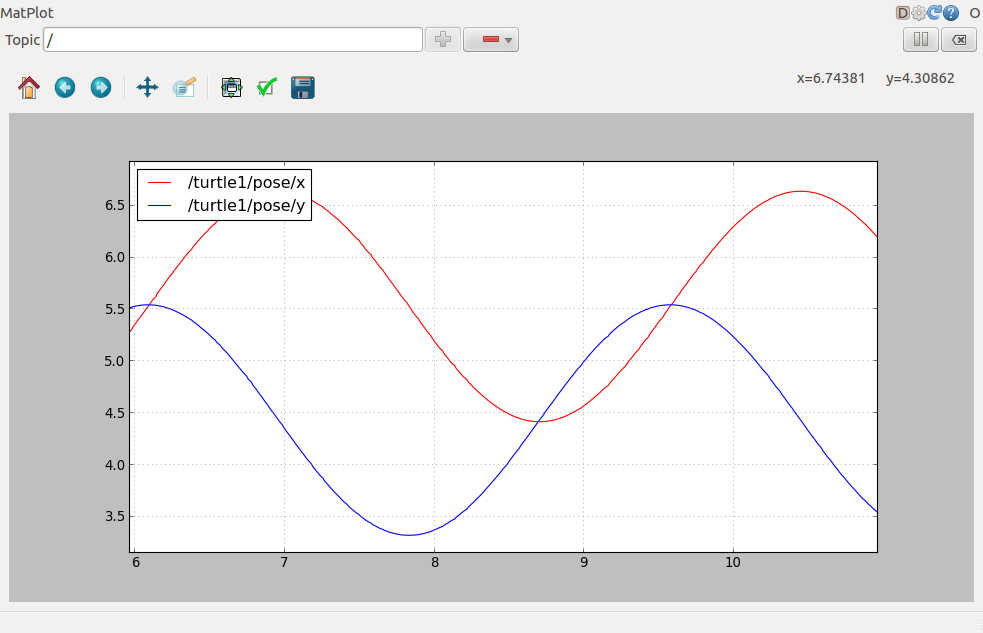
rqt_plot displays a scrolling time plot of the data published on topics. Here we'll use rqt_plot to plot the data being published on the /turtle1/pose topic. First, start rqt_plot by typing
$ rosrun rqt_plot rqt_plotin a new terminal. In the new window that should pop up, a text box in the upper left corner gives you the ability to add any topic to the plot. Typing /turtle1/pose/x will highlight the plus button, previously disabled. Press it and repeat the same procedure with the topic /turtle1/pose/y. You will now see the turtle's x-y location plotted in the graph.

Pressing the minus button shows a menu that allows you to hide the specified topic from the plot. Hiding both the topics you just added and adding /turtle1/pose/theta will result in the plot shown in the next figure.

That's it for this section, use Ctrl-C to kill the rostopic terminals but keep your turtlesim running.
Now that you understand how ROS topics work, let's look at how services and parameters work.
http://wiki.ros.org/ROS/Tutorials/UnderstandingTopics
Using rqt_console and rqt_logger_level
rqt_console attaches to ROS's logging framework to display output from nodes. rqt_logger_level allows us to change the verbosity level (DEBUG, WARN, INFO, and ERROR) of nodes as they run.
Now let's look at the turtlesim output in rqt_console and switch logger levels in rqt_logger_level as we use turtlesim. Before we start the turtlesim, in two new terminals start rqt_console and rqt_logger_level:
$ rosrun rqt_console rqt_console
$ rosrun rqt_logger_level rqt_logger_levelYou will see two windows popup:


Now let's start turtlesim in a new terminal:
$ rosrun turtlesim turtlesim_nodeSince the default logger level is INFO you will see any info that the turtlesim publishes when it starts up, which should look like:

Now let's change the logger level to Warn by refreshing the nodes in the rqt_logger_level window and selecting Warn as shown below:

Now let's run our turtle into the wall and see what is displayed in our rqt_console:
For ROS Hydro and later,
rostopic pub /turtle1/cmd_vel geometry_msgs/Twist -r 1 -- '{linear: {x: 2.0, y: 0.0, z: 0.0}, angular: {x: 0.0,y: 0.0,z: 0.0}}'
Note: If you're using electric or earlier, rqt is not available. Use rxplot instead.
rqt_plot displays a scrolling time plot of the data published on topics. Here we'll use rqt_plot to plot the data being published on the /turtle1/pose topic. First, start rqt_plot by typing
$ rosrun rqt_plot rqt_plotin a new terminal. In the new window that should pop up, a text box in the upper left corner gives you the ability to add any topic to the plot. Typing /turtle1/pose/x will highlight the plus button, previously disabled. Press it and repeat the same procedure with the topic /turtle1/pose/y. You will now see the turtle's x-y location plotted in the graph.

Pressing the minus button shows a menu that allows you to hide the specified topic from the plot. Hiding both the topics you just added and adding /turtle1/pose/theta will result in the plot shown in the next figure.

That's it for this section, use Ctrl-C to kill the rostopic terminals but keep your turtlesim running.
Now that you understand how ROS topics work, let's look at how services and parameters work.http://wiki.ros.org/ROS/Tutorials/UnderstandingTopics
Using rqt_console and rqt_logger_level
rqt_console attaches to ROS's logging framework to display output from nodes. rqt_logger_level allows us to change the verbosity level (DEBUG, WARN, INFO, and ERROR) of nodes as they run.
Now let's look at the turtlesim output in rqt_console and switch logger levels in rqt_logger_level as we use turtlesim. Before we start the turtlesim, in two new terminals start rqt_console and rqt_logger_level:
$ rosrun rqt_console rqt_console$ rosrun rqt_logger_level rqt_logger_levelYou will see two windows popup:


Now let's start turtlesim in a new terminal:
$ rosrun turtlesim turtlesim_nodeSince the default logger level is INFO you will see any info that the turtlesim publishes when it starts up, which should look like:

Now let's change the logger level to Warn by refreshing the nodes in the rqt_logger_level window and selecting Warn as shown below:

Now let's run our turtle into the wall and see what is displayed in our rqt_console:
For ROS Hydro and later,
rostopic pub /turtle1/cmd_vel geometry_msgs/Twist -r 1 -- '{linear: {x: 2.0, y: 0.0, z: 0.0}, angular: {x: 0.0,y: 0.0,z: 0.0}}'For ROS Groovy and earlier,
rostopic pub /turtle1/command_velocity turtlesim/Velocity -r 1 -- 2.0 0.0


 1837
1837

 被折叠的 条评论
为什么被折叠?


