


桓峰基因公众号推出单细胞生信分析教程并配有视频在线教程,目前整理出来的相关教程目录如下:
SCS【4】单细胞转录组数据可视化分析 (Seurat 4.0)
SCS【6】单细胞转录组之细胞类型自动注释 (SingleR)
SCS【7】单细胞转录组之轨迹分析 (Monocle 3) 聚类、分类和计数细胞
SCS【8】单细胞转录组之筛选标记基因 (Monocle 3)
SCS【9】单细胞转录组之构建细胞轨迹 (Monocle 3)
SCS【10】单细胞转录组之差异表达分析 (Monocle 3)
SCS【11】单细胞ATAC-seq 可视化分析 (Cicero)
SCS【12】单细胞转录组之评估不同单细胞亚群的分化潜能 (Cytotrace)
SCS【13】单细胞转录组之识别细胞对“基因集”的响应 (AUCell)
SCS【15】细胞交互:受体-配体及其相互作用的细胞通讯数据库 (CellPhoneDB)
SCS【16】从肿瘤单细胞RNA-Seq数据中推断拷贝数变化 (inferCNV)
SCS【17】从单细胞转录组推断肿瘤的CNV和亚克隆 (copyKAT)
SCS【18】细胞交互:受体-配体及其相互作用的细胞通讯数据库 (iTALK)
SCS【21】单细胞空间转录组可视化 (Seurat V5)
SCS【22】单细胞转录组之 RNA 速度估计 (Velocyto.R)
这期介绍一下单细胞代谢定量化,从单细胞表达到代谢等的分析,其实是开启了单细胞精度上的基因研究模式,通过高精度的单细胞模式研究具体的代谢通路,势必开启一种疾病治疗的新篇章!!
简介
scMetabolism,这是一种用于量化单细胞代谢的计算方法,并观察到这些巨噬细胞具有增强的代谢活性。
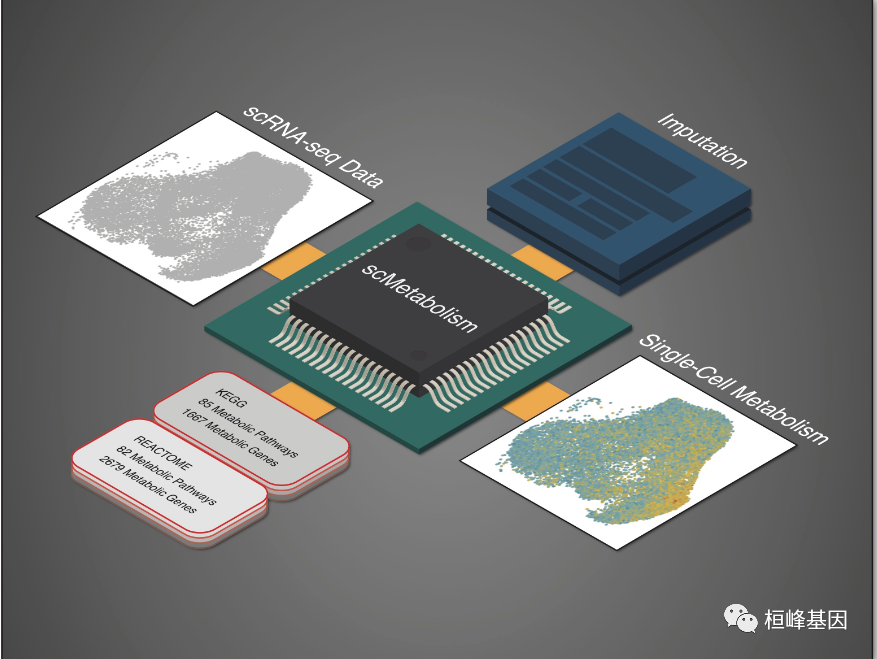
scMetabolism通常支持单细胞分辨率下代谢的量化和可视化。scMetabolism目前支持人类scRNA-seq数据。
软件包安装
这个软件包依赖的包挺多的,安装时还是挺费事的,若以前安装过,那就非常方便了。不过其中几个包我们在公众号上都有分享过:
SCS【4】单细胞转录组数据可视化分析 (Seurat 4.0)
SCS【13】单细胞转录组之识别细胞对“基因集”的响应 (AUCell)
SCS【21】单细胞空间转录组可视化 (Seurat V5)
install.packages(c("devtools", "data.table", "wesanderson", "Seurat", "devtools", "AUCell", "GSEABase", "GSVA", "ggplot2","rsvd"))
devtools::install_github("YosefLab/VISION@v2.1.0") #Please note that the version would be v2.1.0
devtools::install_github("wu-yc/scMetabolism")
数据读取
数据是来自10X Genomics开放获取数据集的外周血单核细胞(PBMC)数据集(约2700个单细胞),下载不到的可以联系我们。
library(scMetabolism)
library(ggplot2)
## Warning: 程辑包'ggplot2'是用R版本4.2.3 来建造的library(rsvd)
load(file = "pbmc_demo.rda")实例操作
定量单细胞代谢(Seurat)
使用Seurat定量单细胞代谢
countexp.Seurat<-sc.metabolism.Seurat(obj = countexp.Seurat,
                                      method = "AUCell",
                                      imputation = F,
                                      ncores = 2,
                                      metabolism.type = "KEGG")
## Your choice is: KEGG
## Start quantify the metabolism activity...## Warning in .AUCell_buildRankings(exprMat = exprMat, featureType = featureType,
## : nCores is no longer used. It will be deprecated in the next AUCell version.## Warning in .AUCell_calcAUC(geneSets = geneSets, rankings = rankings, nCores = nCores, : The following gene sets will be excluded from the analysis(less than 20% of their genes are available):
## D-Arginine and D-ornithine metabolism, Caffeine metabolism## Genes in the gene sets NOT available in the dataset:
## Glycolysis / Gluconeogenesis: 25 (37% of 68)
## Citrate cycle (TCA cycle): 3 (10% of 30)
## Pentose phosphate pathway: 5 (17% of 30)
## Pentose and glucuronate interconversions: 21 (62% of 34)
## Fructose and mannose metabolism: 6 (18% of 33)
## Galactose metabolism: 10 (32% of 31)
## Ascorbate and aldarate metabolism: 20 (74% of 27)
## Starch and sucrose metabolism: 16 (44% of 36)
## Amino sugar and nucleotide sugar metabolism: 4 (8% of 48)
## Pyruvate metabolism: 7 (18% of 39)
## Glyoxylate and dicarboxylate metabolism: 5 (18% of 28)
## Propanoate metabolism: 4 (12% of 32)
## Butanoate metabolism: 11 (39% of 28)
## Inositol phosphate metabolism: 11 (15% of 73)
## Oxidative phosphorylation: 47 (35% of 133)
## Nitrogen metabolism: 11 (65% of 17)
## Sulfur metabolism: 1 (11% of 9)
## Fatty acid biosynthesis: 2 (15% of 13)
## Fatty acid elongation: 9 (30% of 30)
## Fatty acid degradation: 11 (25% of 44)
## Synthesis and degradation of ketone bodies: 3 (30% of 10)
## Steroid biosynthesis: 4 (21% of 19)
## Primary bile acid biosynthesis: 9 (53% of 17)
## Steroid hormone biosynthesis: 45 (76% of 59)
## Glycerolipid metabolism: 26 (43% of 61)
## Glycerophospholipid metabolism: 34 (35% of 97)
## Ether lipid metabolism: 21 (45% of 47)
## Sphingolipid metabolism: 11 (23% of 47)
## Arachidonic acid metabolism: 34 (55% of 62)
## Linoleic acid metabolism: 21 (72% of 29)
## alpha-Linolenic acid metabolism: 14 (56% of 25)
## Biosynthesis of unsaturated fatty acids: 7 (30% of 23)
## Purine metabolism: 44 (25% of 174)
## Pyrimidine metabolism: 12 (12% of 101)
## Alanine, aspartate and glutamate metabolism: 13 (37% of 35)
## Glycine, serine and threonine metabolism: 17 (42% of 40)
## Cysteine and methionine metabolism: 12 (27% of 45)
## Valine, leucine and isoleucine degradation: 5 (10% of 48)
## Lysine degradation: 13 (22% of 59)
## Arginine biosynthesis: 9 (43% of 21)
## Arginine and proline metabolism: 19 (38% of 50)
## Histidine metabolism: 12 (52% of 23)
## Tyrosine metabolism: 22 (61% of 36)
## Phenylalanine metabolism: 11 (65% of 17)
## Tryptophan metabolism: 19 (48% of 40)
## Phenylalanine, tyrosine and tryptophan biosynthesis: 2 (40% of 5)
## beta-Alanine metabolism: 11 (35% of 31)
## Taurine and hypotaurine metabolism: 7 (64% of 11)
## Phosphonate and phosphinate metabolism: 2 (33% of 6)
## Selenocompound metabolism: 3 (18% of 17)
## D-Glutamine and D-glutamate metabolism: 2 (40% of 5)
## Glutathione metabolism: 17 (30% of 56)
## N-Glycan biosynthesis: 8 (16% of 49)
## Mucin type O-glycan biosynthesis: 15 (48% of 31)
## Mannose type O-glycan biosynthesis: 8 (35% of 23)
## Other types of O-glycan biosynthesis: 4 (18% of 22)
## Glycosaminoglycan biosynthesis - chondroitin sulfate / dermatan sulfate: 2 (10% of 20)
## Glycosaminoglycan biosynthesis - heparan sulfate / heparin: 8 (33% of 24)
## Glycosaminoglycan biosynthesis - keratan sulfate: 5 (36% of 14)
## Glycosaminoglycan degradation: 4 (21% of 19)
## Glycosylphosphatidylinositol (GPI)-anchor biosynthesis: 2 (8% of 25)
## Glycosphingolipid biosynthesis - lacto and neolacto series: 12 (44% of 27)
## Glycosphingolipid biosynthesis - globo and isoglobo series: 6 (40% of 15)
## Glycosphingolipid biosynthesis - ganglio series: 3 (20% of 15)
## Other glycan degradation: 2 (11% of 18)
## Thiamine metabolism: 5 (31% of 16)
## Riboflavin metabolism: 2 (25% of 8)
## Vitamin B6 metabolism: 2 (33% of 6)
## Nicotinate and nicotinamide metabolism: 11 (37% of 30)
## Pantothenate and CoA biosynthesis: 5 (26% of 19)
## Folate biosynthesis: 10 (38% of 26)
## One carbon pool by folate: 5 (25% of 20)
## Retinol metabolism: 51 (77% of 66)
## Porphyrin and chlorophyll metabolism: 21 (50% of 42)
## Ubiquinone and other terpenoid-quinone biosynthesis: 1 (9% of 11)
## Terpenoid backbone biosynthesis: 2 (9% of 22)
## Neomycin, kanamycin and gentamicin biosynthesis: 1 (20% of 5)
## Metabolism of xenobiotics by cytochrome P450: 49 (65% of 75)
## Drug metabolism - cytochrome P450: 51 (72% of 71)
## Drug metabolism - other enzymes: 33 (42% of 79)参数说明
obj:是一个包含UMI计数矩阵的Seurat对象;
method:支持VISION、AUCell、ssgsea和gsva,其中VISION为默认方法;
Imputation:允许用户选择是否在新陈代谢评分之前输入他们的数据;
ncores:是并行计算的线程数;
metabolism.type:type支持KEGG和REACTOME,其中KEGG包含85个代谢途径,REACTOME包含82个代谢途径。
要提取新陈代谢得分,只需运行新陈代谢:
metabolism.matrix <- countexp.Seurat@assays$METABOLISM$score可视化
DimPlot
DimPlot.metabolism(obj = countexp.Seurat, pathway = "Glycolysis / Gluconeogenesis", dimention.reduction.type = "umap", dimention.reduction.run = F, size = 1)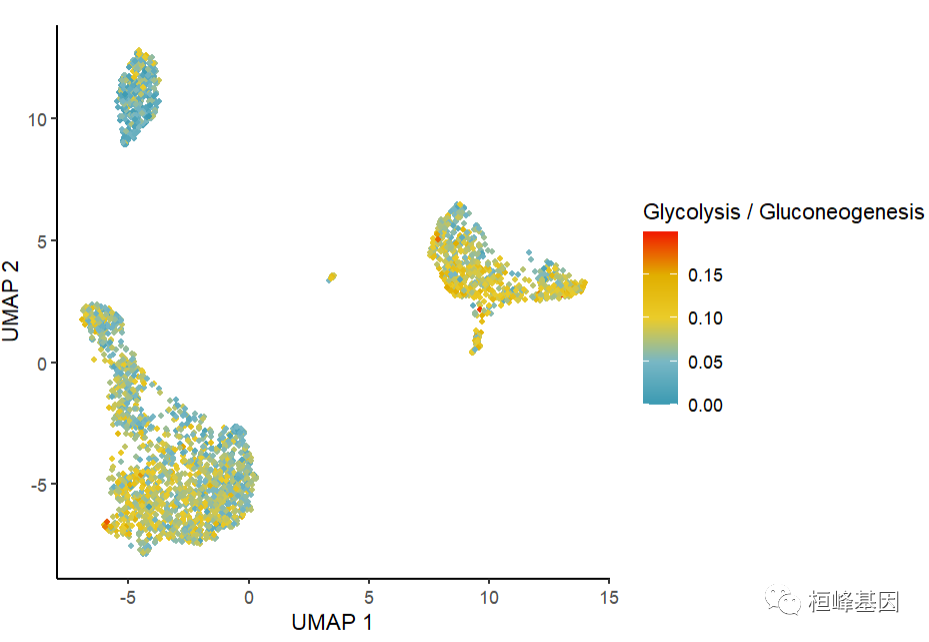
countexp.Seurat:是一个包含UMI计数矩阵的Seurat对象;
pathway:是我们感兴趣的途径;
dimention.reduction.type:支持 umap and tsne.
dimention.reduction.run:允许用户选择是否重新运行给定的Seurat对象的降维;
size:是图中的点大小。
这个函数返回一个ggplot对象,用户可以自己动手制作。
Dot plot
input.pathway<-c("Glycolysis / Gluconeogenesis", "Oxidative phosphorylation", "Citrate cycle (TCA cycle)")
DotPlot.metabolism(obj = countexp.Seurat, pathway = input.pathway, phenotype = "ident", norm = "y")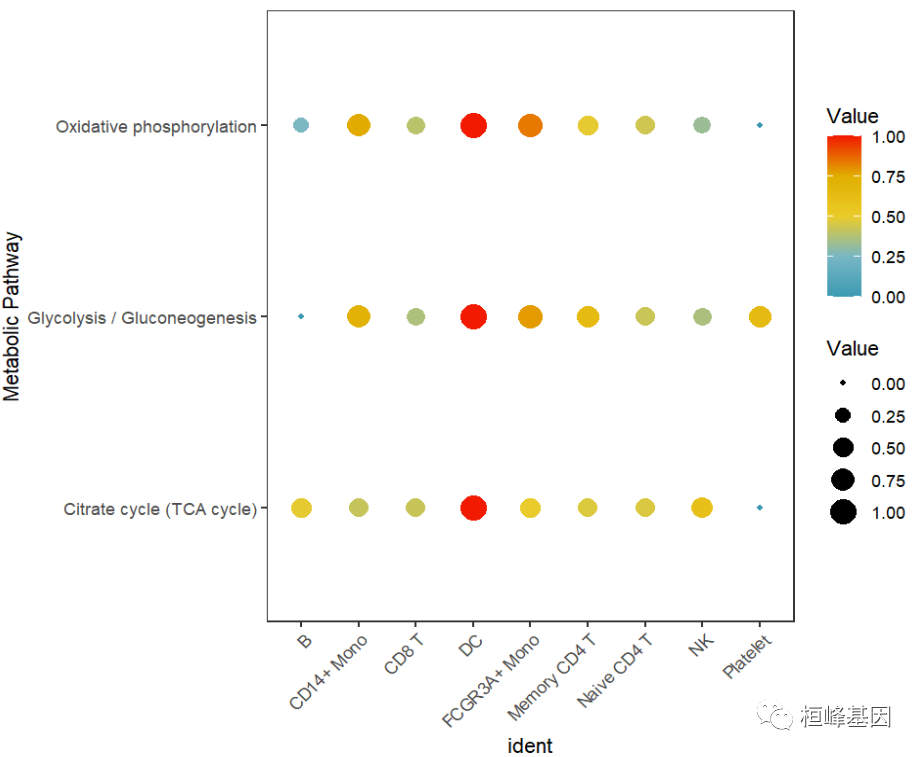
obj:是一个包含UMI计数矩阵的Seurat对象;
pathway:是要可视化的感兴趣的路径;
phenotype:是Seurat对象的元数据中包含的特征之一;
norm:是指按行或列对值进行缩放。用户可以选择“x”、“y”和“na”。
这个函数返回一个ggplot对象,用户可以自己动手制作。
Box plot
绘图参数与Dot plot 差不多,不同的表示方式:
BoxPlot.metabolism(obj = countexp.Seurat, pathway = input.pathway, phenotype = "ident", ncol = 1)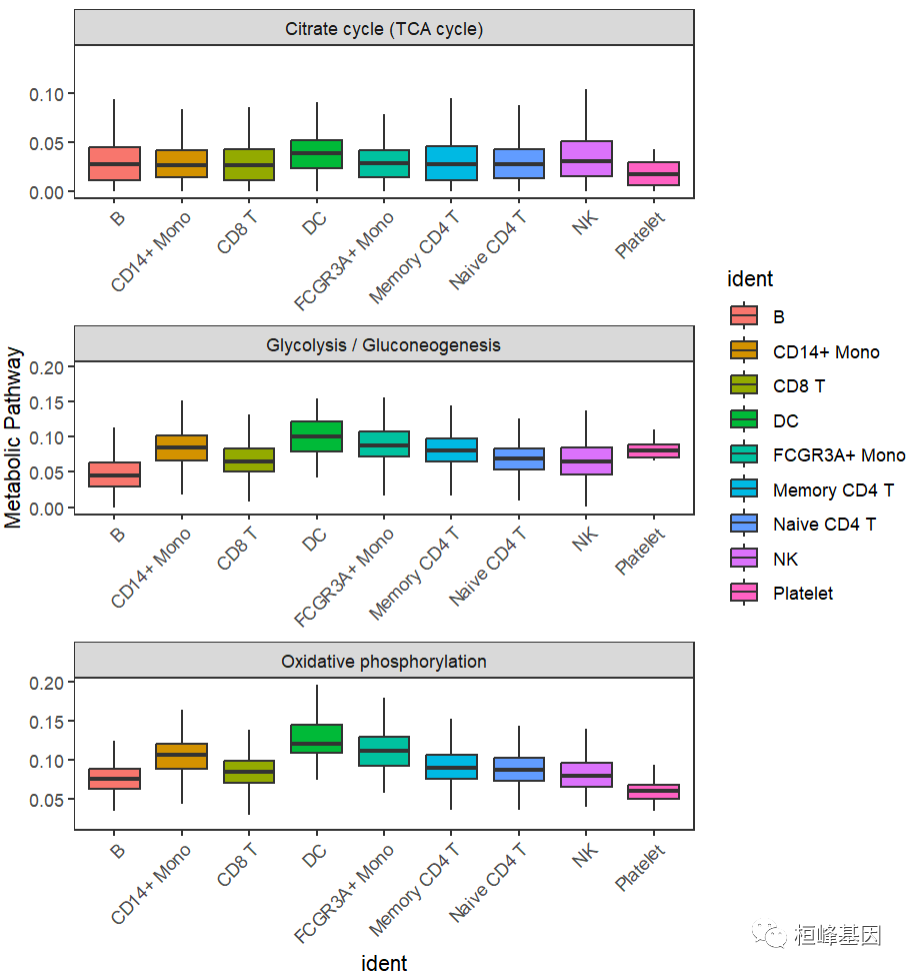
定量单细胞代谢(not Seurat)
正常读取矩阵数据:
countexp=read.table("pbmc_500.txt",header = T,sep = "\t",row.names = 1)
countexp[1:5,1:5]
## AAACATACAACCAC.1 AAACATTGAGCTAC.1 AAACATTGATCAGC.1
## AL627309.1 0 0 0
## AP006222.2 0 0 0
## RP11-206L10.2 0 0 0
## RP11-206L10.9 0 0 0
## LINC00115 0 0 0
## AAACCGTGCTTCCG.1 AAACCGTGTATGCG.1
## AL627309.1 0 0
## AP006222.2 0 0
## RP11-206L10.2 0 0
## RP11-206L10.9 0 0
## LINC00115 0 0通过sc.metabolism()函数获得注释结果:
metabolism.matrix<-sc.metabolism(countexp = countexp, method = "AUCell", imputation = F, ncores = 2, metabolism.type = "KEGG")## Your choice is: KEGG
## Start quantify the metabolism activity...## Warning in .AUCell_buildRankings(exprMat = exprMat, featureType = featureType,
## : nCores is no longer used. It will be deprecated in the next AUCell version.## Warning in .AUCell_calcAUC(geneSets = geneSets, rankings = rankings, nCores = nCores, : The following gene sets will be excluded from the analysis(less than 20% of their genes are available):
## D-Arginine and D-ornithine metabolism, Caffeine metabolism## Genes in the gene sets NOT available in the dataset:
## Glycolysis / Gluconeogenesis: 25 (37% of 68)
## Citrate cycle (TCA cycle): 3 (10% of 30)
## Pentose phosphate pathway: 5 (17% of 30)
## Pentose and glucuronate interconversions: 21 (62% of 34)
## Fructose and mannose metabolism: 6 (18% of 33)
## Galactose metabolism: 10 (32% of 31)
## Ascorbate and aldarate metabolism: 20 (74% of 27)
## Starch and sucrose metabolism: 16 (44% of 36)
## Amino sugar and nucleotide sugar metabolism: 4 (8% of 48)
## Pyruvate metabolism: 7 (18% of 39)
## Glyoxylate and dicarboxylate metabolism: 5 (18% of 28)
## Propanoate metabolism: 4 (12% of 32)
## Butanoate metabolism: 11 (39% of 28)
## Inositol phosphate metabolism: 11 (15% of 73)
## Oxidative phosphorylation: 47 (35% of 133)
## Nitrogen metabolism: 11 (65% of 17)
## Sulfur metabolism: 1 (11% of 9)
## Fatty acid biosynthesis: 2 (15% of 13)
## Fatty acid elongation: 9 (30% of 30)
## Fatty acid degradation: 11 (25% of 44)
## Synthesis and degradation of ketone bodies: 3 (30% of 10)
## Steroid biosynthesis: 4 (21% of 19)
## Primary bile acid biosynthesis: 9 (53% of 17)
## Steroid hormone biosynthesis: 45 (76% of 59)
## Glycerolipid metabolism: 26 (43% of 61)
## Glycerophospholipid metabolism: 34 (35% of 97)
## Ether lipid metabolism: 21 (45% of 47)
## Sphingolipid metabolism: 11 (23% of 47)
## Arachidonic acid metabolism: 34 (55% of 62)
## Linoleic acid metabolism: 21 (72% of 29)
## alpha-Linolenic acid metabolism: 14 (56% of 25)
## Biosynthesis of unsaturated fatty acids: 7 (30% of 23)
## Purine metabolism: 44 (25% of 174)
## Pyrimidine metabolism: 12 (12% of 101)
## Alanine, aspartate and glutamate metabolism: 13 (37% of 35)
## Glycine, serine and threonine metabolism: 17 (42% of 40)
## Cysteine and methionine metabolism: 12 (27% of 45)
## Valine, leucine and isoleucine degradation: 5 (10% of 48)
## Lysine degradation: 13 (22% of 59)
## Arginine biosynthesis: 9 (43% of 21)
## Arginine and proline metabolism: 19 (38% of 50)
## Histidine metabolism: 12 (52% of 23)
## Tyrosine metabolism: 22 (61% of 36)
## Phenylalanine metabolism: 11 (65% of 17)
## Tryptophan metabolism: 19 (48% of 40)
## Phenylalanine, tyrosine and tryptophan biosynthesis: 2 (40% of 5)
## beta-Alanine metabolism: 11 (35% of 31)
## Taurine and hypotaurine metabolism: 7 (64% of 11)
## Phosphonate and phosphinate metabolism: 2 (33% of 6)
## Selenocompound metabolism: 3 (18% of 17)
## D-Glutamine and D-glutamate metabolism: 2 (40% of 5)
## Glutathione metabolism: 17 (30% of 56)
## N-Glycan biosynthesis: 8 (16% of 49)
## Mucin type O-glycan biosynthesis: 15 (48% of 31)
## Mannose type O-glycan biosynthesis: 8 (35% of 23)
## Other types of O-glycan biosynthesis: 4 (18% of 22)
## Glycosaminoglycan biosynthesis - chondroitin sulfate / dermatan sulfate: 2 (10% of 20)
## Glycosaminoglycan biosynthesis - heparan sulfate / heparin: 8 (33% of 24)
## Glycosaminoglycan biosynthesis - keratan sulfate: 5 (36% of 14)
## Glycosaminoglycan degradation: 4 (21% of 19)
## Glycosylphosphatidylinositol (GPI)-anchor biosynthesis: 2 (8% of 25)
## Glycosphingolipid biosynthesis - lacto and neolacto series: 12 (44% of 27)
## Glycosphingolipid biosynthesis - globo and isoglobo series: 6 (40% of 15)
## Glycosphingolipid biosynthesis - ganglio series: 3 (20% of 15)
## Other glycan degradation: 2 (11% of 18)
## Thiamine metabolism: 5 (31% of 16)
## Riboflavin metabolism: 2 (25% of 8)
## Vitamin B6 metabolism: 2 (33% of 6)
## Nicotinate and nicotinamide metabolism: 11 (37% of 30)
## Pantothenate and CoA biosynthesis: 5 (26% of 19)
## Folate biosynthesis: 10 (38% of 26)
## One carbon pool by folate: 5 (25% of 20)
## Retinol metabolism: 51 (77% of 66)
## Porphyrin and chlorophyll metabolism: 21 (50% of 42)
## Ubiquinone and other terpenoid-quinone biosynthesis: 1 (9% of 11)
## Terpenoid backbone biosynthesis: 2 (9% of 22)
## Neomycin, kanamycin and gentamicin biosynthesis: 1 (20% of 5)
## Metabolism of xenobiotics by cytochrome P450: 49 (65% of 75)
## Drug metabolism - cytochrome P450: 51 (72% of 71)
## Drug metabolism - other enzymes: 33 (42% of 79)metabolism.matrix[1:5,1:3]## AAACATACAACCAC.1 AAACATTGAGCTAC.1
## Glycolysis / Gluconeogenesis 0.06423368 0.11372233
## Citrate cycle (TCA cycle) 0.02849427 0.05665785
## Pentose phosphate pathway 0.00000000 0.02971768
## Pentose and glucuronate interconversions 0.01676674 0.00000000
## Fructose and mannose metabolism 0.03328924 0.01873898
## AAACATTGATCAGC.1
## Glycolysis / Gluconeogenesis 0.102479686
## Citrate cycle (TCA cycle) 0.061452822
## Pentose phosphate pathway 0.001069837
## Pentose and glucuronate interconversions 0.032627167
## Fructose and mannose metabolism 0.000000000Reference
Wu Y, Yang S, Ma J, Chen Z, Song G, Rao D, Cheng Y, Huang S, Liu Y, Jiang S, Liu J, Huang X, Wang X, Qiu S, Xu J, Xi R, Bai F, Zhou J, Fan J, Zhang X, Gao Q. Spatiotemporal Immune Landscape of Colorectal Cancer Liver Metastasis at Single-Cell Level. Cancer Discov. 2021 Aug 20.
Detomaso D , Jones M G , Subramaniam M , et al. Functional interpretation of single cell similarity maps[J]. Nature Communications, 2019, 10.
Andrew M D , Greg F , Chattopadyay P K , et al. Data exploration, quality control and testing in single-cell qPCR-based gene expression experiments[J]. Bioinformatics, 2013, 29(4):461-467.
这个软件包代码量还是很多的,需要具有一定 R 语言编程基础,并不是看起来那么简单,所以好多老师想直接自己学习教程来分析,但是实质上没有基础还是很难实现,每步报错都不知道该怎样处理,是最崩溃的,所以有需求的老师可以联系桓峰基因,提供最优质的服务!!!
桓峰基因,铸造成功的您!
未来桓峰基因公众号将不间断的推出单细胞系列生信分析教程,
敬请期待!!
桓峰基因和投必得合作,文章润色优惠85折,需要文章润色的老师可以直接到网站输入领取桓峰基因专属优惠券码:KYOHOGENE,然后上传,付款时选择桓峰基因优惠券即可享受85折优惠哦!https://www.topeditsci.com/
有想进生信交流群的老师可以扫最后一个二维码加微信,备注“单位+姓名+目的”!!!


 2023
2023


 被折叠的 条评论
为什么被折叠?
被折叠的 条评论
为什么被折叠?
 到【灌水乐园】发言


