接到一个wgs项目,要帮助客户统计vcf文件中snp突变频率,比较两个样品的突变位点。这个工作在上一个项目中是手动处理的,当时参考序列短,突变位点少。这次经过比对后,发现了有个样品有上万个snp位点,肯定不能用手动处理的方式。因此,写了一个脚本来统计各个样品的突变频率。
需要统计的信息
包括染色体,突变位置,参考位点,各样品突变位点,突变率(AD杂合位点覆盖度/DP总覆盖度)
python 3.7
R version 3.6.1
统计各样品各位点突变频率
我们输入的vcf文件为GATK经过去重过滤后生成的,
bash python snp_frequency.py XX.snp.vcf
import csv
import sys
vcf_file = sys. argv[ 1 ]
genome_file = open ( vcf_file, 'r' )
gtf_file = vcf_file. replace( '_snp.vcf' , '' )
genome_line = genome_file. readlines( )
newgtf_name = '%s_stat' % gtf_file
desktop_path = './'
file_path = desktop_path+ newgtf_name+ '.csv'
file = open ( file_path, 'w' )
for i in genome_line:
snp_pos = i. split( '\t' )
if "#" in snp_pos[ 0 ] and len ( snp_pos) > 8 :
title = snp_pos[ 0 ] + '\t' + snp_pos[ 1 ] + '\t' + snp_pos[ 3 ] + '\t' + snp_pos[ 4 ] + '\t' + '%s_FRE' % vcf_file+ '\n'
file . write( title)
if "#" not in snp_pos[ 0 ] and len ( snp_pos) > 8 :
info = snp_pos[ 9 ] . split( ':' )
AD = info[ 1 ] . split( ',' )
AD_0 = int ( AD[ 0 ] )
AD_1 = int ( AD[ 1 ] )
AD_total = int ( AD[ 0 ] ) + int ( AD[ 1 ] )
DP = info[ 2 ]
out_line = snp_pos[ 0 ] + '\t' + snp_pos[ 1 ] + '\t' + snp_pos[ 3 ] + '\t' + snp_pos[ 4 ] + '\t' + '%.0f' % AD_total+ '/' + DP+ '\n'
file . write( out_line)
file . close( )
genome_file. close( )
将比较样品进行合并,比较不同样品的突变情况。
WT= read.csv( "USA_300_WT_stat.csv" , header= T, sep= '\t' , check.names= F) S1= read.csv( "USA_300_S1_stat.csv" , header= T, sep= '\t' , check.names= F)
S2= read.csv( "USA_300_S2_stat.csv" , header= T, sep= '\t' , check.names= F)
WT_1 <- merge( WT, S1, all = TRUE )
WT_2 <- merge( WT, S2, all = TRUE )
write.csv( WT_2, "USA_WT_vs_S2_snpstat.csv" )
write.csv( WT_1, "USA_WT_vs_S1_snpstat.csv" )
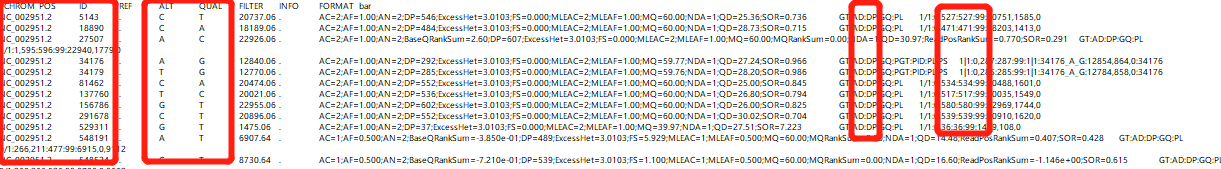
得到.csv格式文件,这里用editplus打开
WGS的最初的目的是为了寻找突变位点,这里是进行样品间比较,客户更需要的数据不是都发生突变的位点,而是某一个位点在其中一个样品发生突变(比如S1有S2无,反之亦然)。这样可以找到不同处理下的突变位点,深入研究。


 831
831


 被折叠的 条评论
为什么被折叠?
被折叠的 条评论
为什么被折叠?
 到【灌水乐园】发言


