


fig = plt.figure()
ax = fig.add_subplot(111)
t = np.arange(0, 5, .01)
y = np.cos(2*np.pi*t)
line, = ax.plot(t, y, lw=2)
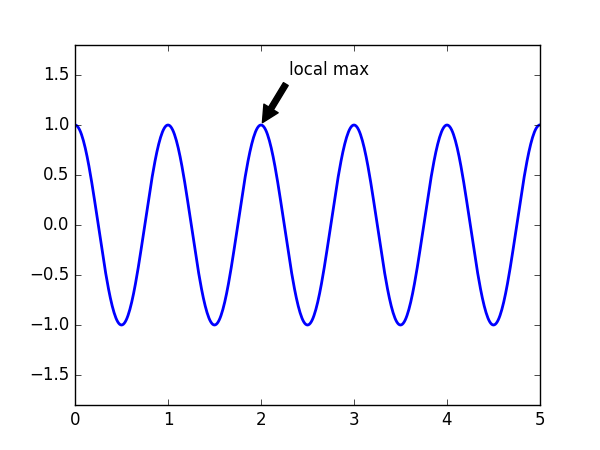
1. Annotating text
import matplotlib.pyplot as plt
import numpy as np

def main():
	fig = plt.figure()
	ax = fig.add_subplot(111)

	t = np.arange(0, 5, .01)
	y = np.cos(2*np.pi*t)

	line, = ax.plot(t, y, lw=2)

	ax.set_ylim([-2+.2, 2-.2])
	ax.annotate('local max', xy=(3, 0), xytext=(3.5, 1.5), arrowprops=dict(facecolor='k', shrink=.05))
	plt.show()
if __name__ == '__main__':
	main()
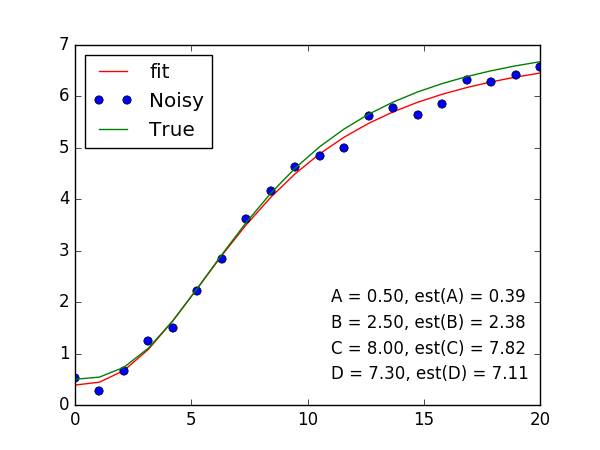
2. 有规律的在figure中写东西
规律自然用到循环;
for i, (param, true, est) in enumerate(zip('ABCD', [A, B, C, D], plesq[0])):
	plt.text(10, 3-i*.5, '{} = {:.2f}, est({}) = {:.2f}'.format(param, true, param, est))
				# text的前两个参数是需要根据图像的布局反复调整的
3. 画圆(矩形、椭圆)
from matploblib.patches import Cicle, Ellipse
import matplotlib.pyplot as plt
fig = plt.figure()
ax = fig.add_subplot(111)
ell1 = Ellipse(xy=(.0, .0), width=4, height=8, angle=30, facecolor='y', alpha=.3)
cir1 = Circle(xy=(.0, .0), radius=2, alpha=.4)
					# alpha的设置很重要,否则画出来的图会很丑
ax.add_patch(ell1)
ax.add_patch(cir1)
x, y = 0, 0
ax.plot(x, y, 'ro')
ax.axis('scaled')
plt.show()
4. 饼状图
- plt.pie():Python数据可视化:饼状图
5. 三角形
- 描点连线,起点和终点相同
triangle1 = ((0, sqrt(3)/2), (1, 3*sqrt(3)/2), (2, sqrt(3)/2), (0, sqrt(3)/2))
triangle2 = ((0, sqrt(3)), (1, 0), (2, sqrt(3)), (0, sqrt(3)))
plt.plot([e[0] for e in triangle1], [e[1] for e in triangle1],
         [e[0]for e in triangle2], [e[1] for e in triangle2], 'b', lw=3)


 3281
3281


 被折叠的 条评论
为什么被折叠?
被折叠的 条评论
为什么被折叠?
 到【灌水乐园】发言


