


import torch.nn.functional as F
import torch
import matplotlib.pyplot as plt

def show_heatmaps(matrices, xlabel, ylabel, titles=None, figsize=(5, 5),
                  cmap='Reds'):
    """显示矩阵热图"""
    num_rows, num_cols = matrices.shape[0], matrices.shape[1]
    fig, axes = plt.subplots(num_rows, num_cols, figsize=figsize,
                                 sharex=True, sharey=True, squeeze=False)

    for i, (row_axes, row_matrices) in enumerate(zip(axes, matrices)):
        for j, (ax, matrix) in enumerate(zip(row_axes, row_matrices)):
            pcm = ax.imshow(matrix.detach().numpy(), cmap=cmap)
            if i == num_rows - 1:
                ax.set_xlabel(xlabel)
            if j == 0:
                ax.set_ylabel(ylabel)
            if titles:
                ax.set_title(titles[j])
    fig.colorbar(pcm, ax=axes, shrink=0.6)

A = torch.rand((10,10))
print(A.shape)
B = F.softmax(A, dim=1)
print(B.shape)
C = B.unsqueeze(0).unsqueeze(0)
print(C.shape)
show_heatmaps(C, "cols", "rows")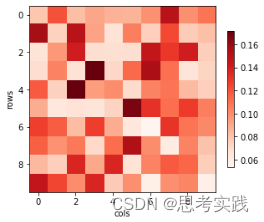
python 统一两个子图的colorbar显示范围_曦影y的博客-CSDN博客_colorbar范围
import torch.nn.functional as F
import torch
import matplotlib.pyplot as plt
import numpy as np
import matplotlib
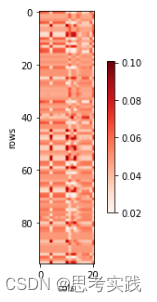
data = np.load('f_weight.npy')
data = torch.from_numpy(data).permute(0,2,1)
print(data.shape)
data = data[0]
print(data.shape)
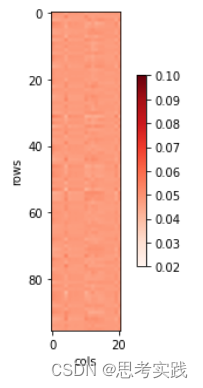
norm = matplotlib.colors.Normalize(vmin=0.02,vmax=0.1) # 设置colorbar显示的最大最小值
def show_heatmaps(matrices, xlabel, ylabel, titles=None, figsize=(5, 5),
cmap='Reds'):
"""显示矩阵热图"""
num_rows, num_cols = matrices.shape[0], matrices.shape[1]
fig, axes = plt.subplots(num_rows, num_cols, figsize=figsize,
sharex=True, sharey=True, squeeze=False)
for i, (row_axes, row_matrices) in enumerate(zip(axes, matrices)):
for j, (ax, matrix) in enumerate(zip(row_axes, row_matrices)):
pcm = ax.imshow(matrix.detach().numpy(), cmap=cmap,norm=norm)
if i == num_rows - 1:
ax.set_xlabel(xlabel)
if j == 0:
ax.set_ylabel(ylabel)
if titles:
ax.set_title(titles[j])
fig.colorbar(pcm, ax=axes, shrink=0.6)
# fig.colorbar(pcm, ax=axes, shrink=0.9)
A = data
B = F.softmax(A, dim=1)
print(B.shape)
C = B.unsqueeze(0).unsqueeze(0)
print(C.shape)
show_heatmaps(C, "cols", "rows")
参考资料


 2108
2108

 被折叠的 条评论
为什么被折叠?
被折叠的 条评论
为什么被折叠?
 到【灌水乐园】发言


