


- sklearn.datasets: Datasets
- make_** ⇒ generator
- load_** ⇒ loader
0. 可用数据集
iris(三个类别)digits(10个类别)
from sklearn.datasets import load_iris
    # from sklearn.datasets import load_digits
iris_data = load_iris()
>> type(iris_data)
sklearn.datasets.base.Bunch
>> dir(iris_data)
['DESCR', 'data', 'feature_names', 'target', 'target_names']
>> type(iris_data.data)
numpy.ndarray
>> type(iris_data.target)
numpy.ndarray
california_housing(在线下载)(回归问题)
from sklearn.datasets import fetch_california_housing
>> housing_data = fetch_california_housing()
>> type(housing_data)
sklearn.datasets.base.Bunch
>> dir(housing_data)
['DESCR', 'data', 'feature_names', 'target']
>> type(housing_data.data)
numpy.ndarray
>> type(housing_data.target)
numpy.ndarray
1. nonlinear example datasets
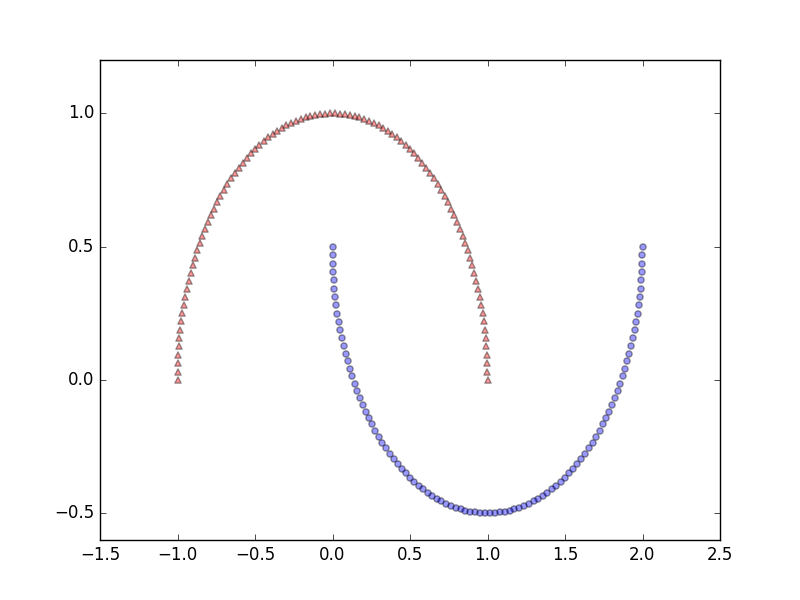
1.1 half_moon
产生非线性数据集,比如用以测试核机制的性能;
核方法最终的使命是:unfold the half-moons(展开)from sklearn.datasets import make_moons X, y = make_moons(n_samples=200, shuffle=True, random_state=123) plt.scatter(X[y==0, 0], X[y==0, 1], color='r', marker='^', alpha=.4) plt.scatter(X[y==1, 0], X[y==1, 1], color='r', marker='o', alpha=.4) plt.show()
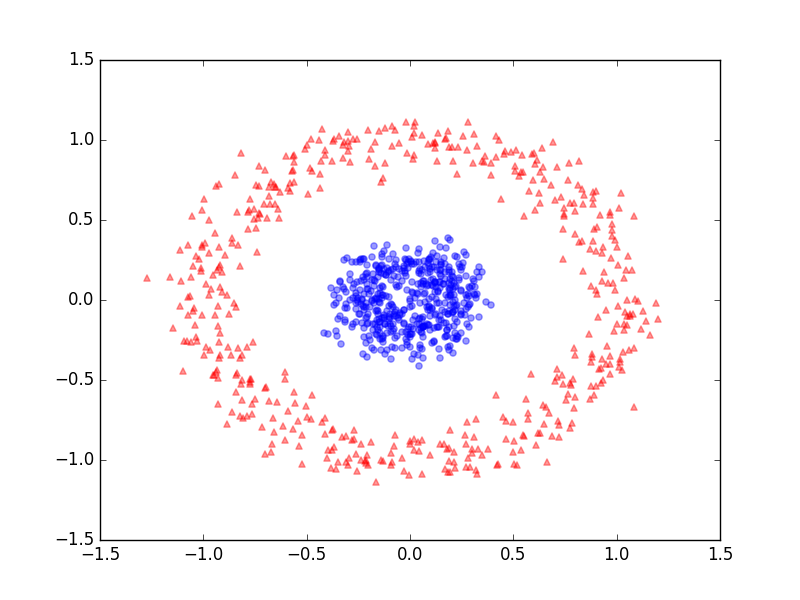
1.2 concentric circles
from sklearn.datasets import make_circles
X, y = make_circles(n_samples=1000, noise=.1, factor=.2, random_state=123)
plt.scatter(X[y==0, 0], X[y==0, 1], color='r', marker='^', alpha=.4)
plt.scatter(X[y==1, 0], X[y==1, 1], color='b', marker='o', alpha=.4)
plt.show()
2. datasets in sklearn
from sklearn import datasetsiris
>>> iris = datasets.load_iris()
>>> dir(iris)
>>> iris.features_names ['sepal length (cm)', 'sepal width (cm)', 'petal length (cm)', 'petal width (cm)'] >>> iris.target_names array(['setosa', 'versicolor', 'virginica'], dtype='<U10') >>> iris.data.shape (150, 4) # 训练样本 >>> iris.target.shape (150,) # 一维的训练样本digits
>> digits = datasets.load_digits()
>> dir(digits)
>> digits.data.target_names
...
make_blobs
from sklearn.datasets import make_blobs

X, y = make_blobs(n_samples=300, centers=4,
                  random_state=0, cluster_std=1.0)
plt.scatter(X[:, 0], X[:, 1], c=y, s=50, cmap='rainbow');
3. UCI 数据
Breast Cancer Wisconsin dataset
which contains 569 samples of malignant(恶性的) and benign(良性的) tumor cells.
The first two columns in the dataset store the unique ID numbers of the samples and the corresponding diagnoisi (M=malignant, B=benign), respectively.
The columns 3-32 contains 30 real-value features that have been computed from digitized images of the cell nuclei, which can be used to build a model to predict whether a tumor is benign or malignant.
import pandas as pd
df = pd.read_csv('https://archive.ics.uci.edu/ml/machine-learning-databases/'
                 'breast-cancer-wisconsin/wdbc.data', header=None)
X, y = df.values[:, 2:], df.values[:, 1]


 979
979

 被折叠的 条评论
为什么被折叠?
被折叠的 条评论
为什么被折叠?
 到【灌水乐园】发言


