


- plt.gca().grid(True):显示网格线;
- plt.colorbar():显示颜色条;
0. 可选参数
plt.imshow()
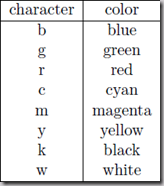
- cmap:plt.cm.binary(二值图)/plt.cm.gray(灰度图)/plt.cm.bone/plt.cm.hot
绘图
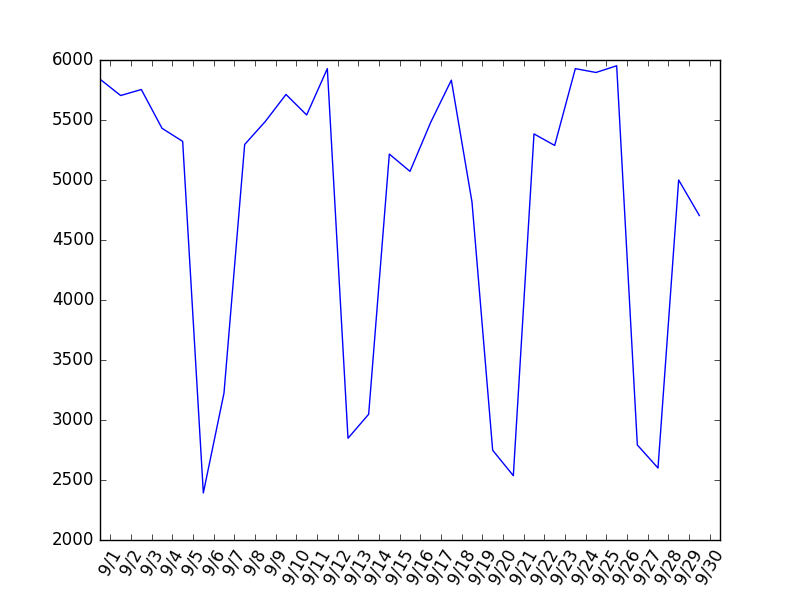
1. plt.xticks()
第一个参数接受坐标,第二个参数接受,各坐标显示的文本,关键字参数,如 rotation,表示文本显示时旋转的角度,为了达到一种美观的效果。
import matplotlib.pyplot as plt
import numpy as np

if __name__ == '__main__':
    data = [5840, 5704, 5754, 5431, 5322, 2392, 3225, 5296, 5488, 5713, 5542, 5928, 2848, 3048, 5216,
            5072, 5480, 5832, 4816, 2748, 2536, 5384, 5288, 5928, 5896, 5952, 2792, 2600, 5000, 4704]
    plt.plot(data)
    width = 1.
    plt.xticks(np.arange(len(data))+width/2, ['9/'+str(i) for i in range(1, 31)], rotation=60)
    plt.show()


 1953
1953

 被折叠的 条评论
为什么被折叠?
被折叠的 条评论
为什么被折叠?
 到【灌水乐园】发言


