


 文章详细介绍了SLAM算法中常用的轨迹误差评估指标,包括绝对轨迹误差(ATE)和相对位姿误差(RPE),以及如何使用EVO工具进行评估和可视化。EVO提供了如max,mean,median等不同误差统计量,并支持轨迹配准和不同误差部分的计算。此外,文章还提到了TUM和KITTI数据集的轨迹保存格式。
轨迹误差评估指标[APE/RPE]和EVO[TUM/KITTI]
Reference:
- 高翔,张涛 《视觉SLAM十四讲》
- 视觉SLAM基础:算法精度评价指标(ATE、RPE)
- EVO官方Wiki
在实际工程中,我们经常需要评估一个算法的估计轨迹与真实轨迹的差异来评价算法的精度。真实轨迹往往通过某些更高精度的系统获得,而估计轨迹则是由待评价的算法计算得到的。考虑一条估计轨迹 T e s t i , i T_{esti,i} Testi,i 和真实轨迹 T g t , i T_{gt,i} Tgt,i,其中 i = 1 , ⋅ ⋅ ⋅ , N i=1,\cdot\cdot\cdot,N i=1,⋅⋅⋅,N,那么我们可以定义一些误差指标来描述它们之间的差别。
1. ATE/APE
《视觉SLAM十四讲》上的命名感觉跟 EVO 稍微有一点点区别,比如绝对轨迹误差(Absolute Trajectory Error, ATE):
A
T
E
a
l
l
=
1
N
∑
i
=
1
N
∥
log
(
T
g
t
,
i
−
1
T
esti
,
i
)
∨
∥
2
2
,
\mathrm{ATE}_{\mathrm{all}}=\sqrt{\frac{1}{N} \sum_{i=1}^N\left\|\log \left(T_{\mathrm{gt}, i}^{-1} T_{\text {esti }, i}\right)^{\vee}\right\|_2^2},
ATEall=N1i=1∑N
log(Tgt,i−1Testi ,i)∨
22,这玩意儿应该就是 EVO 中的 绝对位姿误差(Absolute Pose Error, APE),后面这个概念统称 APE。
这个公式实际上是每个位姿李代数的均方根误差(Root-Mean-Squared Error, RMSE)。这种误差可以刻画两条轨迹的旋转和平移误差。同时,也有的地方仅考虑平移误差,从而可以定义绝对平移误差(Absolute Translational Error, ATE):
A
T
E
trans
=
1
N
∑
i
=
1
N
∥
trans
(
T
g
t
,
i
−
1
T
est
,
i
)
∥
2
2
\mathrm{ATE}_{\text {trans }}=\sqrt{\frac{1}{N} \sum_{i=1}^N\left\|\operatorname{trans}\left(\boldsymbol{T}_{\mathrm{gt}, i}^{-1} \boldsymbol{T}_{\text {est }, i}\right)\right\|_2^2}
ATEtrans =N1i=1∑N
trans(Tgt,i−1Test ,i)
22其中 trans 表示取括号内部变量的平移部分。因为从整条轨迹上看,旋转出现误差后,随后的轨迹在瓶以上也会出现误差,所以两种指标在实际中都适用。
2. RPE
RPE 定义的是相对的误差。例如,考虑
i
i
i 时刻到
i
+
Δ
t
i+\Delta t
i+Δt 时刻的运动,那么相对位姿误差(Relative Pose Error, RPE)可定义为:
R
P
E
all
=
1
N
−
Δ
t
∑
i
=
1
N
−
Δ
t
∥
log
(
(
T
g
t
,
i
−
1
T
g
t
,
i
+
Δ
t
)
)
−
1
(
T
esti
,
i
−
1
T
esti
,
i
+
Δ
t
)
)
∨
∥
2
2
,
\mathrm{RPE}_{\text {all }}=\sqrt{\left.\frac{1}{N-\Delta t} \sum_{i=1}^{N-\Delta t} \| \log \left(\left(T_{\mathrm{gt}, i}^{-1} T_{\mathrm{gt}, i+\Delta t}\right)\right)^{-1}\left(T_{\text {esti }, i}^{-1} T_{\text {esti }, i+\Delta t}\right)\right)^{\vee} \|_2^2,}
RPEall =N−Δt1i=1∑N−Δt∥log((Tgt,i−1Tgt,i+Δt))−1(Testi ,i−1Testi ,i+Δt))∨∥22,同样地,也可只取平移部分:
R
P
E
trans
=
1
N
−
Δ
t
∑
i
=
1
N
−
Δ
t
∥
trans
(
(
T
g
t
,
i
−
1
T
g
t
,
i
+
Δ
t
)
)
−
1
(
T
esti
,
i
−
1
T
esti
,
i
+
Δ
t
)
)
∥
2
2
\mathrm{RPE}_{\text {trans }}=\sqrt{\left.\frac{1}{N-\Delta t} \sum_{i=1}^{N-\Delta t} \| \operatorname{trans}\left(\left(\boldsymbol{T}_{\mathrm{gt}, i}^{-1} \boldsymbol{T}_{\mathrm{gt}, i+\Delta t}\right)\right)^{-1}\left(T_{\text {esti }, i}^{-1} T_{\text {esti }, i+\Delta t}\right)\right) \|_2^2}
RPEtrans =N−Δt1i=1∑N−Δt∥trans((Tgt,i−1Tgt,i+Δt))−1(Testi ,i−1Testi ,i+Δt))∥22
3. SLAM 轨迹保存格式
3.1 TUM
TUM 数据集格式:timestamp tx ty tz qx qy qz qw

3.2 KITTI
KITTI 数据集格式:
- 一行
12
12
12 个数据,表示 Pose(R+t):
r11 r12 r13 tx r21 r22 r23 ty r31 r32 r33 tz
- 可能还有另一个文件存放 timestamp

4. EVO
- 安装:
pip install evo
使用示例如下:
evo_ape kitti ground_truth.txt laser_odom.txt -r full --plot --plot_mode xyz
evo_rpe kitti ground_truth.txt laser_odom.txt -r trans_part --delta 100 --plot --plot_mode xyz
evo_ape 的默认形式是 -r trans_part,即计算的是这里的 ATE,想要计算 APE,可以使用 -r full。
-r 用法:
- -r full:表示同时考虑旋转和平移误差得到的ape,无单位(unit-less);
- -r trans_part:表示考虑平移部分得到的ape,单位为m;
- -r rot_part:表示考虑旋转部分得到的ape,无单位(unit-less);
- -r angle_deg:表示考虑旋转角得到的ape,单位°(deg);
- -r angle_rad:表示考虑旋转角得到的ape,单位弧度(rad);
4.1 评估指标
- max:表示最大误差;
- mean:平均误差;
- median:误差中位数;
- min:最小误差;
- rmse:均方根误差;
- sse:和方差、误差平方和;
- std:标准差
4.2 使用
可以先使用 EVO 仓库中自带的数据尝试
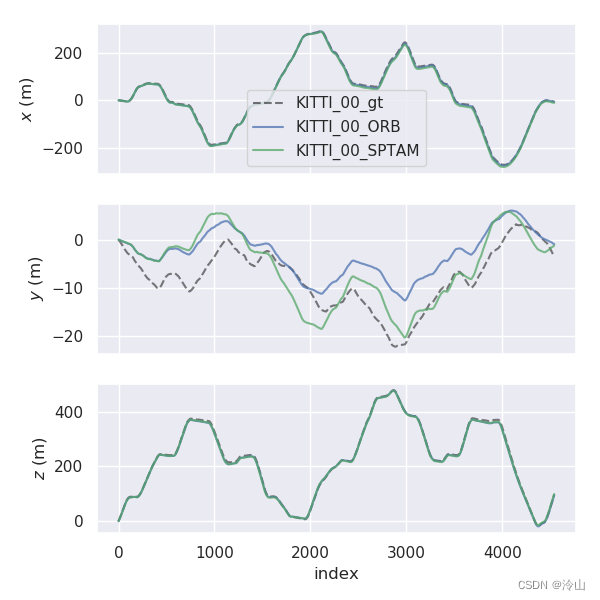
4.2.1 轨迹可视化
cd test/data
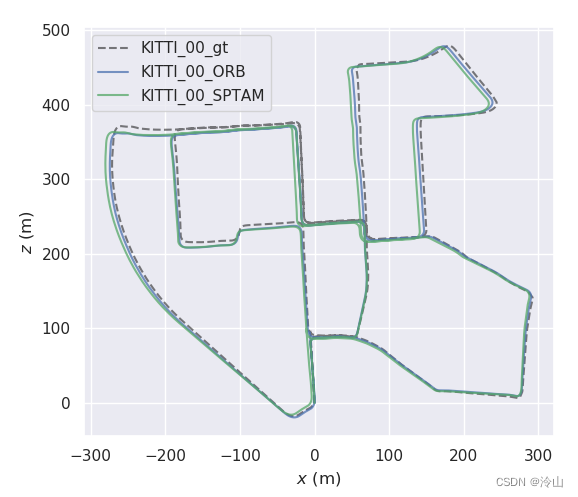
evo_traj kitti KITTI_00_ORB.txt KITTI_00_SPTAM.txt --ref=KITTI_00_gt.txt -p --plot_mode=xz
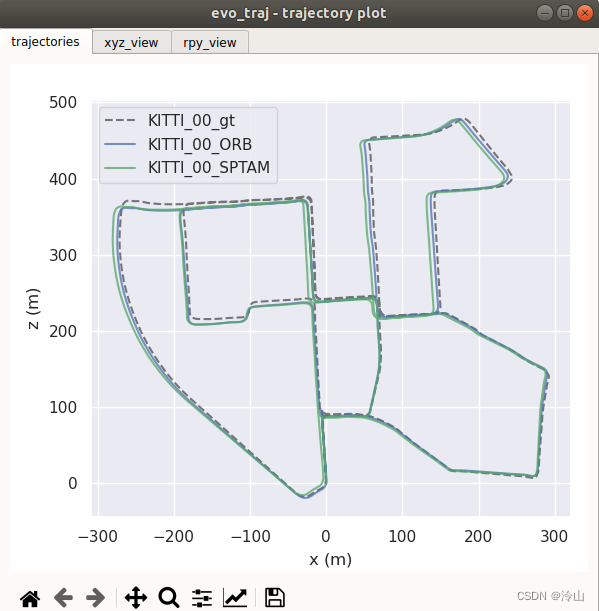
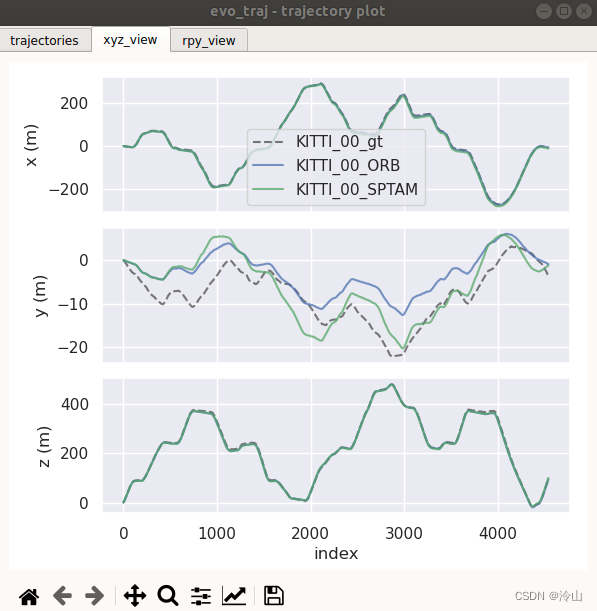
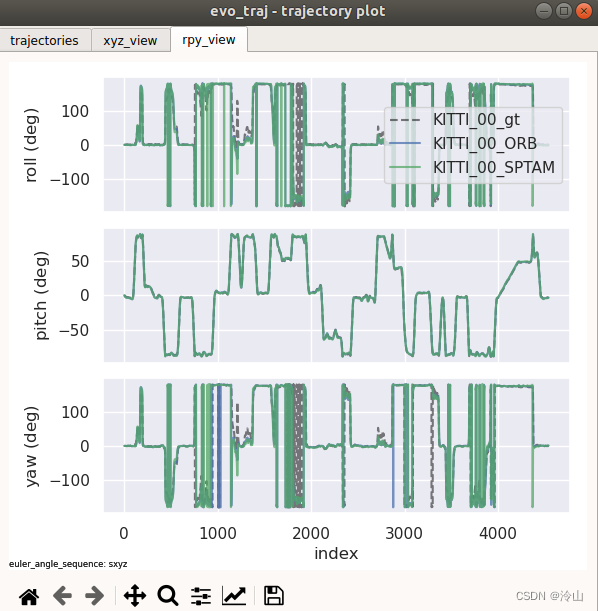
其中:
- –ref=ground_truth.txt:指明参考轨迹即真实轨迹;
- –plot或-p:表示画图;
- –plot_mode xy:表示图像投影在xoy平面上,其余可选参数为:xz,yx,yz,zx,zy,xyz。
4.2.2 APE
evo_ape kitti KITTI_00_gt.txt KITTI_00_ORB.txt -va --plot --plot_mode xz --save_plot ./tra1plot --save_results ./tra1.zip
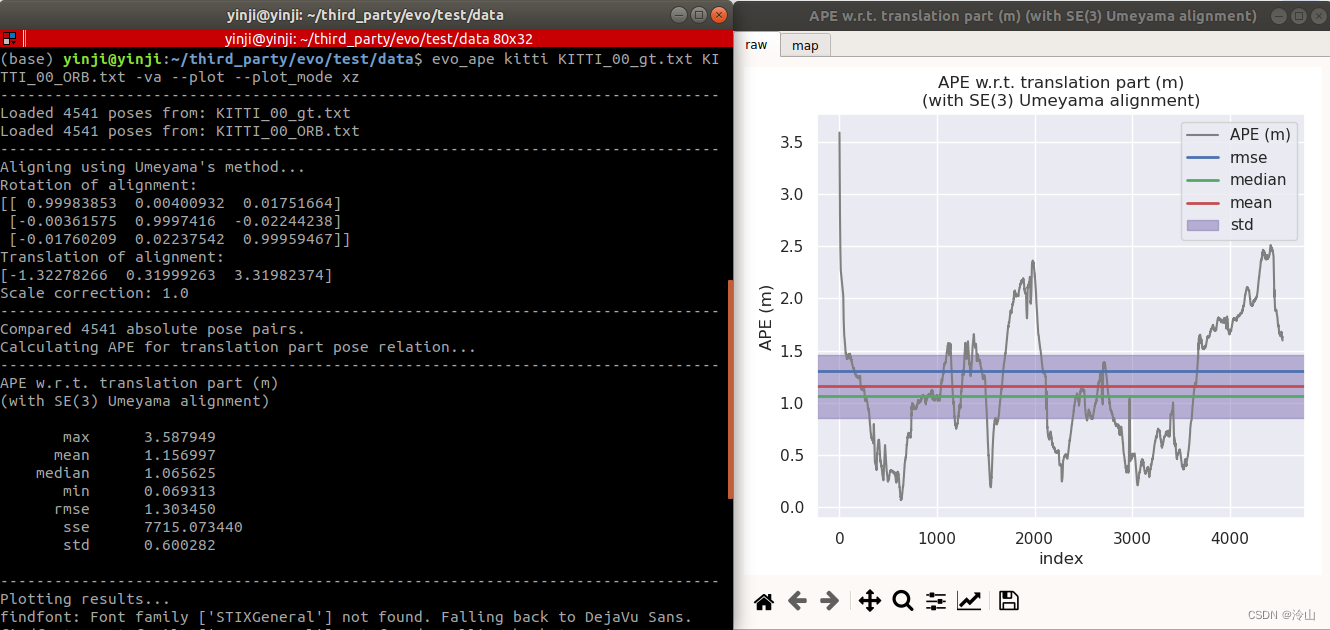

其中:
- -v或–verbose:指明输出文件数据的相关信息;
- -a或–align:指明对轨迹进行配准;
- –save_plot ./tra1plot:表示保存生成的图片,./tra1plot 这里写自己保存的地址;
- –save_results ./tra1.zip:表示保存计算结果,./tra1.zip 这里写自己保存的地址。
4.2.3 RPE
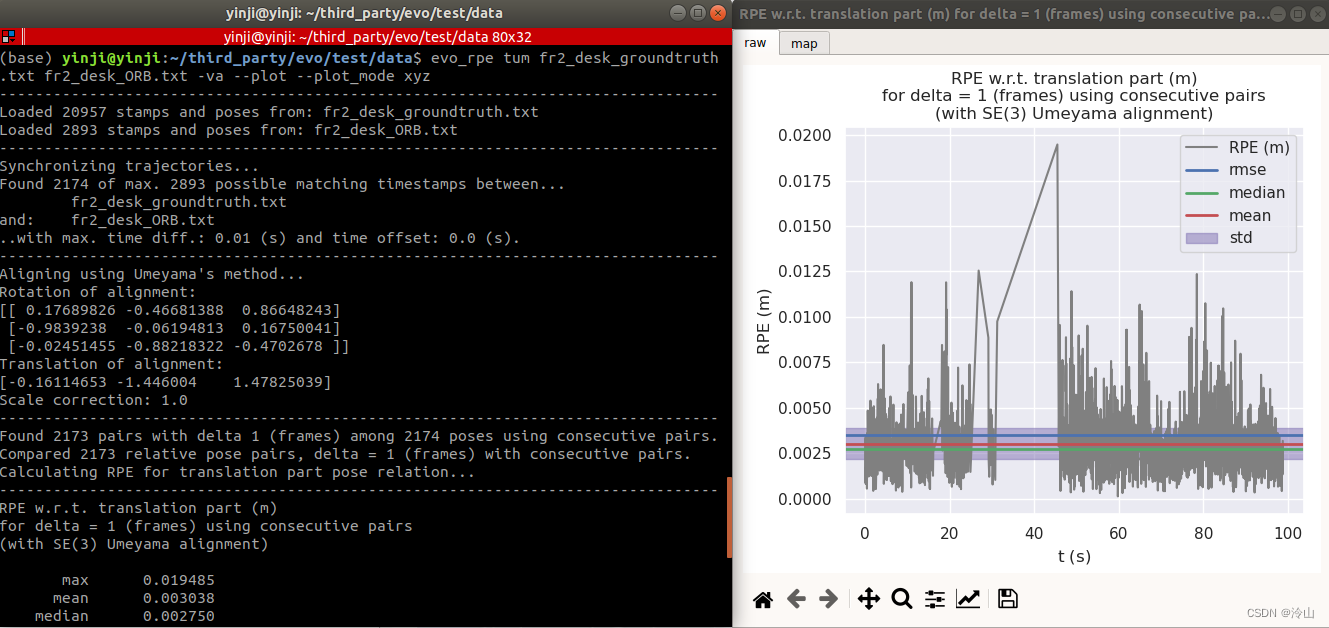
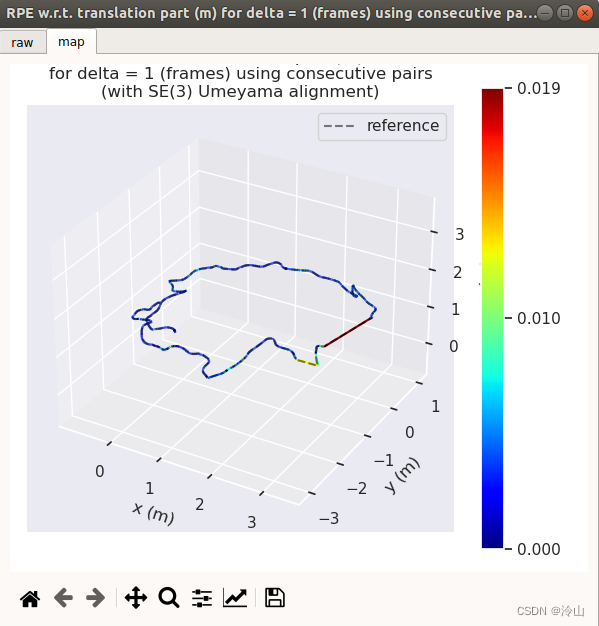
evo_rpe tum fr2_desk_groundtruth.txt fr2_desk_ORB.txt -va --plot --plot_mode xyz
4.3 其他常用命令
evo_traj - 用于分析,绘制或导出一个或多个轨迹的工具
evo_res - 用于比较evo_ape或evo_rpe一个或多个结果文件的evo_rpe
evo_fig - 用于重新打开序列化图的(实验性)工具(使用–serialize_plot保存)
evo_config - 全局设置和配置文件操作的工具
4.3.1 evo_traj
evo_traj 主要是用来画轨迹、输出轨迹文件、转换数据格式等功能。
-
绘制单个轨迹:
evo_traj euroc ground_truth.csv --plot
-
绘制多个轨迹:
evo_traj kitti KITTI_00_ORB.txt KITTI_00_SPTAM.txt --ref=KITTI_00_gt.txt -p --plot_mode=xz
-
轨迹尺度缩放
单目相机会存在尺度的不确定性,evo_traj 支持使用 -s或–correct_scale 参数进行Sim(3)上的对齐(旋转、平移与尺度缩放,能非常方便的用于 RTK/GNSS 对轮齿脉冲的标定) -
格式转换
如将 EuRoC 转成 TUM 格式,输出为 data.tum:evo_traj euroc data.csv --save_as_tum
4.4 其他参数
- --n_to_align n:对齐第一个轨迹前n个姿态。
4.5 一些高级设置
4.5.1 EVO 配置相关
4.5.1.1 查看配置信息
evo_config show # 除了显示当前配置外,还会在text最前面加上参数描述
evo_config show --brief # 仅显示当前配置
console_logging_format:
Format string for the logging module (affects only console output).
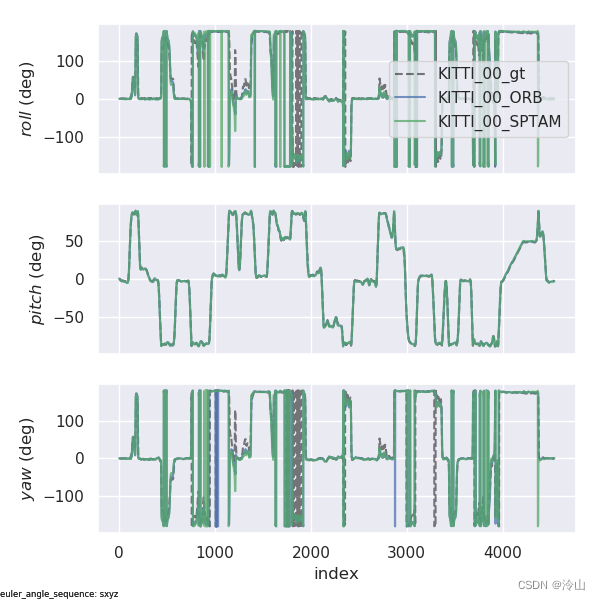
euler_angle_sequence:
Only used in evo_traj's RPY plot: Euler rotation axis sequence.
E.g. 'sxyz' or 'ryxy', where s=static or r=rotating frame.
See evo/core/transformations.py for more information.
global_logfile_enabled:
Whether to write a global logfile to the home folder.
Run 'evo pkg --logfile' to see the logfile location.
plot_axis_marker_scale:
Scaling parameter of pose coordinate frame markers. 0 will draw nothing.
plot_backend:
matplotlib backend - default is 'Qt5Agg' (if PyQt is installed) or 'TkAgg'.
plot_figsize:
The default size of one (sub)plot figure (width, height).
plot_fontfamily:
Font family string supported by matplotlib.
plot_fontscale:
Font scale value, see: https://seaborn.pydata.org/generated/seaborn.set.html
plot_invert_xaxis:
Invert the x-axis of plots.
plot_invert_yaxis:
Invert the y-axis of plots.
plot_linewidth: // 线宽,默认1.5
Line width value supported by matplotlib.
plot_mode_default:
Default value for --plot_mode used in evo_{traj, ape, rpe}.
plot_multi_cmap:
Color map for coloring plots from multiple data sources.
'none' will use the default color palette, see plot_seaborn_palette.
plot_pose_correspondences:
If enabled, lines will be plotted that connect corresponding poses between the reference and synced trajectories.
plot_pose_correspondences_linestyle:
Style of pose correspondence markers: 'solid', 'dashed', 'dashdot' or 'dotted'
plot_reference_alpha:
Alpha value of the reference trajectories in plots.
plot_reference_axis_marker_scale:
Scaling parameter of pose coordinate frame markers of reference trajectories. 0 will draw nothing.
plot_reference_color:
Color of the reference trajectories in plots.
plot_reference_linestyle: // 使用Matplotlib线样式画出参考轨迹(注意是reference trajectories)
matplotlib linestyle of reference trajectories in plots.
plot_seaborn_enabled:
Enables / disables seaborn's styling for plots.
Setting this to false will use the classic matplotlib style.
plot_seaborn_palette:
Default color cycle, taken from a palette of the seaborn package.
Can also be a list of colors.
See: https://seaborn.pydata.org/generated/seaborn.color_palette.html
plot_seaborn_style:
Defines the plot background/grid.
Options: 'whitegrid', 'darkgrid', 'white' or 'dark'.
plot_show_axis:
Enables / disables the plot axis in trajectory plots.
plot_show_legend:
Enables / disables the legend in trajectory plots.
plot_split:
Show / save each figure separately instead of a collection.
plot_start_end_markers:
Mark the start and end of a trajectory with a symbol.
Start is marked with a circle, end with a cross.
plot_statistics:
Statistics that are included in plots of evo_{ape, rpe, res}.
Can also be set to 'none'.
plot_texsystem:
'xelatex', 'lualatex' or 'pdflatex', see: https://matplotlib.org/users/pgf.html
plot_trajectory_alpha:
Alpha value of non-reference trajectories in plots.
plot_trajectory_cmap:
matplotlib color map used for mapping values on a trajectory.
plot_trajectory_length_unit:
Length unit in which trajectories are displayed.
Supported units: mm, cm, m, km
plot_trajectory_linestyle: // 使用Matplotlib线样式画出非参考轨迹(即原轨迹)
matplotlib linestyle of non-reference trajectories in plots.
plot_usetex:
Use the LaTeX renderer configured in plot_texsystem for plots.
plot_xyz_realistic:
Equal axes ratio for realistic trajectory plots.
Turning it off allows to stretch the plot without keeping the ratio.
pygments_style:
Style used for the syntax highlighting in evo_config.
See here for available styles: https://pygments.org/styles/
ros_map_alpha_value:
Alpha value for blending ROS map image slices.
ros_map_cmap:
matplotlib colormap for coloring ROS map cells.
ros_map_enable_masking:
Enables/disables the masking of unknown cells from a map image,
based on the 'ros_map_unknown_cell_value'.
ros_map_unknown_cell_value:
uint8 value that represents unknown cells in a ROS map image.
Used to remove unknown cell pixels when a ROS map is added to a plot.
map_saver uses 205, other tools might not.
(for example, Cartographer uses 128 for images of probability grids)
Has no effect if ros_map_enable_masking is set to false.
ros_map_viewport:
How to change the plot axis limits (viewport) when plotting a map.
One of the following options: keep_unchanged, zoom_to_map, update
save_traj_in_zip:
Store backup trajectories in result zip files (increases size).
table_export_data:
Which data to export: 'info', 'stats' or 'error_array'.
table_export_format:
Format for exporting tables, e.g. 'csv', 'excel', 'latex', 'json'...
table_export_transpose:
Transpose tables for export.
tf_cache_lookup_frequency:
Frequency for looking up transformations when loading trajectories
from a TF topic, in Hz.
tf_cache_max_time:
TF transform cache time in seconds.
--------------------------------------------------------------------------------
/home/yh/.evo/settings.json
--------------------------------------------------------------------------------
{
"console_logging_format": "%(message)s",
"euler_angle_sequence": "sxyz",
"global_logfile_enabled": false,
"plot_axis_marker_scale": 0.0,
"plot_backend": "TkAgg",
"plot_figsize": [
6,
6
],
"plot_fontfamily": "sans-serif",
"plot_fontscale": 1.0,
"plot_invert_xaxis": false,
"plot_invert_yaxis": false,
"plot_linewidth": 1.5,
"plot_mode_default": "xyz",
"plot_multi_cmap": "none",
"plot_pose_correspondences": false,
"plot_pose_correspondences_linestyle": "dotted",
"plot_reference_alpha": 0.5,
"plot_reference_axis_marker_scale": 0.0,
"plot_reference_color": "black",
"plot_reference_linestyle": "--",
"plot_seaborn_enabled": true,
"plot_seaborn_palette": "deep6",
"plot_seaborn_style": "darkgrid",
"plot_show_axis": true,
"plot_show_legend": true,
"plot_split": false,
"plot_start_end_markers": false,
"plot_statistics": [
"rmse",
"median",
"mean",
"std",
"min",
"max"
],
"plot_texsystem": "pdflatex",
"plot_trajectory_alpha": 0.75,
"plot_trajectory_cmap": "jet",
"plot_trajectory_length_unit": "m",
"plot_trajectory_linestyle": "-",
"plot_usetex": false,
"plot_xyz_realistic": true,
"pygments_style": "monokai",
"ros_map_alpha_value": 1.0,
"ros_map_cmap": "Greys_r",
"ros_map_enable_masking": true,
"ros_map_unknown_cell_value": 205,
"ros_map_viewport": "keep_unchanged",
"save_traj_in_zip": false,
"table_export_data": "stats",
"table_export_format": "csv",
"table_export_transpose": true,
"tf_cache_lookup_frequency": 10,
"tf_cache_max_time": 10000.0
}
--------------------------------------------------------------------------------
See text above for parameter descriptions.
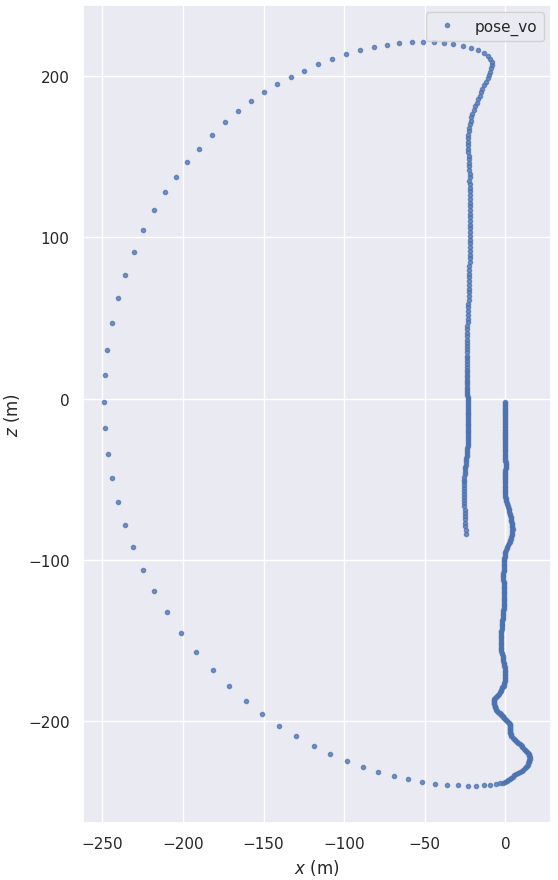
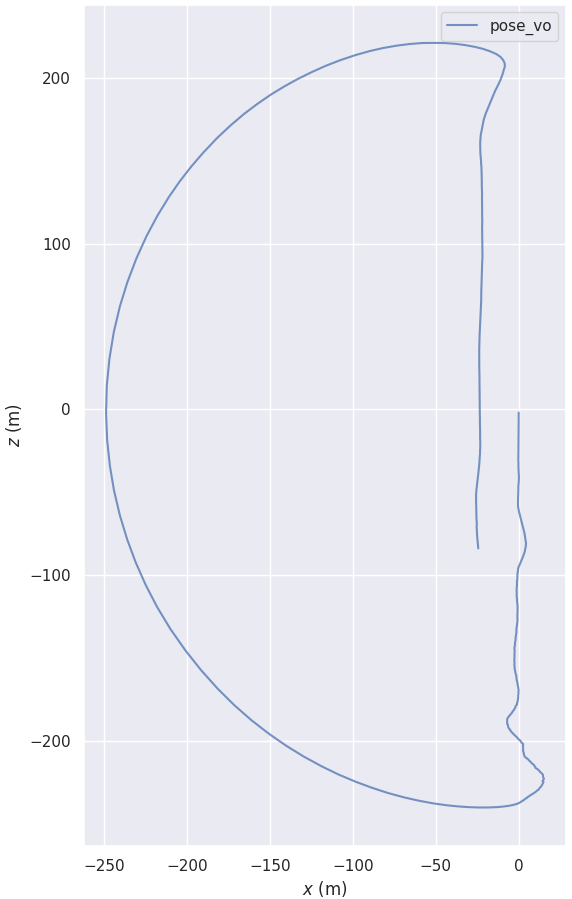
4.5.1.2 EVO 调整线型
EVO 自带作图不是很好用,并不能直观反应每一帧轨迹的行进距离。根据上面写的方法,将线性修改为点格式:
evo_config set plot_trajectory_linestyle .
可以看到,现在的显示就很直观了。
4.6 EVO 常见问题
- EVO 录数据时经常会出现以下错误:
[ERROR] TUM trajectory files must have 8 entries per row and no trailing delimiter at the end of the rows (space).
 注意除了格式需要正确外,每行末尾不要有空格。


 2万+
2万+

 被折叠的 条评论
为什么被折叠?
被折叠的 条评论
为什么被折叠?
 到【灌水乐园】发言


